0380
Population Brain Perfusion Imaging: Arterial Spin Labeling in UK Biobank1Wellcome Centre for Integrative Neuroimaging, FMRIB, Nuffield Department of Clinical Neurosciences, University of Oxford, Oxford, United Kingdom, 2Sir Peter Mansfield Imaging Centre, School of Medicine, University of Nottingham, Nottingham, United Kingdom, 3Dementia Research Centre, UCL Queen Square Institute of Neurology, University College London, London, United Kingdom, 4Dept of Brain Repair and Rehabilitation, UCL Queen Square Institute of Neurology, University College London, London, United Kingdom, 5MR Physics group, Radiology Department, Great Ormond Street Hospital, London, United Kingdom, 6Fraunhofer Institute for Digital Medicine MEVIS, Bremen, Germany, 7Department of Brain Sciences, Imperial College London, London, United Kingdom
Synopsis
Keywords: Arterial spin labelling, Arterial spin labelling
UK Biobank is an ongoing study which will acquire brain imaging in 100,000 participants, along with detailed lifestyle, biochemical and genetic information, and long-term health records. Here we describe the recent addition of arterial spin labeling (ASL) perfusion imaging to UK Biobank, with preliminary analyses of the first ~3,500 subjects. These revealed a range of highly significant associations between ASL metrics and non-imaging measures (e.g., blood pressure), as well as other imaging measures (e.g., white matter hyperintensity volume). This should become a useful resource for studying perfusion differences across a population and prior to disease onset.Introduction
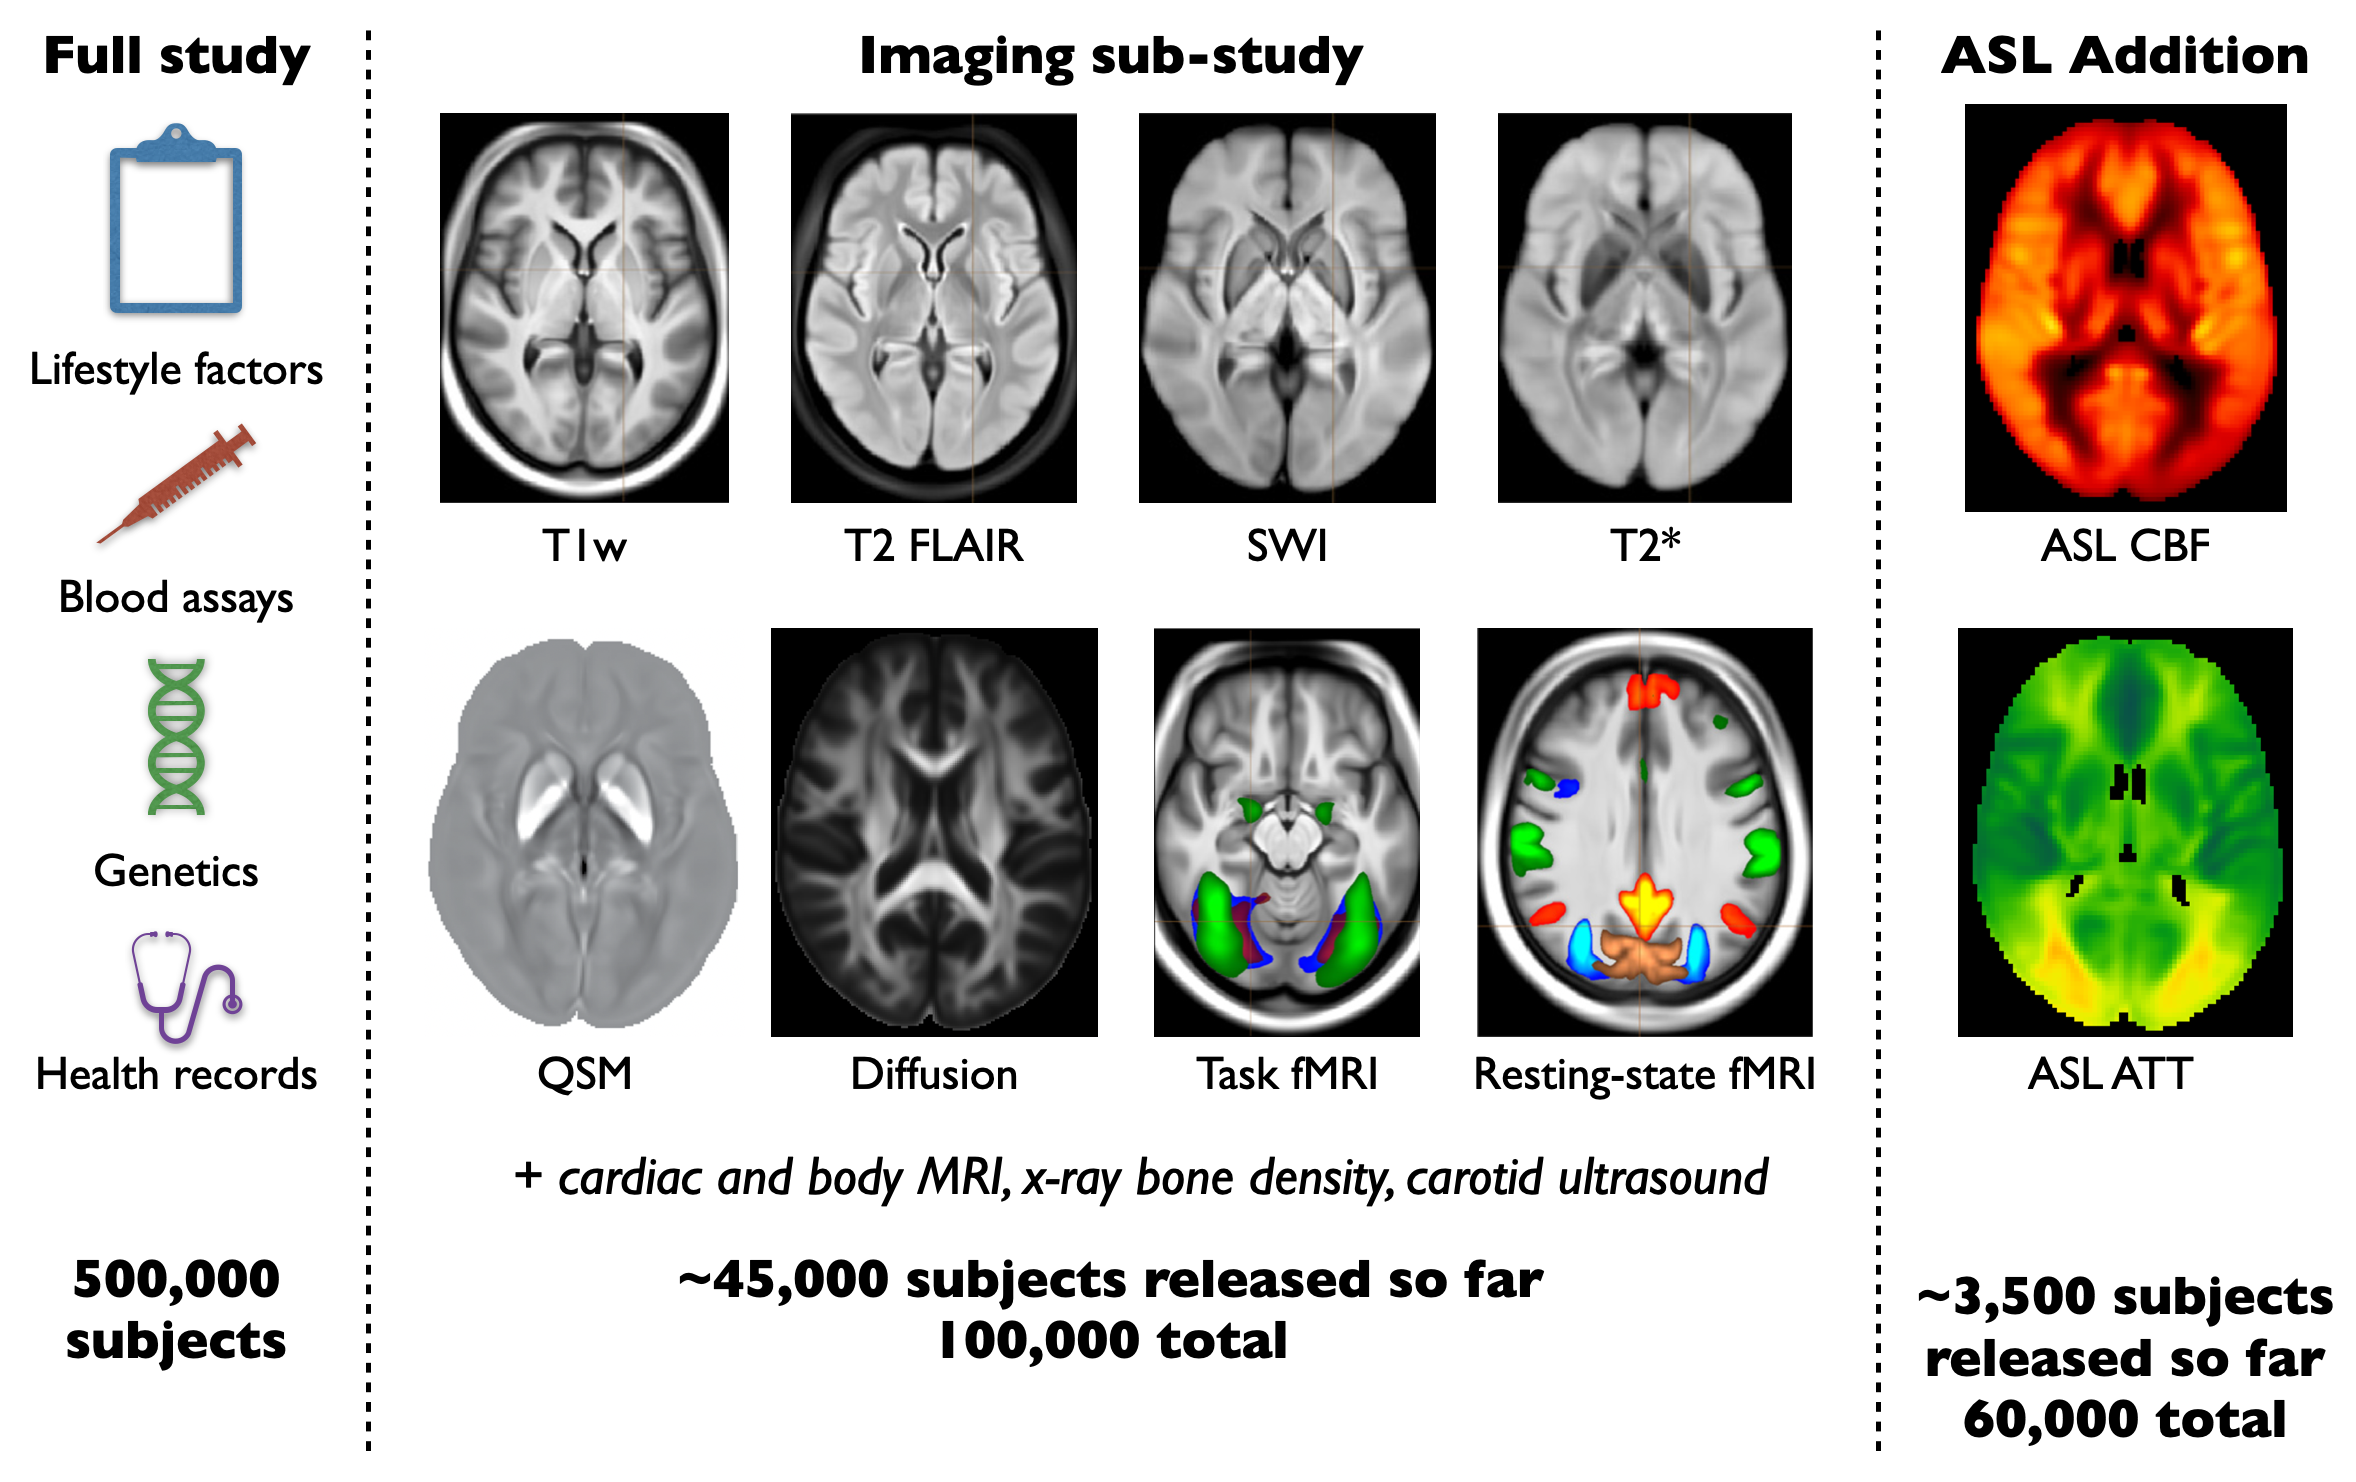
The ability to find early markers of disease is a major promise of medical imaging, but the identification of pre-symptomatic patients, who might benefit the most from early intervention, is often impossible. UK Biobank (UKB)1 aims to address this by acquiring imaging data in 100,000 subjects, including a range of brain MRI modalities2 (Figure 1). Long-term health records are also becoming available, enabling retrospective examination of (earlier) brain imaging data in light of later manifestation of disease symptoms. Until recently, only structural and functional MRI brain data have been available, without any direct measurement of brain physiology.UKB recently announced follow-up (second timepoint) scanning on 60,000 of the 100,000 subjects, which will include arterial spin labeling (ASL) perfusion imaging for the first time. Here we describe the introduction of ASL into the UK Biobank brain MRI protocol and present preliminary results from the first ~3,500 subjects.
Methods
Subjects
Subjects were recruited into UKB aged 49-60 years at baseline, giving informed consent1,2. Data collection is ongoing, but here we report on results from the first release of 3,414 subjects (1820 female) in which ASL data were acquired. All UKB data are available to researchers world-wide3.Protocol
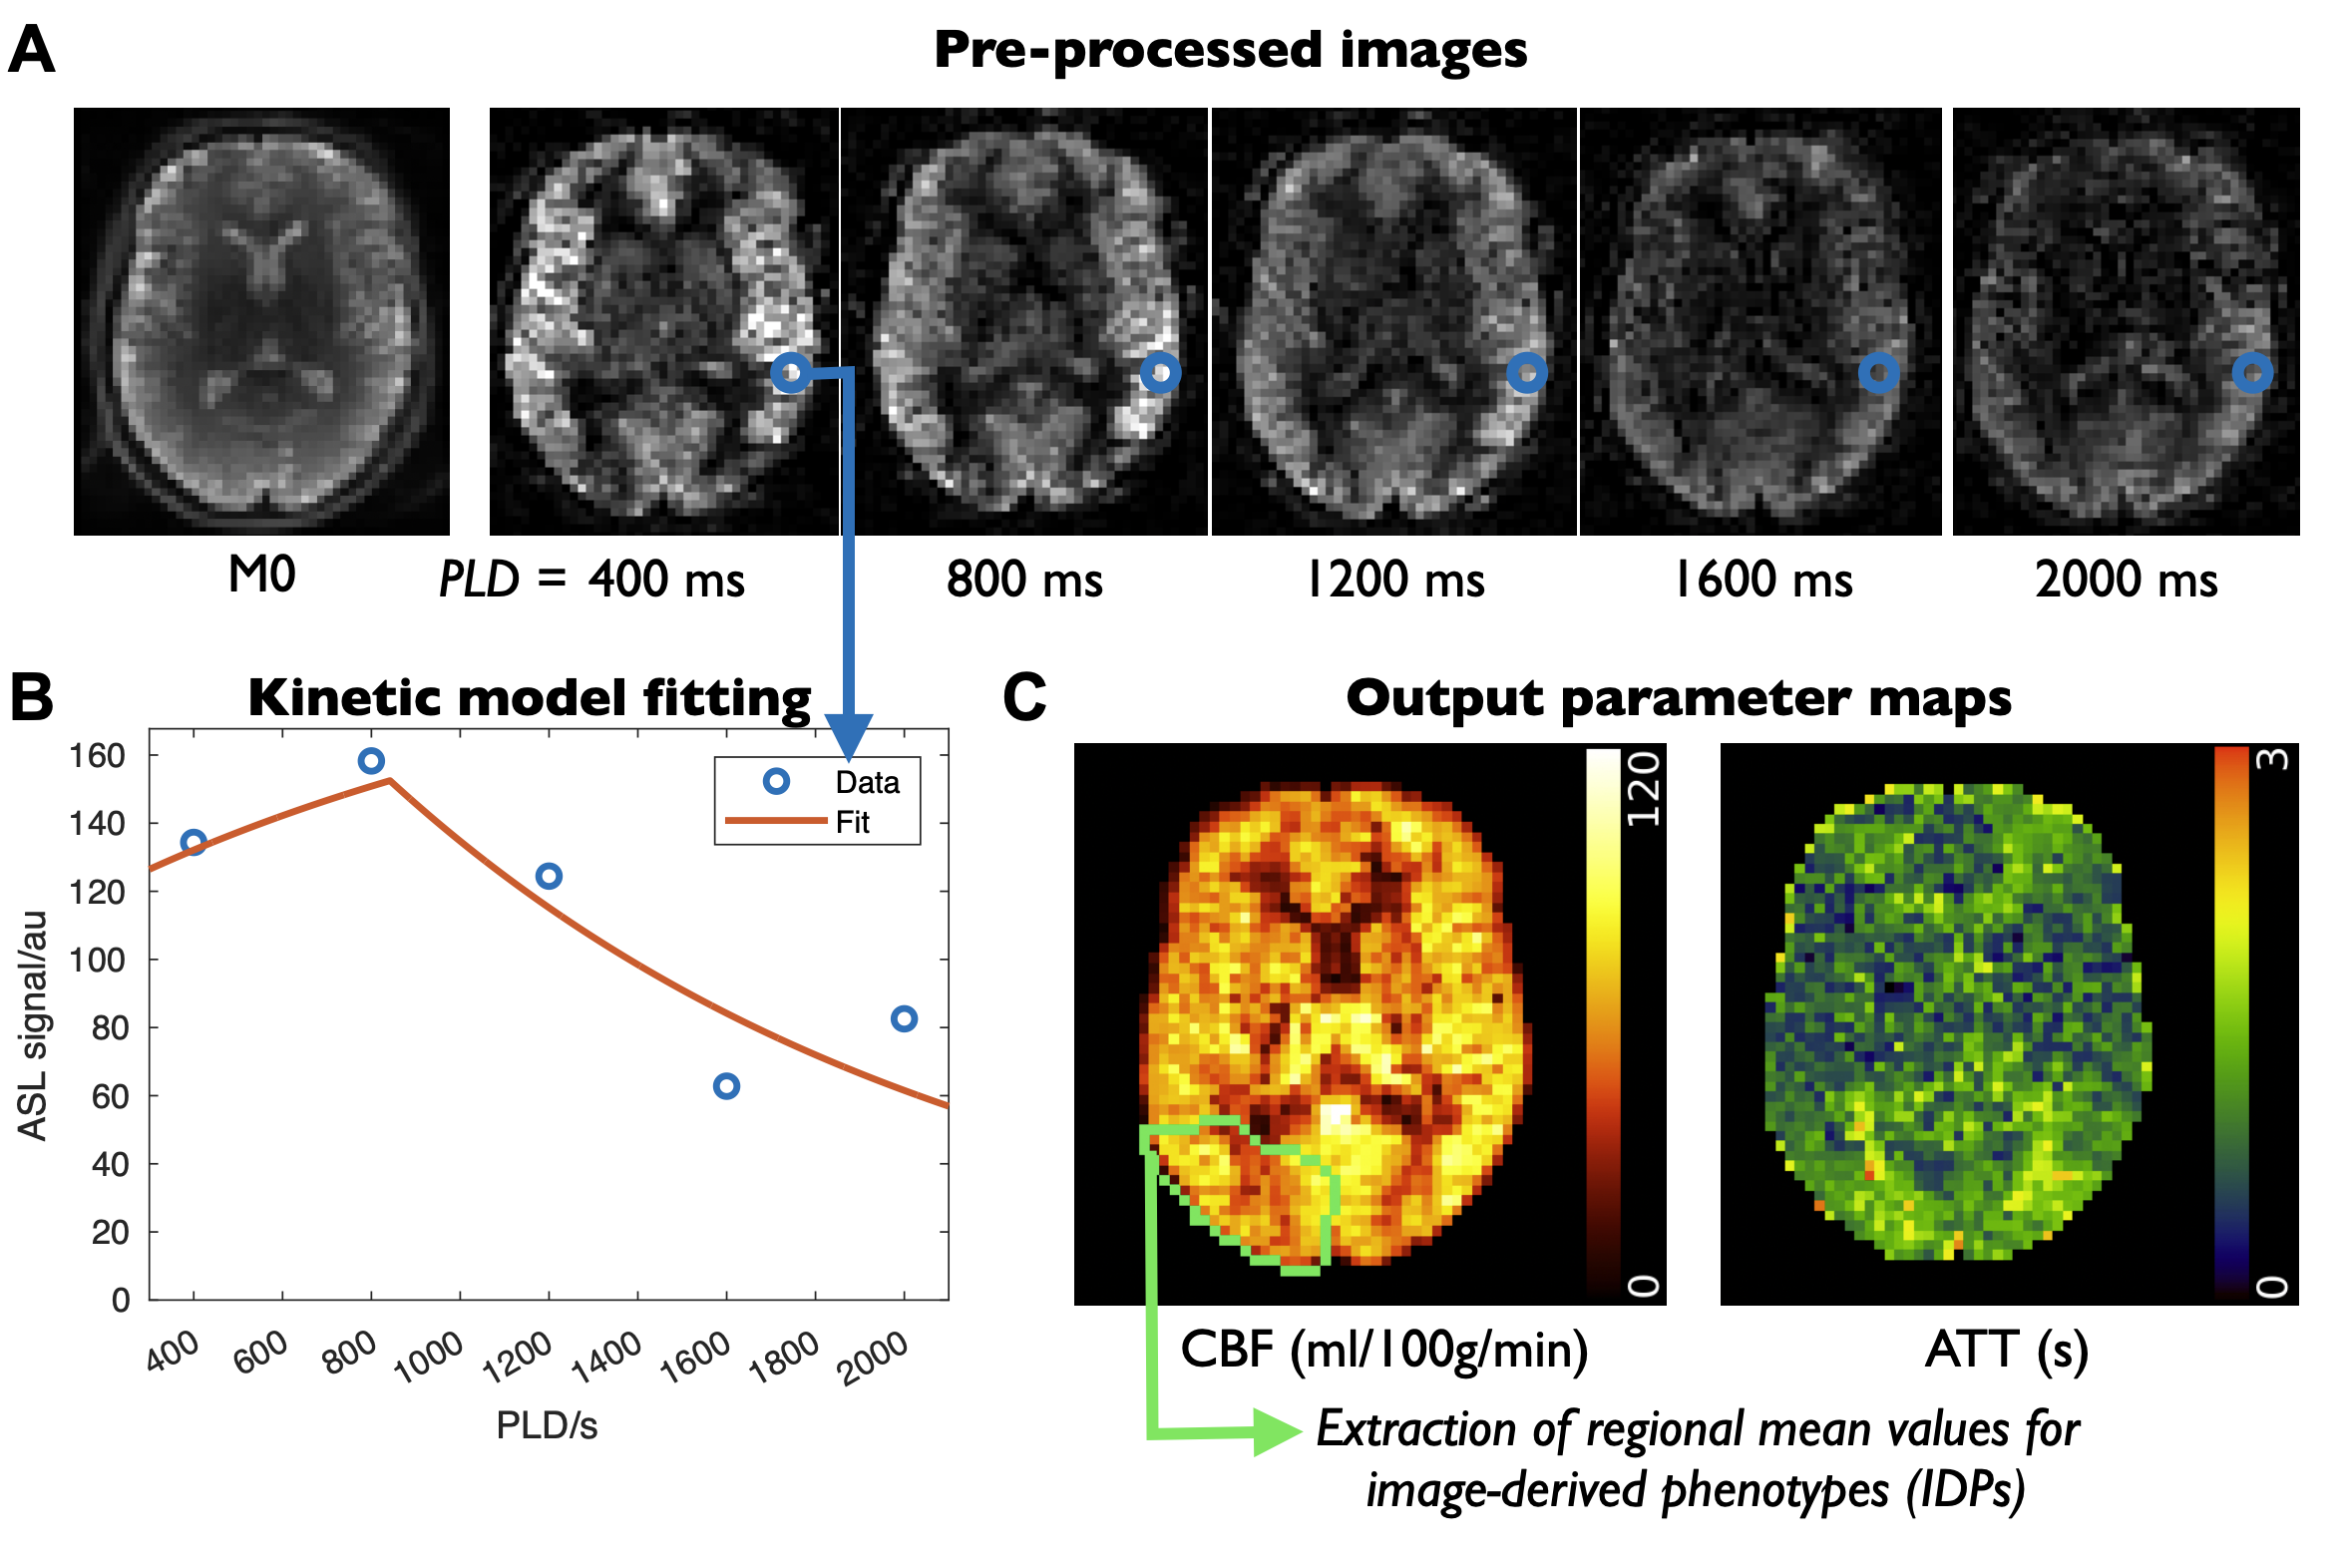
The original UKB brain imaging protocol included T1-weighted, T2-fluid attenuated inversion recovery (FLAIR), susceptibility weighted (swMRI, providing T2* and quantitative susceptibility maps [QSM]), diffusion MRI, and both task and resting functional MRI acquisitions2. For follow-up imaging, 2 minutes of scan time were available for ASL. A pseudocontinuous4 ASL preparation (1800ms) was used with pre-saturation and two global inversion pulses for background suppression, and a 2-shot segmented 3D-GRASE readout (3.4x3.4x4.5mm, 32 slices, 120° refocusing flip angle, right-left phase encoding, 29.4ms TE, 6/8 slice partial Fourier)5 to maximize SNR efficiency6. Multiple postlabeling delays (PLDs) were acquired (400,800,1200,1600,2000ms) to allow arterial transit time (ATT) to be estimated, reducing the impact of this confounding factor and adding an additional physiological parameter map as an output. A calibration (M0) image without background suppression was also acquired to allow cerebral blood flow (CBF) to be quantified.Processing pipeline
The ASL processing pipeline incorporates BASIL7 and other FSL8 tools, similar to previous work9, and is freely available10. Data were corrected for motion, gradient non-linearity and B0-induced distortion (using a field map derived from diffusion data) before control-label subtraction. The multi-PLD data were fit to a kinetic model11, incorporating a macrovascular component12, and voxelwise calibrated with the M0 image to obtain quantitative maps of CBF and ATT (Figure 2). These maps were registered to standard (MNI) space and precision-weighted mean CBF and ATT values extracted from various regions of interest (ROIs: all of gray/white matter, right/left brain lobes, vascular territories, sub-cortical structures, including both all-tissue and gray matter only versions) to create image-derived phenotypes (IDPs).Preliminary analysis
To demonstrate the potential of this data, we present results from three preliminary analyses, using both CBF and ATT IDPs and voxelwise data in standard space: 1) a simple correlation with age, to demonstrate that expected variations are robustly identified with IDP and voxelwise data, despite the short imaging protocol; 2) correlation with non-imaging phenotypes (such as lifestyle factors and cardiac measurements), after deconfounding13 with a number of standard factors (e.g., age, sex, scanner) as well as hematocrit and cortical thickness, which are known to affect the ASL signal (via blood T1 and partial voluming, respectively); 3) correlation with other brain MRI IDPs.Results and Discussion
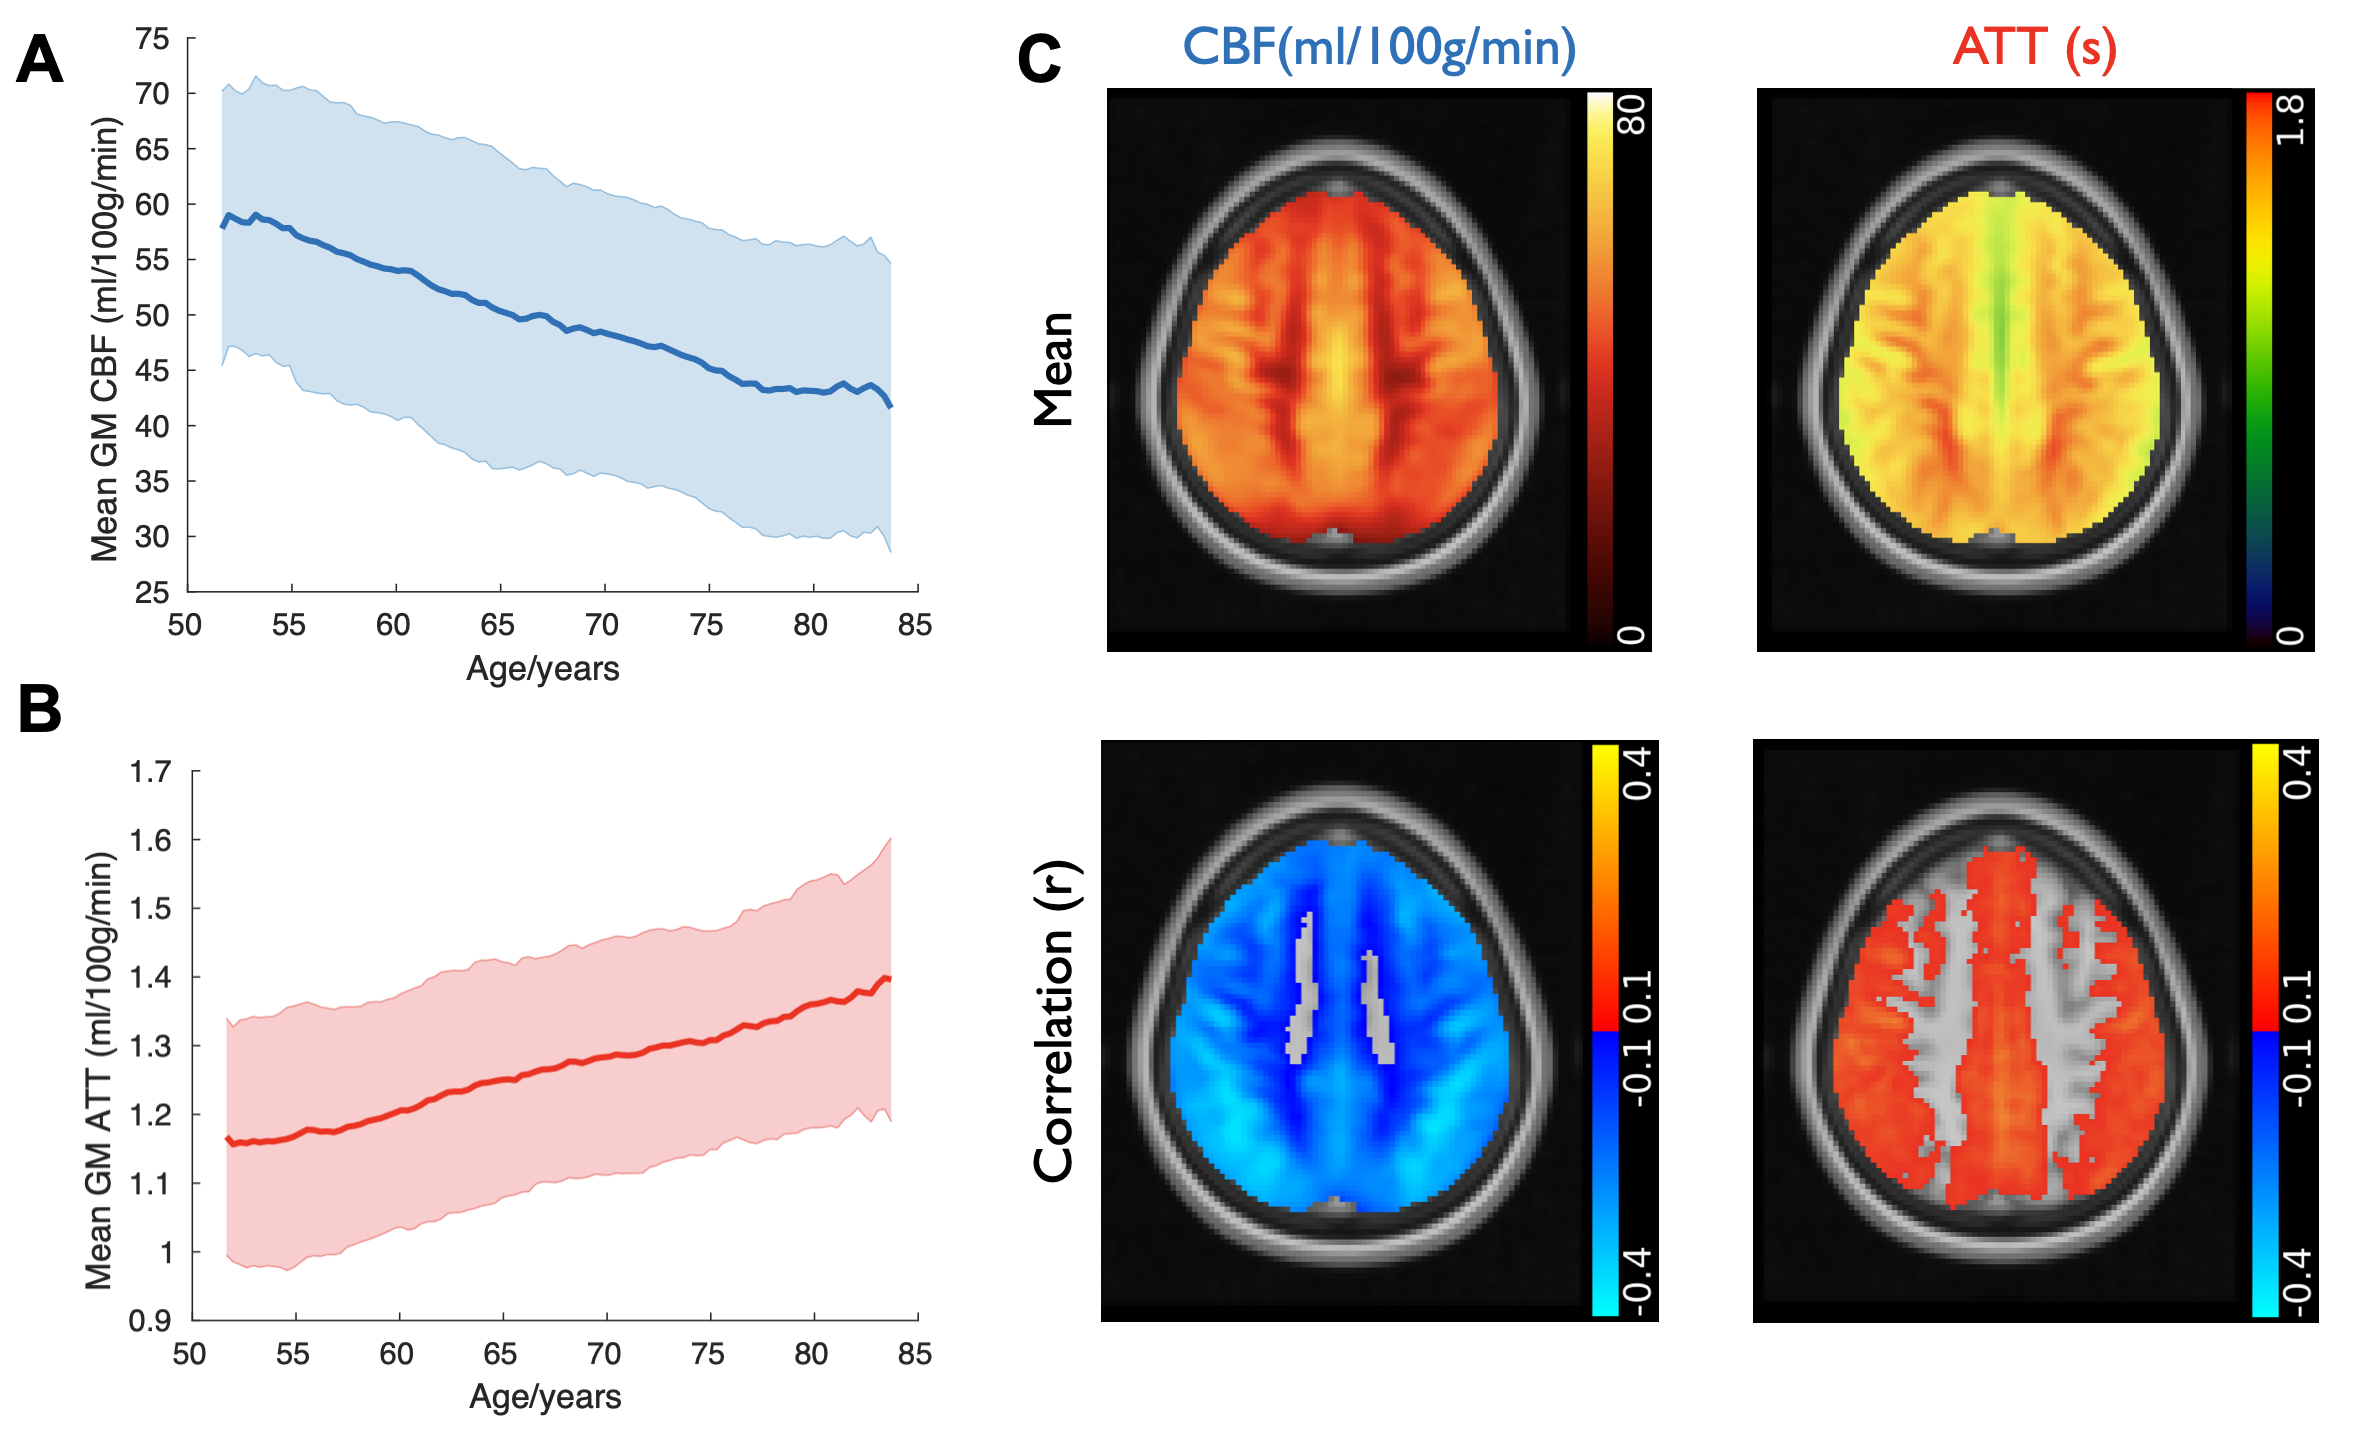
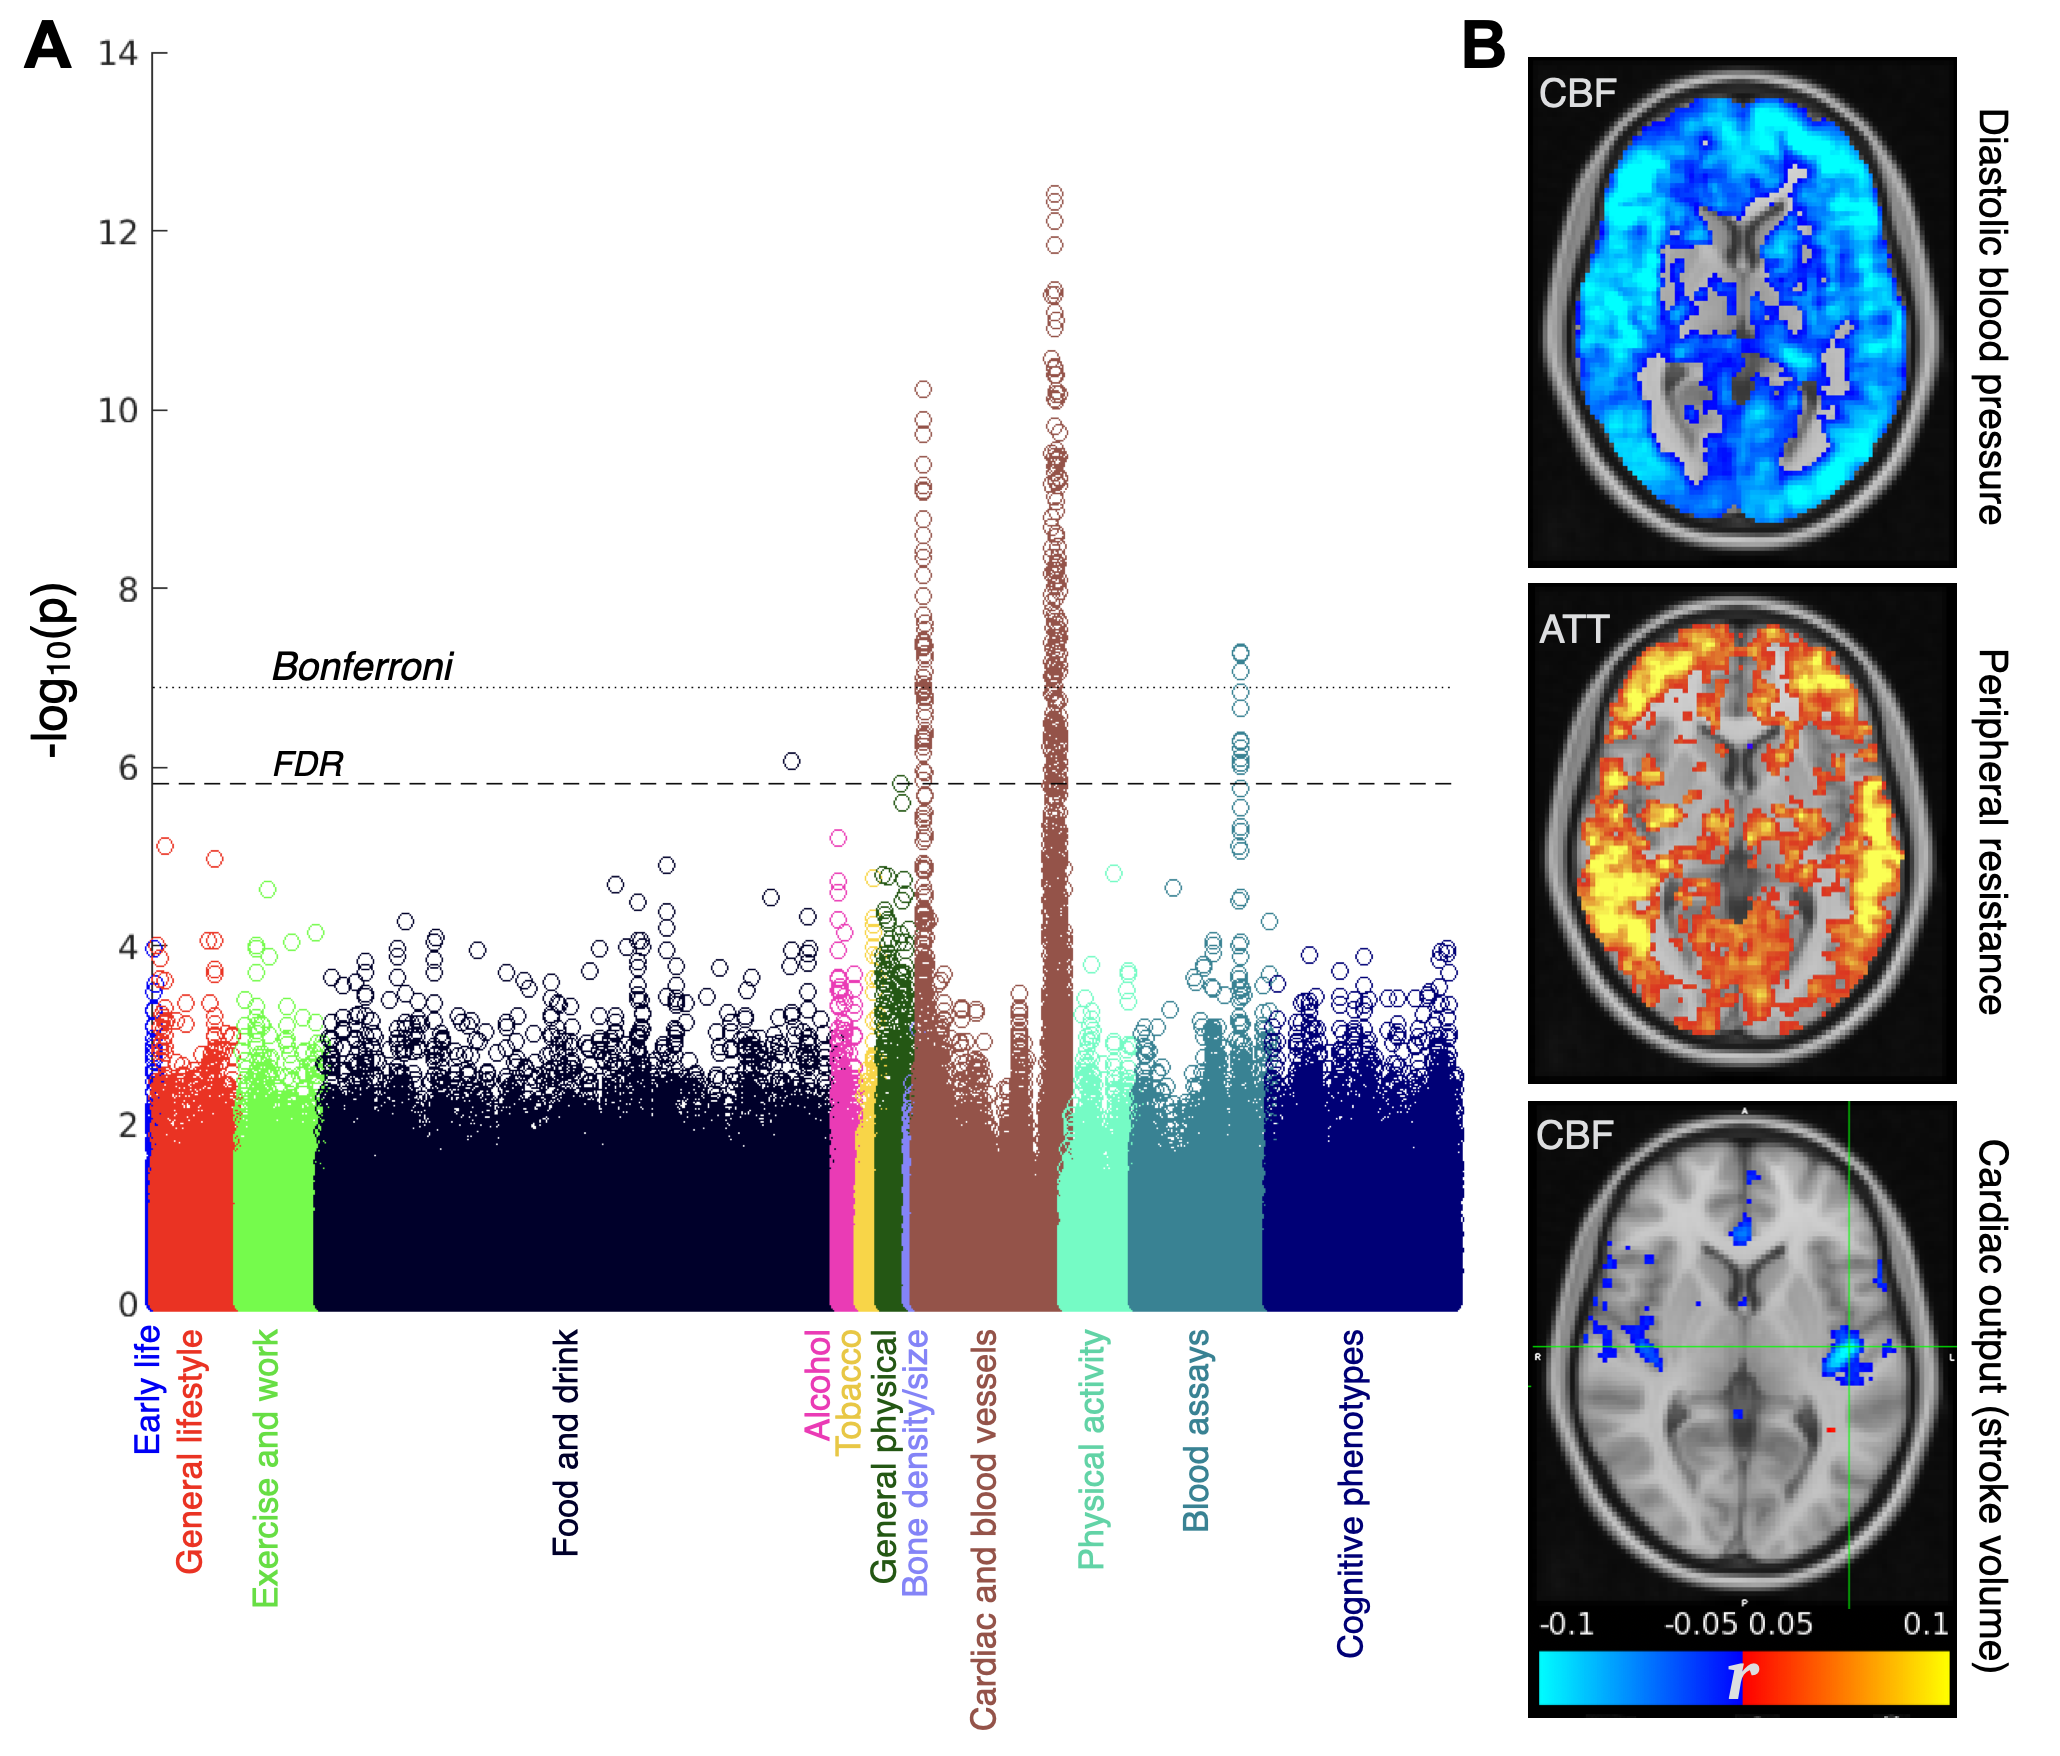
As expected, mean gray matter CBF decreased and ATT increased with increasing age (Figure 3A,B). Once sufficient data are acquired, “nomograms” showing percentile normative curves, could be generated to help identify individuals with abnormal perfusion for a given demographic. These correlations were present within most brain voxels, especially within the gray matter (Figure 3C).ASL IDPs showed strong correlations with many non-imaging measures, especially those relating to cardiac/blood vessel measurements and blood assays, which were still significant after multiple comparison corrections (Bonferroni and false discovery rate [FDR], Figure 4A). Examining spatial maps of these correlations from voxelwise data (Figure 4B) revealed some factors which were associated with widespread CBF changes (e.g., blood pressure), or delayed blood arrival (peripheral resistance), but also more spatially localized changes: for example, cardiac output was associated with CBF differences in the left insula, a region related to cardiac regulation14.
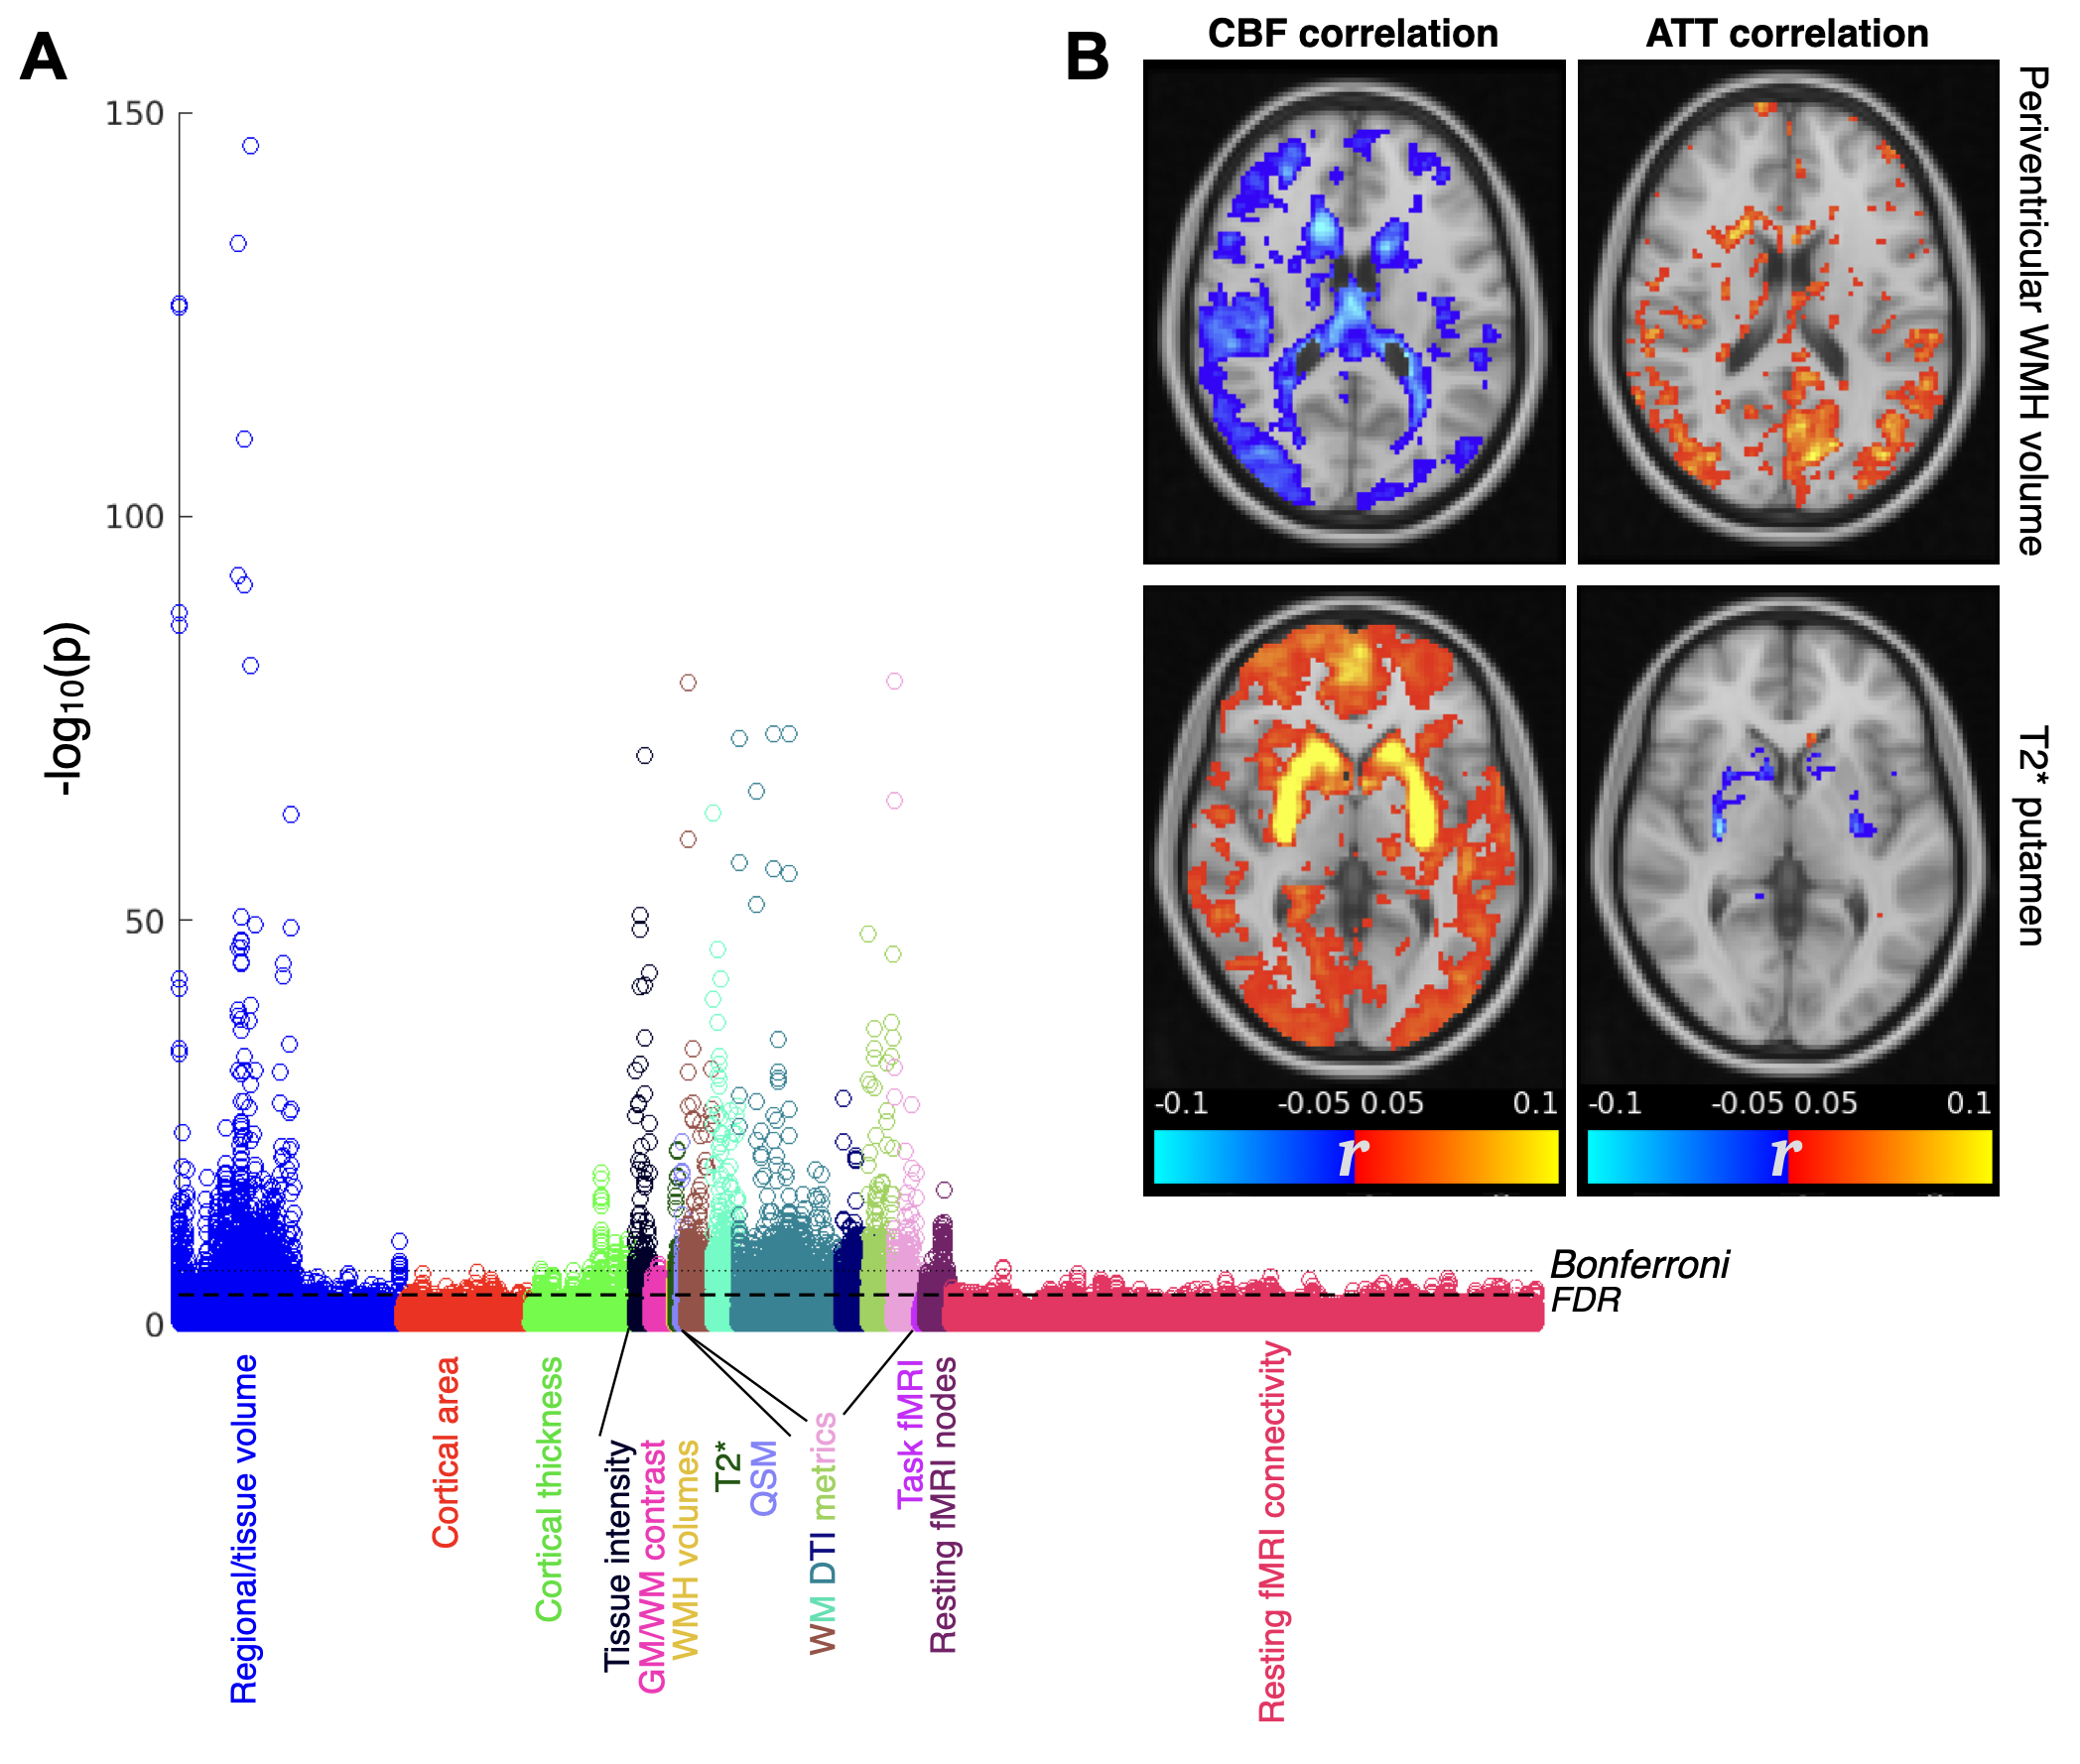
There were also strong associations between ASL IDPs and other brain imaging measures across a range of modalities (Figure 5A). Some interesting spatial maps were found relating to these correlations (Figure 5B), including reduced CBF and increased ATT in periventricular regions being associated with the volume of periventricular white matter hyperintensities (WMH). This suggests the statistical power available from the large number of subjects included in this study can help compensate for noisy ASL white matter perfusion measurements on the individual level15,16. ASL measures were also correlated with swMRI and T2* changes in some subcortical regions such as the putamen.
Conclusions
The statistical power afforded by using a large number of subjects, along with the rich phenotype, genetic, health outcome and other imaging data included in UK Biobank, should make it a useful resource for studying perfusion differences across a population and prior to disease onset.Acknowledgements
TO was supported by a Sir Henry Dale Fellowship jointly funded by the Wellcome Trust and the Royal Society (Grant Number 220204/Z/20/Z). Other funding: WT (203139/Z/16/Z 215573/Z/19/Z 202788/Z/16/Z). Data from UKB under application 8107.
References
1. Sudlow C, Gallacher J, Allen N, et al. UK Biobank: An Open Access Resource for Identifying the Causes of a Wide Range of Complex Diseases of Middle and Old Age. PLOS Med. 2015;12:e1001779.
2. Miller KL, Alfaro-Almagro F, Bangerter NK, et al. Multimodal population brain imaging in the UK Biobank prospective epidemiological study. Nat. Neurosci. 2016;19:1523–1536.
3. UK Biobank website. https://www.ukbiobank.ac.uk/.
4. Dai W, Garcia D, de Bazelaire C, Alsop DC. Continuous flow-driven inversion for arterial spin labeling using pulsed radio frequency and gradient fields. Magn. Reson. Med. 2008;60:1488–1497.
5. Günther M, Oshio K, Feinberg DA. Single-shot 3D imaging techniques improve arterial spin labeling perfusion measurements. Magn. Reson. Med. 2005;54:491–498.
6. Alsop DC, Detre JA, Golay X, et al. Recommended implementation of Arterial Spin-Labeled perfusion MRI for clinical applications: A consensus of the ISMRM Perfusion Study group and the European consortium for ASL in dementia. Magn. Reson. Med. 2015;73:102–116.
7. Chappell MA, Groves AR, Whitcher B, Woolrich MW. Variational Bayesian Inference for a Nonlinear Forward Model. IEEE Trans. Signal Process. 2009;57:223–236.
8. Jenkinson M, Beckmann CF, Behrens TEJ, Woolrich MW, Smith SM. FSL. NeuroImage. 2012;62:782–790.
9. Griffanti L, Raman B, Alfaro-Almagro F, et al. Adapting the UK Biobank Brain Imaging Protocol and Analysis Pipeline for the C-MORE Multi-Organ Study of COVID-19 Survivors. Front. Neurol. 2021;12:753284.
10. UK Biobank ASL processing pipeline. https://git.fmrib.ox.ac.uk/falmagro/uk_biobank_pipeline_v_1.5/-/tree/master/bb_asl_pipeline.
11. Buxton RB, Frank LR, Wong EC, Siewert B, Warach S, Edelman RR. A general kinetic model for quantitative perfusion imaging with arterial spin labeling. Magn. Reson. Med. 1998;40:383–396.
12. Chappell MA, MacIntosh BJ, Donahue MJ, Günther M, Jezzard P, Woolrich MW. Separation of macrovascular signal in multi-inversion time arterial spin labelling MRI. Magn. Reson. Med. 2010;63:1357–1365.
13. Alfaro-Almagro F, McCarthy P, Afyouni S, et al. Confound modelling in UK Biobank brain imaging. NeuroImage. 2021;224:117002.
14. Oppenheimer SM, Kedem G, Martin WM. Left-insular cortex lesions perturb cardiac autonomic tone in humans. Clin. Auton. Res. 1996;6:131–140.
15. van Gelderen P, de Zwart JA, Duyn JH. Pittfalls of MRI measurement of white matter perfusion based on arterial spin labeling. Magn Reson Med. 2008;59:788–795.
16. Dolui S, Tisdall D, Vidorreta M, et al. Characterizing a perfusion-based periventricular small vessel region of interest. NeuroImage Clin. 2019;23:101897.
Figures