0379
Quantitative perfusion mapping by BOLD-DSC MRI with transient hypoxia in mouse under volatile anesthetics1Center for Neuroscience Imaging Research (CNIR), Institute for Basic Science (IBS), Suwon, 16419, Republic of Korea, Suwon, Korea, Republic of, 2Department of Biomedical Engineering, Sungkyunkwan University, Suwon, 16419, Republic of Korea, Suwon, Korea, Republic of, 3Department of Intelligent Precision Healthcare Convergence, Sungkyunkwan University, Suwon, 16419, Republic of Korea, Suwon, Korea, Republic of
Synopsis
Keywords: Hematologic, DSC & DCE Perfusion
Transient hypoxia-induced BOLD-DSC perfusion imaging approach can noninvasively map cerebral blood flow (CBF) and cerebral blood volume (CBV) in animals with injectable anesthetics. Since animal models are frequently investigated in translational research under volatile anesthetics, we developed a simple gas delivery system for inducing transient hypoxia, and performed perfusion studies of mouse under isoflurane and dexmedetomidine. Highly sensitive and reproducible perfusion metrics were found, and regional impact of anesthesia to basal perfusion metrics was assessed.
Introduction
Perfusion is critically important for delivering oxygen and metabolites and removing wastes. A BOLD-DSC MRI protocol with transient gas stimulus was successfully adopted to noninvasively measure whole-brain perfusion in mouse with high spatiotemporal resolution 1. In this BOLD-DSC approach, nitrogen gas is precisely and briefly delivered through a nose cone to obtain a reproducible arterial input function. When volatile anesthetic is used, it is difficult to maintain the same volatile anesthetic concentration during gas switching, limiting the utility of BOLD-DSC perfusion studies under commonly used isoflurane. Here, we successfully devised a gas delivery setup for delivering gas mixture under volatile isoflurane. Then, we performed perfusion mapping of mouse brain under isoflurane and dexmedetomidine/isoflurane.Methods
SetupFigure 1A shows a schematic of experimental setup for perfusion measurement under volatile anesthesia. Two separate gas lines, one for baseline inhaled gas with volatile anesthetic and the other for hypoxic stimulation, were connected to the tightly fitted mouse nose cone. A TTL-controlled switching device was used to turn off isoflurane with baseline gas mixture during very short 5s-hypoxic stimulation and turn on during non-stimulus baseline. This approach minimized a delay time between hypoxic challenge onset time and actual gas delivery time in the mouse.
Transient anoxic stimulus with 100% N2 was delivered using a block design paradigm of 60s rest and 5s stimulation alternatively repeated five times (Figure 1.B). The baseline was 40% O2 with balance N2 to ensure adequate oxygenation under anesthesia, while the hypoxic challenge was 100% N2.
Anesthetic regimes: 22 wild-type male C57BL/6 mice were used with two anesthesia protocols:
1. Isoflurane (ISO) (n=12): Initially, anesthesia was induced with 4% ISO, and reduced to 1.5% for maintenance.
2. Dexmedetomidine + Isoflurane (DEX+ISO) (n=10): DEX was initially given by an IV bolus of 0.05 mg/kg dose. Then, 0.05mg/kg/h DEX was intravenously infused 10min later and 0.3% ISO was added 30 min later 2.
BOLD MRI: BOLD MRI studies were acquired on a 9.4T MRI. GE-EPI runs (TR/TE =1000/11ms, FA=50°, 156x156x500 μm3, 20 slices) were repeated 3 times and SE-EPI runs (TR/TE =1000/22ms, FA=90/180°, 156x156x500 μm3, 20 slices) were repeated 7 times.
Perfusion analysis:
To quantify perfusion values from dynamic hypoxia-induced BOLD responses, we adopted the DSC theory 1. In each animal, perfusion values were determined on a voxel-by-voxel basis. The voxel-wise mean CBF and CBV maps were generated, and the perfusion maps were co-registered with the T2-weighted reference image. Regions of interest (ROIs) were defined by the Allen mouse brain atlas and the mean perfusion value of each ROI was calculated.
Results
Reproducibility of hypoxia-induced BOLD response: During repeated 5s-hypoxic stimulations, the BOLD responses decreased larger under ISO compared to DEX+ISO, approximately 12% and 9%, respectively (see also Fig. 1C, top for 1.5% ISO). Voxel-wise reproducibility was examined by determining correlation of voxel-wise mean peak intensities between different runs (Fig. 2 for 1.5% ISO). All voxels are highly reproducible during repeated runs.Cerebral perfusion measurement: The mean total CBV and CBF maps were generated from GE-BOLD (Fig. 3A,C; Fig. 4A,C), whereas the mean microvascular perfusion maps were generated from SE-EPI (Fig. 3B,D; Fig. 4B,D), for both ISO and DEX+ISO groups. Brain regions containing large vessels had high perfusion values in maps obtained by GE-BOLD, which were considerably reduced in maps obtained by SE-BOLD. CBV and CBF maps showed similar contrast in most brain regions for both total- and micro-vasculature.
Regional total- and micro CBV and CBF values from two anesthetic groups are displayed in Fig. 5. Isoflurane anesthesia resulted in significantly higher CBV and CBF values than dexmedetomidine anesthesia in most brain regions. Our total CBF values (whole brain and cerebral cortex area) measured under ISO anesthetic agree well with those values measured by ASL studies 3,4.
Discussion and Conclusions
We successfully built a setup for noninvasively mapping whole-brain perfusion using highly reproducible hypoxia-induced BOLD response under volatile anesthesia. We controlled and secured inhaled anesthetic depth during gas stimulation by using two separate gas lines and applying a short stimulus. With this setup, we successfully investigated the influence of commonly used anesthetics on basal perfusion. ISO has a vasodilation effect 5,6, resulting in higher basal CBV and CBF. Conversely, DEX+ISO reduced the baseline CBF due to DEX’s vasoconstriction property 7,8. Overall, our simple approach can be easily implemented for routine perfusion measurements in rodents.Acknowledgements
This research was supported by the Institute of Basic Science (IBS-R015-D1).
References
1. Lee, D., Le, T. T., Im, G. H. & Kim, S.-G. Whole-brain perfusion mapping in mice by dynamic BOLD MRI with transient hypoxia. Journal of Cerebral Blood Flow & Metabolism. 2022; 0271678X221117008.
2. You, T., Im, G.H. & Kim, SG. Characterization of brain-wide somatosensory BOLD fMRI in mice under dexmedetomidine/isoflurane and ketamine/xylazine. Sci Rep 11. 2021.
3. Munting, L. P. et al. Cerebral blood flow and cerebrovascular reactivity are preserved in a mouse model of cerebral microvascular amyloidosis. Elife 10. 2021.
4. Munting, L. P. et al. Influence of different isoflurane anesthesia protocols on murine cerebral hemodynamics measured with pseudo‐continuous arterial spin labeling. NMR in Biomedicine. 2019; 32: e4105.
5. Iida, H., Ohata, H., Iida, M., Watanabe, Y. & Dohi, S. Isoflurane and sevoflurane induce vasodilation of cerebral vessels via ATP-sensitive K+ channel activation. The Journal of the American Society of Anesthesiologists. 1998; 89: 954-960.
6. Matta, B. F., Heath, K. J., Tipping, K. & Summors, A. C. Direct cerebral vasodilatory effects of sevoflurane and isoflurane. The Journal of the American Society of Anesthesiologists. 1999; 91: 677-677.
7. Fukuda, M., Vazquez, A. L., Zong, X. & Kim, S. G. Effects of the α2‐adrenergic receptor agonist dexmedetomidine on neural, vascular and BOLD fMRI responses in the somatosensory cortex. European Journal of Neuroscience. 2013; 37: 80-95.
8. Paris, A. & Tonner, P. H. Dexmedetomidine in anaesthesia. Current Opinion in Anesthesiology. 2005; 18: 412-418.
Figures
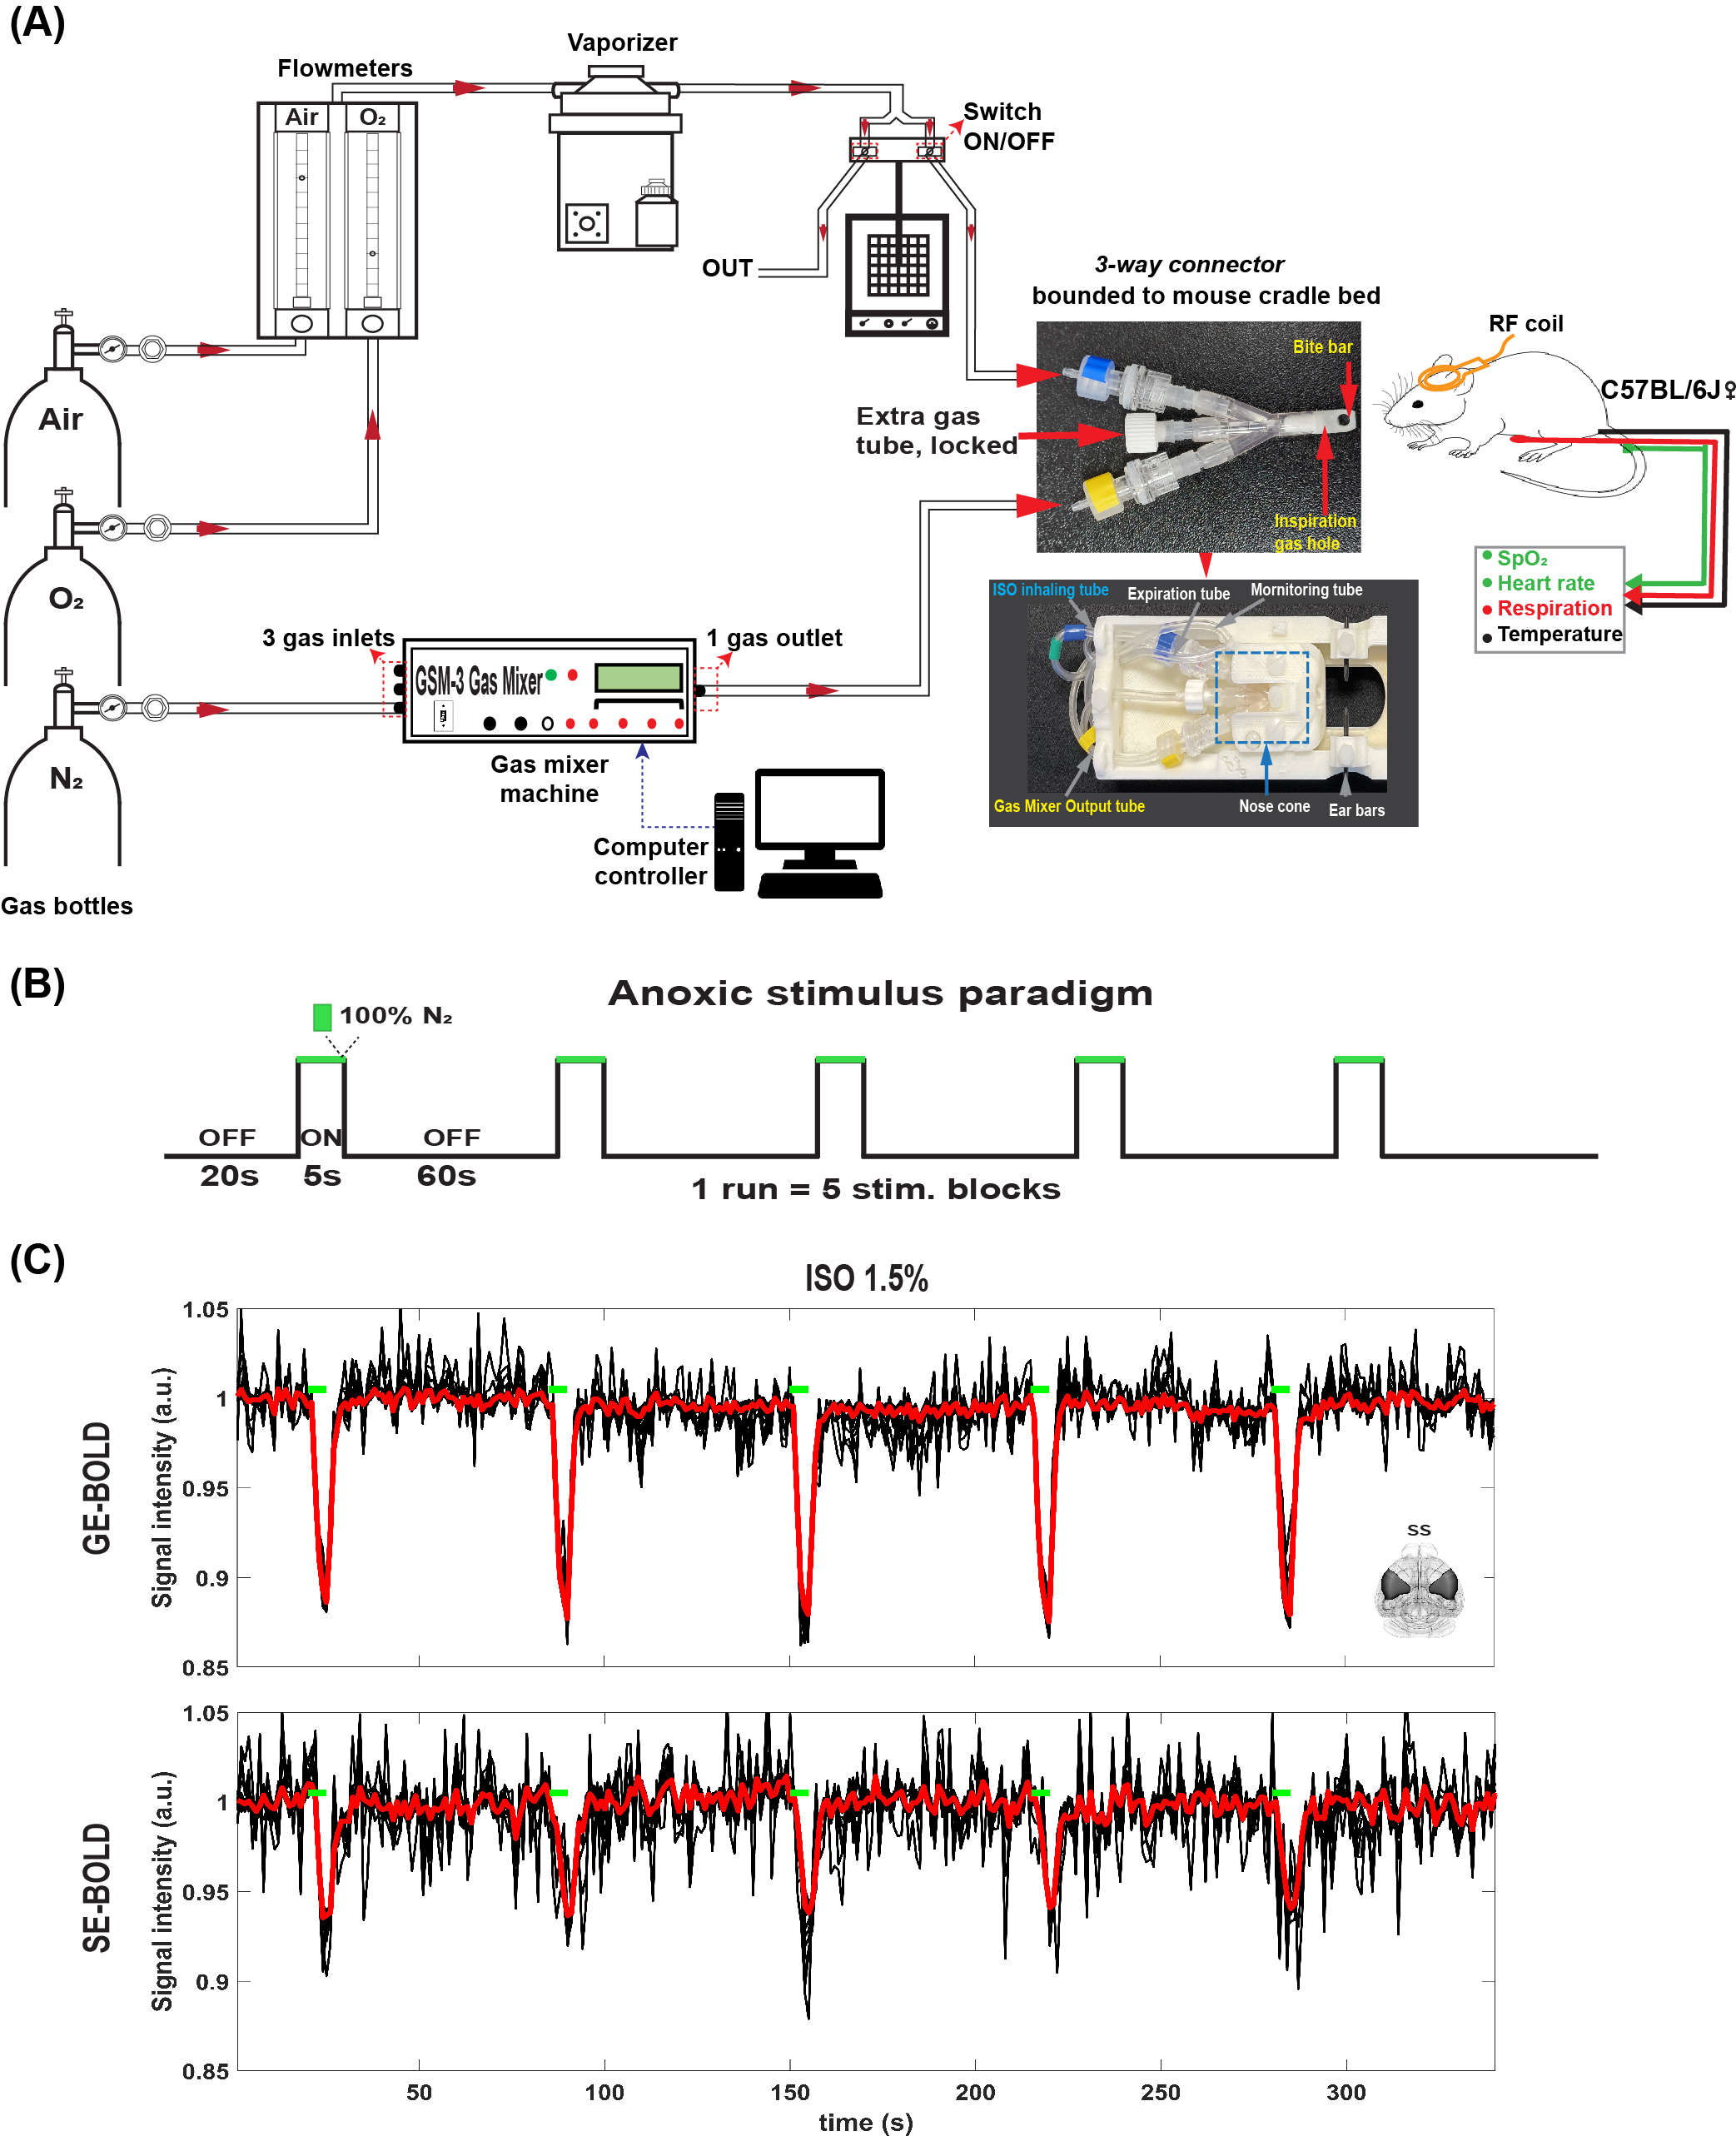
Figure 1: (A) A schematic of experimental setup for perfusion measurement under volatile ISO anesthesia. (B) Anoxic stimulus paradigm. (C) Voxel-wise time courses (mouse #1, single run) in the somatosensory area (~70 voxels) were shown. The mean time course was illustrated as the thick red line.
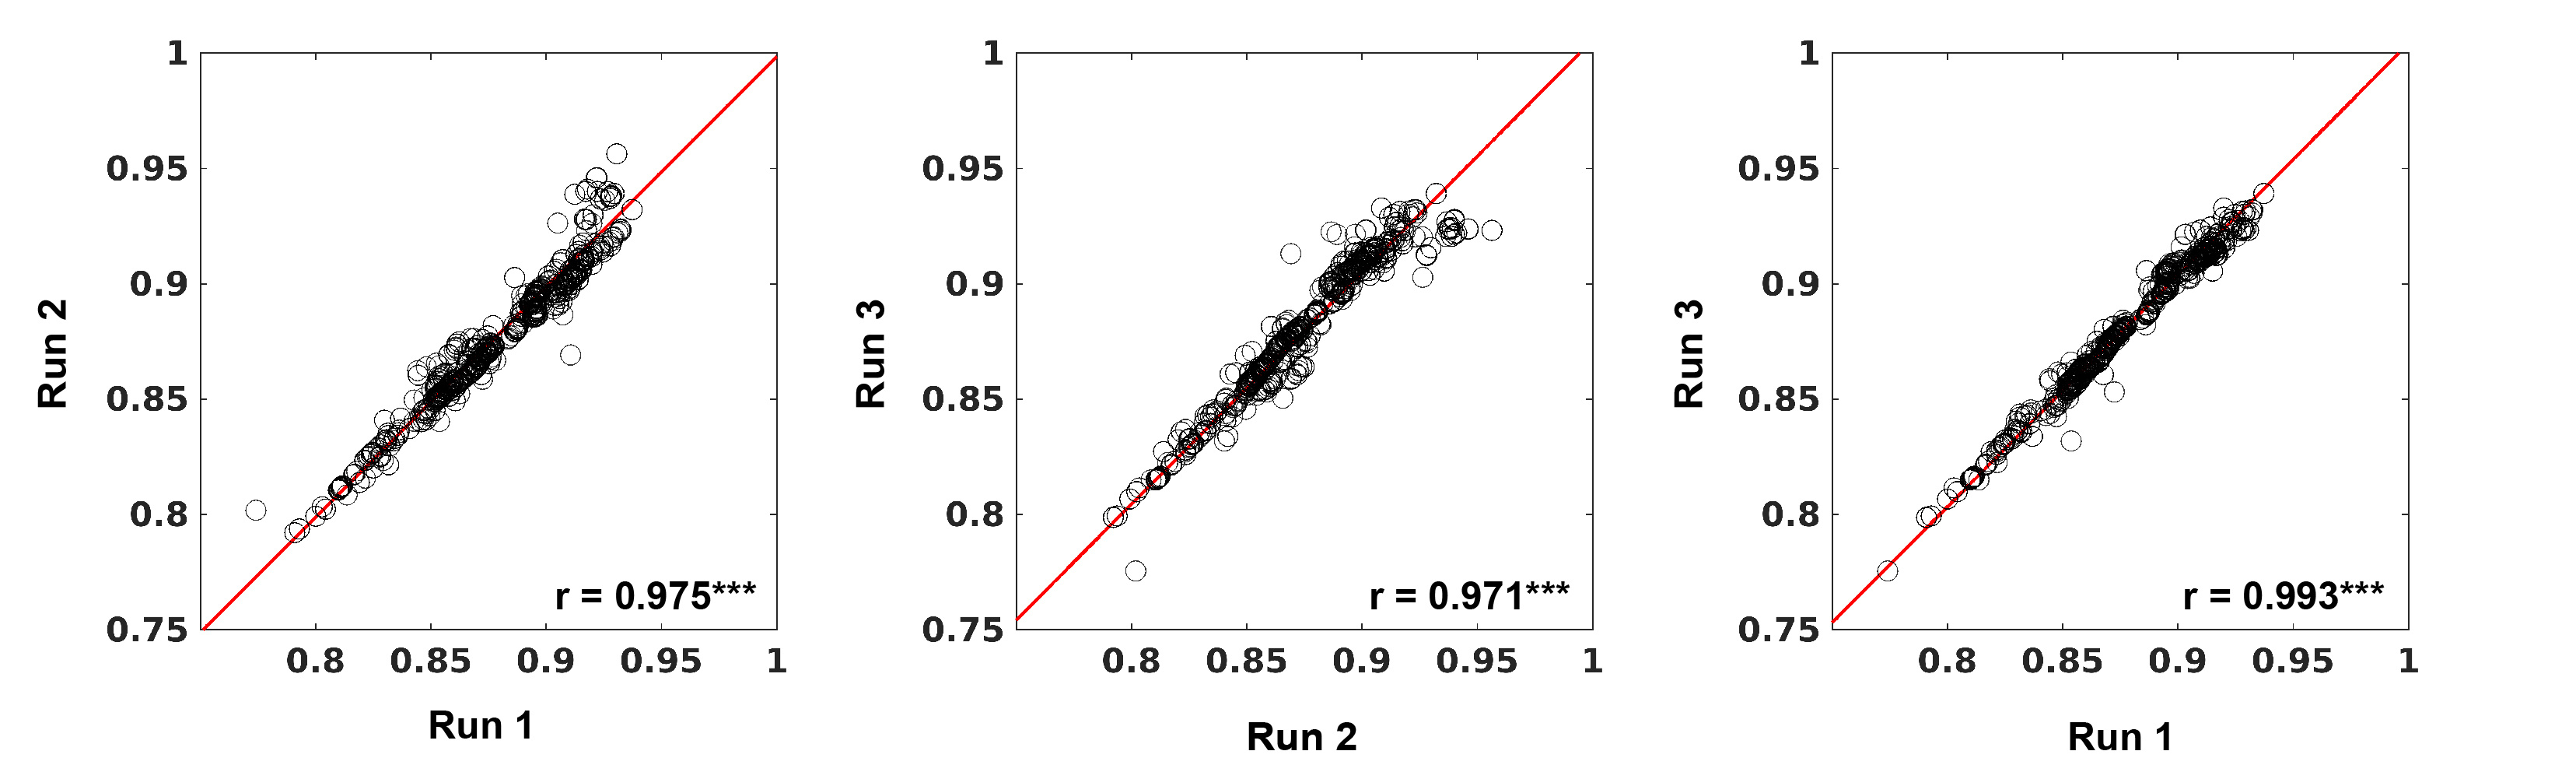
Figure 2: Scatter plot for mean peak signal intensities from 2 different runs. Each circle represents a voxel, and all brain voxels were included.
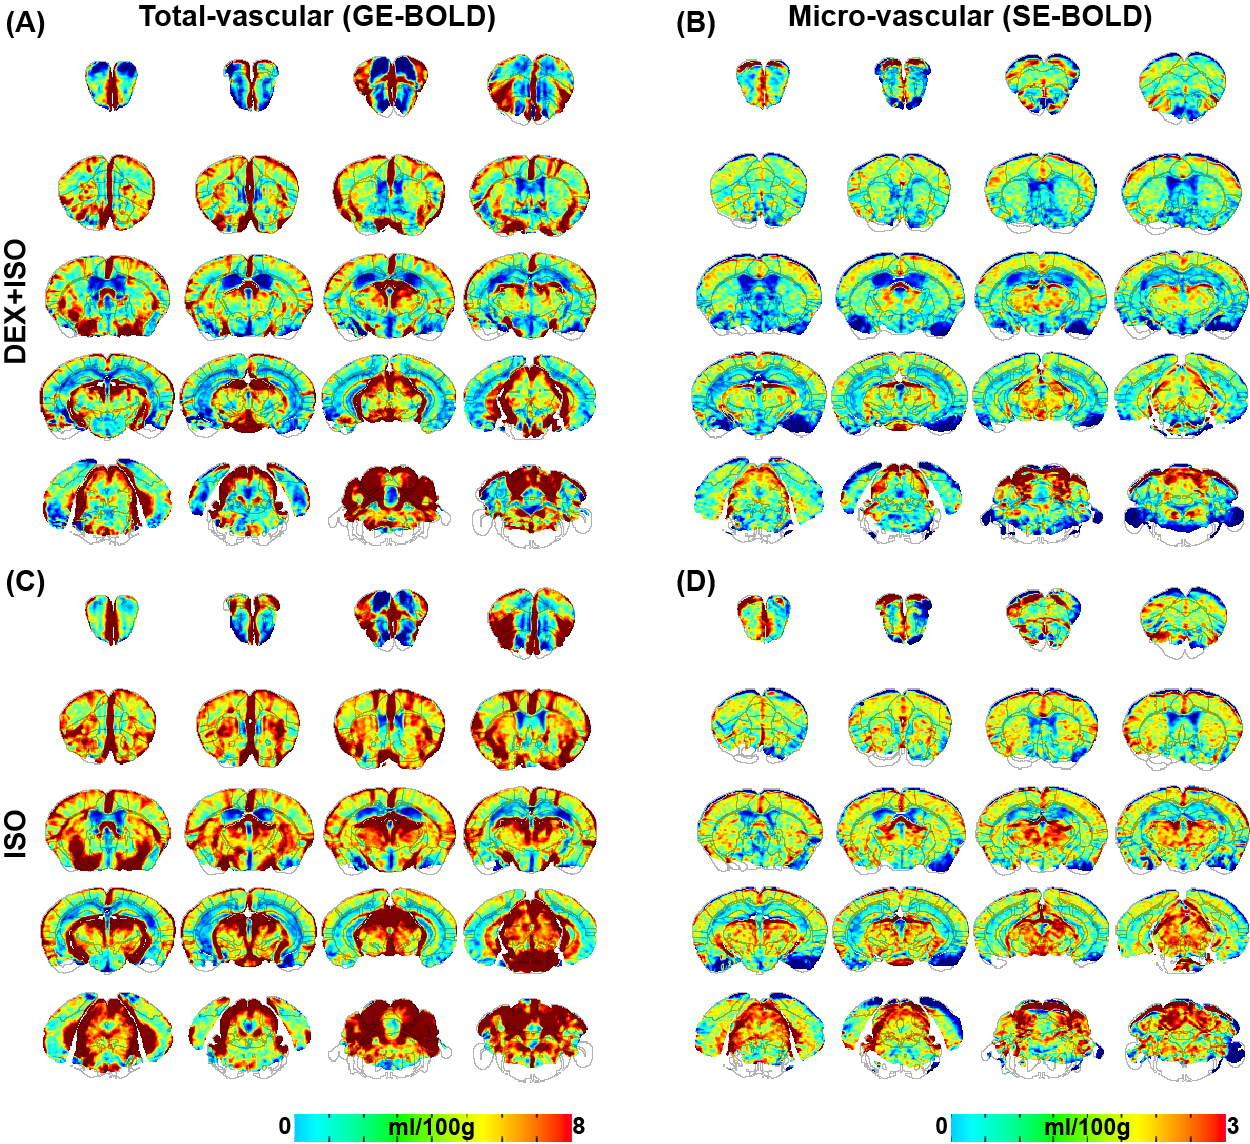
Figure 3: Group-averaged whole-brain total (A,C) and micro-vascular (B,D) CBV maps of mice anesthetized with DEX+ISO and ISO.
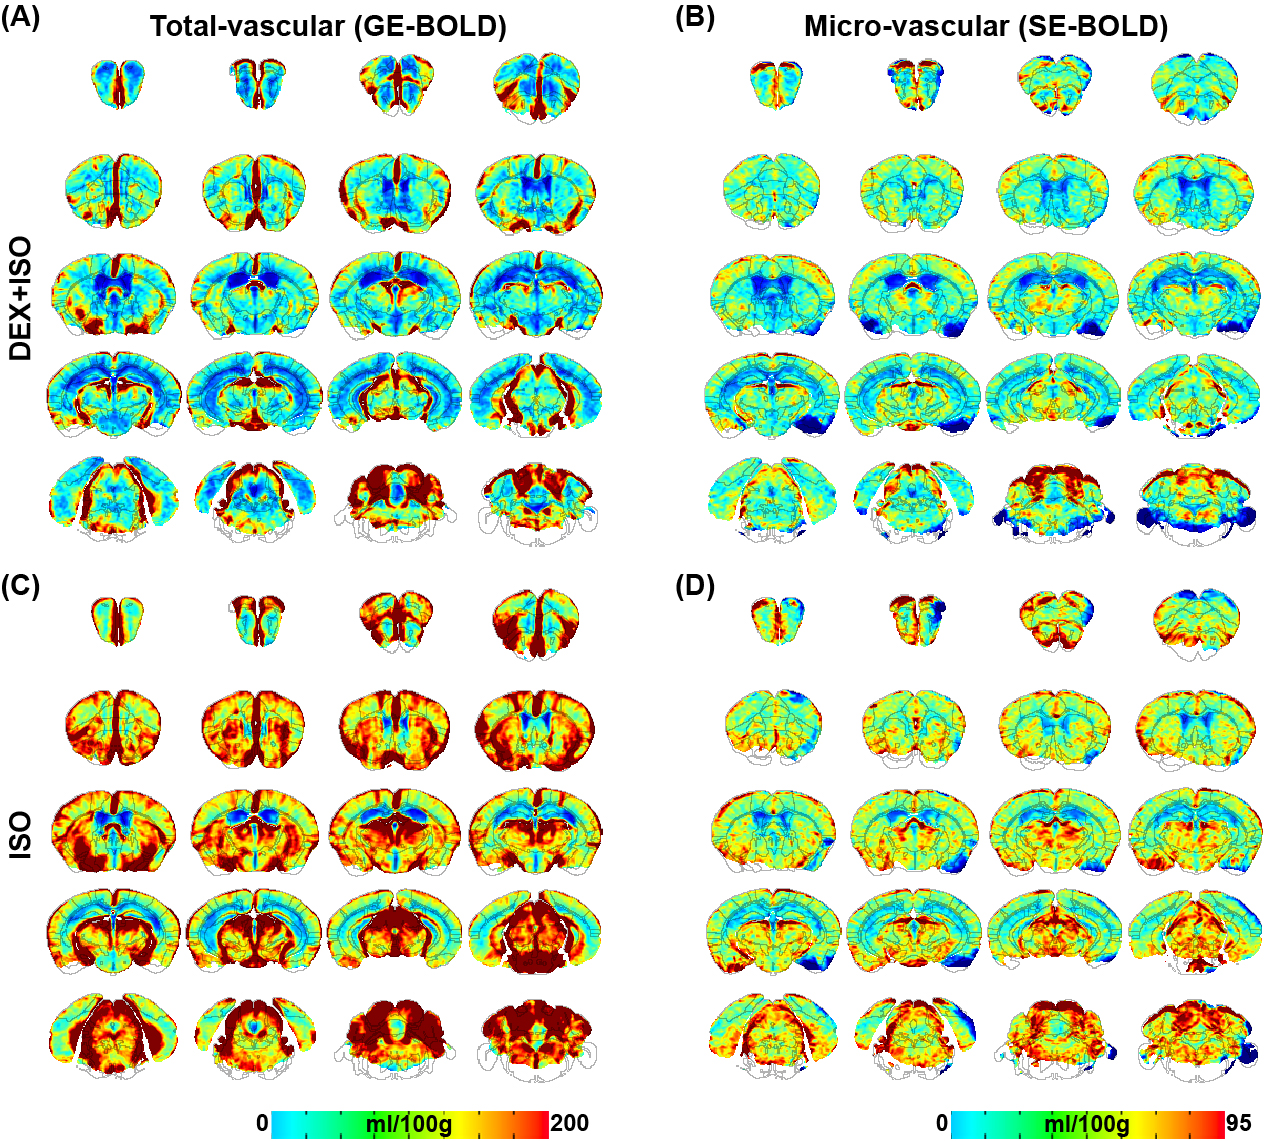
Figure 4: Group-averaged whole-brain total (A,C) and micro-vascular (B,D) CBF maps of mice anesthetized with DEX+ISO and ISO.
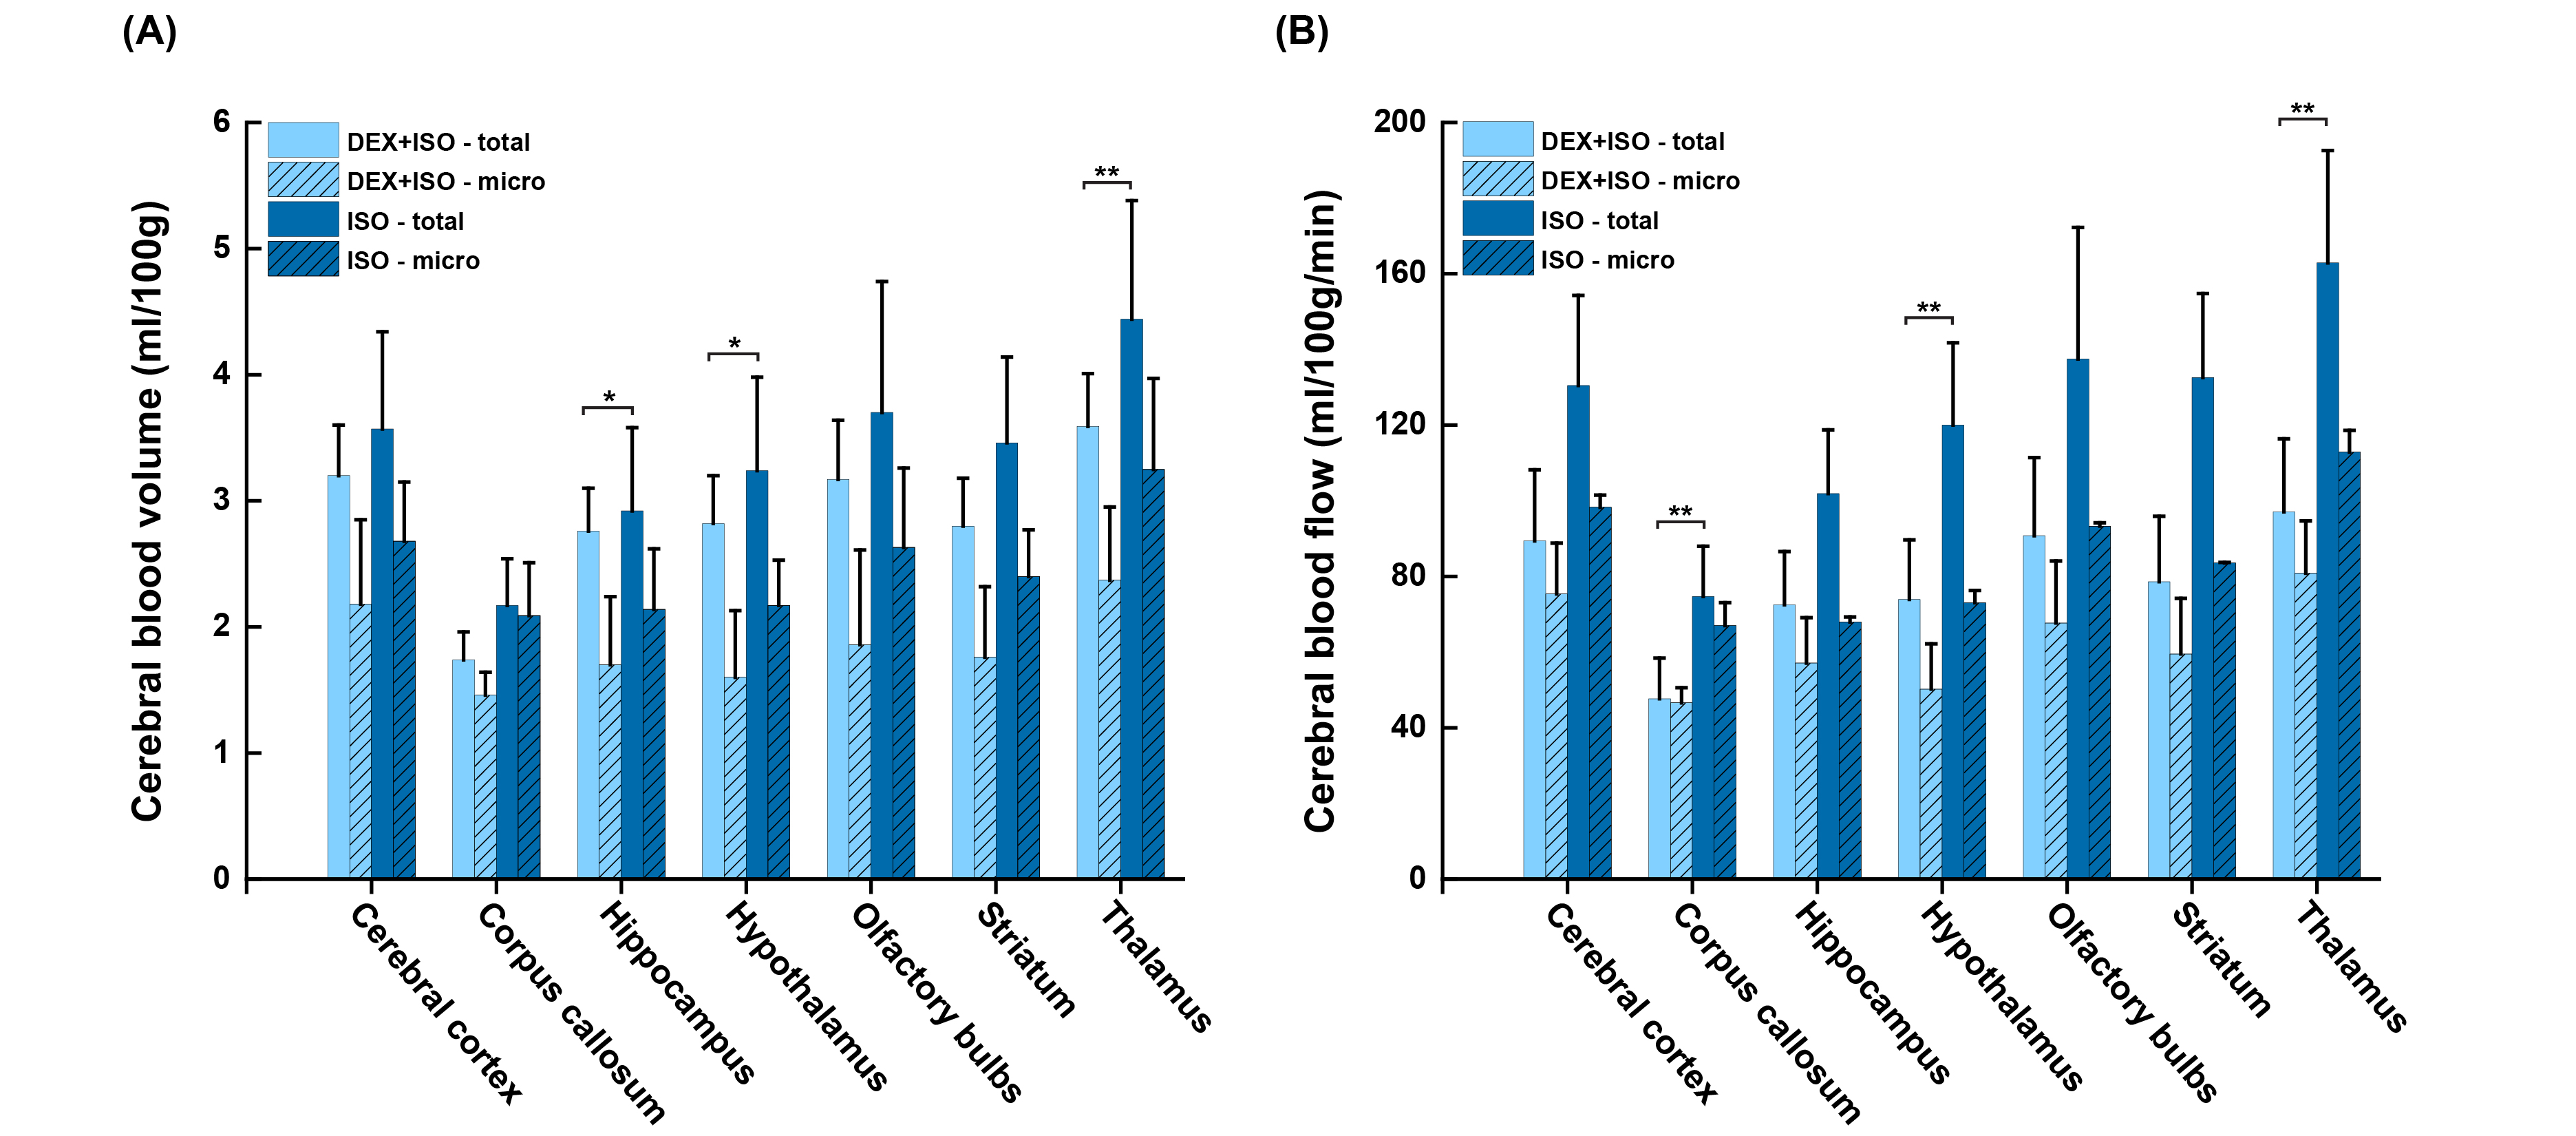
Figure 5: Quantitative regional CBV (A) and CBF (B) values in mice anesthetized with DEX+ISO and ISO in seven representative brain regions. *p<0.05, **p<0.001. Data: mean ± S.D.