0378
Investigating the applicability of dual echo ASL for simultaneous BOLD- and CBF-based mapping of cerebrovascular reactivity1Department of Diagnostic and Interventional Neuroradiology, Klinikum rechts der Isar, Technical University of Munich, Munich, Germany, 2TUM-Neuroimaging Center, Klinikum rechts der Isar, Technical University of Munich, Munich, Germany, 3Philips GmbH Market DACH, Hamburg, Germany
Synopsis
Keywords: Multi-Contrast, Validation, Cerebrovascular reactivity
Combined measurement of BOLD- and CBF-based CVR by means of deASL would be valuable for assessment of cerebrovascular diseases. To investigate the applicability of deASL for CVR mapping, we acquired GE-EPI, deASL and pCASL data from 21 healthy volunteers during a hypercapnia challenge. BOLD-CVR from deASL was slightly but significantly less sensitive to hypercapnia-induced BOLD signal changes than GE-EPI, while differences between deASL- and pCASL-based CBF-CVR were rather insignificant. However, deASL failed in 5 of 21 subjects, while pCASL and GE-EPI merely failed in two and one subjects, respectively. Thus, we expect an elevated deASL failure rate in patient populations.
Introduction
Cerebrovascular reactivity (CVR) is a highly relevant indicator of cerebrovascular status.1, 2 An elevated level of inspired CO2 (hypercapnia challenge) is frequently used as a vasoactive stimulus, causing vasodilation and thus increases in cerebral blood flow (CBF) as well as T2*-weighted MRI signals.3 Because blood oxygenation level dependent (BOLD) functional MRI is particularly robust and easy to apply, it is most frequently used for CVR mapping.3 Dual echo arterial spin labeling (deASL) allows simultaneous acquisition of BOLD- and perfusion-weighted data and is most frequently applied for calibrated fMRI.4, 5 While deASL has been applied for CVR mapping,6-8 proper validation is lacking. In particular, it has not been compared to dedicated gradient echo echo planar imaging (GE-EPI) and pseudo-continuous ASL (pCASL). Therefore, we investigated the applicability of deASL for future clinical studies by comparing deASL-based BOLD- and CBF-based CVR measures to CVR derived from dedicated GE-EPI and pCASL acquisitions.Methods
Twenty-one healthy participants (age 29.1±8.6y, 10 female) underwent MRI on a 3T Philips Ingenia Elition9 using a 32-channel head-coil. Fig.1 summarizes details of the MRI protocol (deASL, pCASL and GE-EPI) and CO2 paradigm. Medical air and hypercapnia (5% CO2) were applied using an air-CO2 mixer10 and a sealed face mask. A gas-analyzer11 facilitated end-tidal CO2 and O2 measurement. Data evaluation relied on SPM1212 and custom programs in MATLAB.13 Preprocessing comprised slice timing, motion correction and smoothing with SPM12 default parameters. For deASL and pCASL, motion correction was performed separately for label and control images. For de-ASL, this was conducted for first and second echoes separately. Pairwise subtraction of the (first) echo data was performed to generate perfusion weighted image time series and CBF was quantified.14 Pairwise averaging of second echo deASL data yielded BOLD signal time series. Maps of correlation coefficients and p-values were calculated by voxel-wise Pearson correlation of BOLD and CBF time courses with individual grey matter (GM) reference curves. For data quality assessment, relative signal changes (ΔSBOLD and ΔCBF) between the first baseline and first plateau period, temporal signal to noise ratio (SNR(t)) of the first baseline period as well as contrast to noise ratio (CNR(t)) were calculated voxel-wisely. All calculated parameter maps were evaluated in grey and white matter (WM) volumes of interest (VOIs) and compared by means of paired scatter plots and paired t-tests. Results were considered significant for p < 0.05.Results
Analysis of breathing gases revealed an end-tidal CO2 (etCO2) of 30.8±3.3mmHg and 41.3±2.7mmHg during baseline and hypercapnia, respectively. The presented evaluations (Figs.2-4) include 16 subjects. Five subjects were excluded due to insufficient data quality in two or more data sets. GE-EPI-based BOLD-CVR failed in one subject (4.8%), while CBF-CVR failed in two subjects (9.5%) for pCASL and in five subjects (23.8%) for deASL. MNI normalized group average parameter maps (Fig.2) demonstrate that BOLD signals (Fig.2a,b) showed distinctly higher correlations with the GM reference than CBF (Fig.2c), while ΔSBOLD (Fig.2d,e) was clearly lower than ΔCBF (Fig.2f). Statistical analyses (Fig.3a) revealed significantly higher correlations for GE-EPI than for deASL,TE2 in GM, while both techniques performed comparably in WM (Fig.3b). In comparison, CBF-based CVR analyses showed much lower correlation coefficients with insignificant differences between pCASL and deASL,TE1 data (Fig.3c,d). This behavior is mirrored by an evaluation of corresponding VOI-average voxel-wise p-values (Fig.3e-h). Finally, analysis of the underlying signal changes demonstrated much lower ΔSBOLD (≈0.5-3.5%; Fig.4a,b) than ΔCBF (≈10-60%; Fig.4c,d) with merely insignificant differences between GE-EPI and deASL,TE2, as well as pCASL and deASL,TE1. With respect to temporal SNR, BOLD signal outperforms CBF by far in terms of absolute values where deASL,TE2 surpasses GE-EPI (Fig.4e,f) but deASL,TE1 is inferior to pCASL (Fig.4g,h). The behavior of signal changes and SNR is finally merged in CNR, with higher values in BOLD signal (Fig.4i,j) compared to CBF (Fig.4k,l). While differences between GE-EPI and deASL,TE2 were insignificant, CNR in pCASL was significantly higher compared to deASL,TE1.Discussion
Our results demonstrate a clearly higher sensitivity (in terms of significant correlations, Fig.3) and superior CNR (Fig.4i-l) for BOLD signal compared to CBF, which agrees with literature.3, 6, 15-17 In particular, GE-EPI significantly outperformed deASL,TE2 (Figs.2a,b; Fig.3a,b,e,f). This appears somewhat surprising as deASL,TE2 data showed almost comparable signal changes and a significantly higher SNR (due to larger voxel sizes (factor 2.64) and data-averaging in the temporal dimension). However, when looking at CNR, it is evident that deASL,TE2 data show a considerably higher variance between subjects (Fig.4i,j). In addition, the frequency of complete failure was comparably high, even in our cohort of highly compliant young and healthy volunteers. In our opinion, this higher variability in CNR and elevated failure rate results from an increased susceptibility to subject motion and possible detrimental effects of background suppression on BOLD signal.6 In addition, ASL-based acquisitions suffer from additional constraints, e.g., suboptimal labeling in the presence of an unfavorable individual vascular anatomy or magnetic field inhomogeneities in the labeling plane.14Conclusion
Under ideal circumstances (i.e., no subject motion, high labeling efficiency, etc.), deASL performs comparably to dedicated GE-EPI and pCASL. However, given the rather high failure rate of deASL, we expect an elevated deASL failure rate in patient populations.Acknowledgements
We acknowledge the support by Ev. Studienwerk Villigst e.V: (personal grant to GH), the German research Foundation (DFG, grant PR 1039/6-3) and the Dr.-Ing. Leonhard-Lorenz-Stiftung (grant SK 971/19)References
1. Donahue MJ, Achten E, Cogswell PM, De Leeuw FE, Derdeyn CP, Dijkhuizen RM, Fan AP, Ghaznawi R, Heit JJ, Ikram MA, Jezzard P, Jordan LC, Jouvent E, Knutsson L, Leigh R, Liebeskind DS, Lin W, Okell TW, Qureshi AI, Stagg CJ, van Osch MJ, van Zijl PC, Watchmaker JM, Wintermark M, Wu O, Zaharchuk G, Zhou J,Hendrikse J, Consensus statement on current and emerging methods for the diagnosis and evaluation of cerebrovascular disease. J Cereb Blood Flow Metab, 2018. 38(9): p. 1391-417.2. Kaczmarz S, Gottler J, Petr J, Hansen MB, Mouridsen K, Zimmer C, Hyder F,Preibisch C, Hemodynamic impairments within individual watershed areas in asymptomatic carotid artery stenosis by multimodal MRI. J Cereb Blood Flow Metab, 2021. 41(2): p. 380-96.
3. Spano VR, Mandell DM, Poublanc J, Sam K, Battisti-Charbonney A, Pucci O, Han JS, Crawley AP, Fisher JA,Mikulis DJ, CO2 blood oxygen level-dependent MR mapping of cerebrovascular reserve in a clinical population: safety, tolerability, and technical feasibility. Radiology, 2013. 266(2): p. 592-8.
4. Storti SF, Boscolo Galazzo I, Montemezzi S, Menegaz G,Pizzini FB, Dual-echo ASL contributes to decrypting the link between functional connectivity and cerebral blow flow. Hum Brain Mapp, 2017. 38(12): p. 5831-44.
5. Woolrich MW, Chiarelli P, Gallichan D, Perthen J,Liu TT, Bayesian inference of hemodynamic changes in functional arterial spin labeling data. Magn Reson Med, 2006. 56(4): p. 891-906.
6. Ghariq E, Chappell MA, Schmid S, Teeuwisse WM,van Osch MJP, Effects of background suppression on the sensitivity of dual-echo arterial spin labeling MRI for BOLD and CBF signal changes. Neuroimage, 2014. 103: p. 316-22.
7. Hare HV, Germuska M, Kelly ME,Bulte DP, Comparison of CO2 in air versus carbogen for the measurement of cerebrovascular reactivity with magnetic resonance imaging. J Cereb Blood Flow Metab, 2013. 33(11): p. 1799-805.
8. Tancredi FB, Lajoie I,Hoge RD, Test-retest reliability of cerebral blood flow and blood oxygenation level-dependent responses to hypercapnia and hyperoxia using dual-echo pseudo-continuous arterial spin labeling and step changes in the fractional composition of inspired gases. J Magn Reson Imaging, 2015. 42(4): p. 1144-57.
9. Philips Healthcare, Best, Netherlands.
10. Altitrainer, SMTec, Switzerland.
11. ML206, AD Instruments, USA.
12. https://www.fil.ion.ucl.ac.uk/spm/software/spm12/.
13. R2020b; The Mathworks, Natick, MA, United States.
14. Alsop DC, Detre JA, Golay X, Gunther M, Hendrikse J, Hernandez-Garcia L, Lu H, MacIntosh BJ, Parkes LM, Smits M, van Osch MJ, Wang DJ, Wong EC,Zaharchuk G, Recommended implementation of arterial spin-labeled perfusion MRI for clinical applications: A consensus of the ISMRM perfusion study group and the European consortium for ASL in dementia. Magn Reson Med, 2015. 73(1): p. 102-16.
15. Ziyeh S, Rick J, Reinhard M, Hetzel A, Mader I,Speck O, Blood oxygen level-dependent MRI of cerebral CO2 reactivity in severe carotid stenosis and occlusion. Stroke, 2005. 36(4): p. 751-6.
16. Smeeing DP, Hendrikse J, Petersen ET, Donahue MJ,de Vis JB, Arterial Spin Labeling and Blood Oxygen Level-Dependent MRI Cerebrovascular Reactivity in Cerebrovascular Disease: A Systematic Review and Meta-Analysis. Cerebrovasc Dis, 2016. 42(3-4): p. 288-307.
17. van der Zande FH, Hofman PA,Backes WH, Mapping hypercapnia-induced cerebrovascular reactivity using BOLD MRI. Neuroradiology, 2005. 47(2): p. 114-20.
Figures
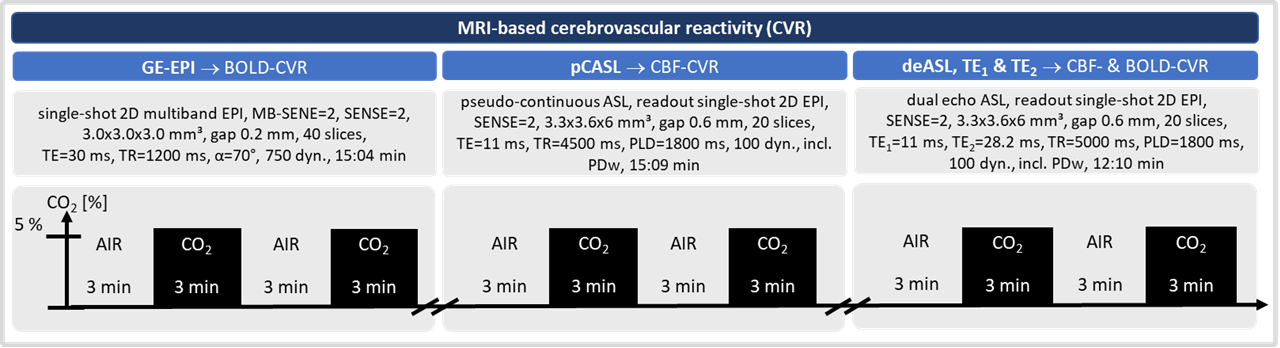
Figure 1: MRI protocol and CO2 paradigm for CVR mapping. BOLD signal was obtained by gradient echo EPI (GE-EPI) and derived from the 2nd echo of dual echo ASL (deASL,TE2). CBF time series were derived from pCASL and the 1st echo of deASL (deASL,TE1). A post label delay of 1800 ms was chosen for deASL and pCASL according to.14 Hypercapnia was applied in alternating blocks of 3 min of air and 3 min of hypercapnia (5 % CO2).
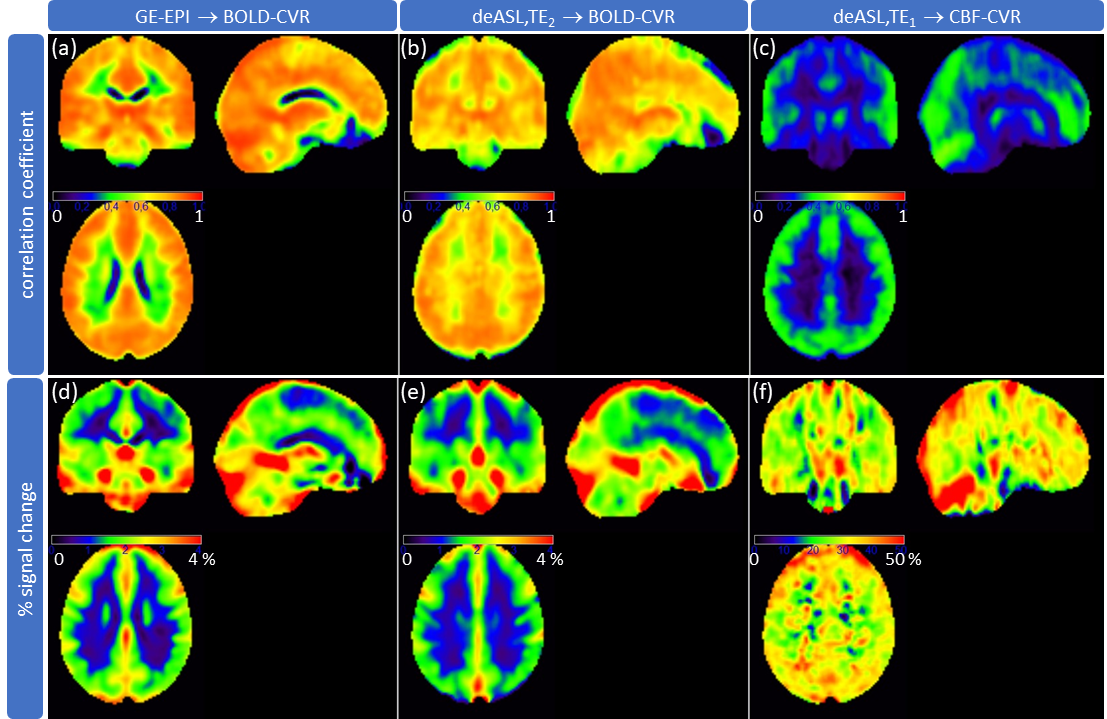
Figure 2: Group average BOLD- and CBF-CVR. Correlation coefficients (a-c; identical scaling) were obtained by voxel-wise correlation with a smoothed grey matter (GM) reference curve for BOLD signal (GE-EPI (a); deASL,TE2 (b)) and CBF (deASL,TE1 (c)) time courses. Percent signal change (d-f; adapted scale) was calculated between the first baseline and the first hypercapnia period for BOLD signal (GE-EPI (d), deASL,TE2 (e)) and CBF (deASL,TE1 (f)) time courses.
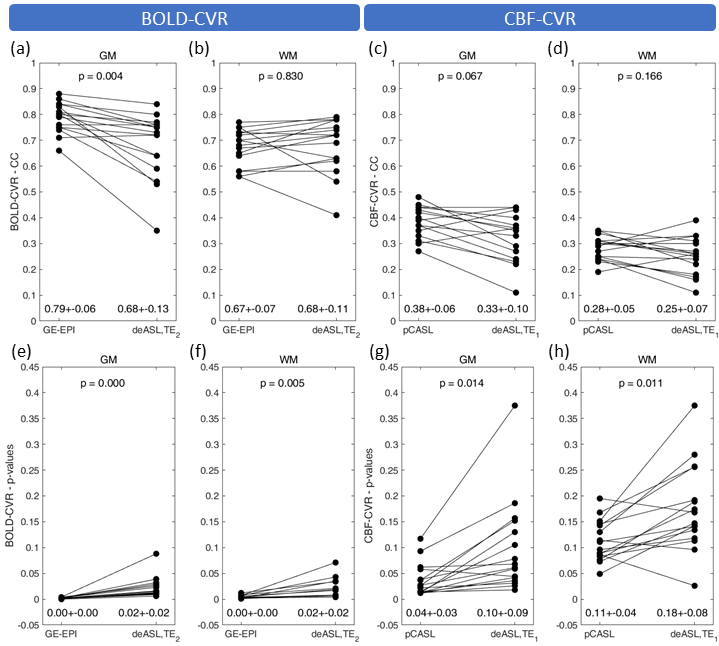
Figure 3: Paired scatterplots of BOLD- and CBF-based CVR. Grey matter (GM) and white matter (WM) averages of correlation coefficients (CC; a-d) and corresponding p-values (e-h) derived from BOLD (a,b,e,f) and CBF data (c,d,g,h) were calculated. Bullets indicate subject averages obtained with different contrasts (BOLD vs. CBF) and techniques (BOLD: GE-EPI vs. deASL,TE2; CBF: pCASL vs deASL,TE1). Group average parameter values (mean ± SD) and p-values (paired t-tests) are given in each panel at bottom and top, respectively.
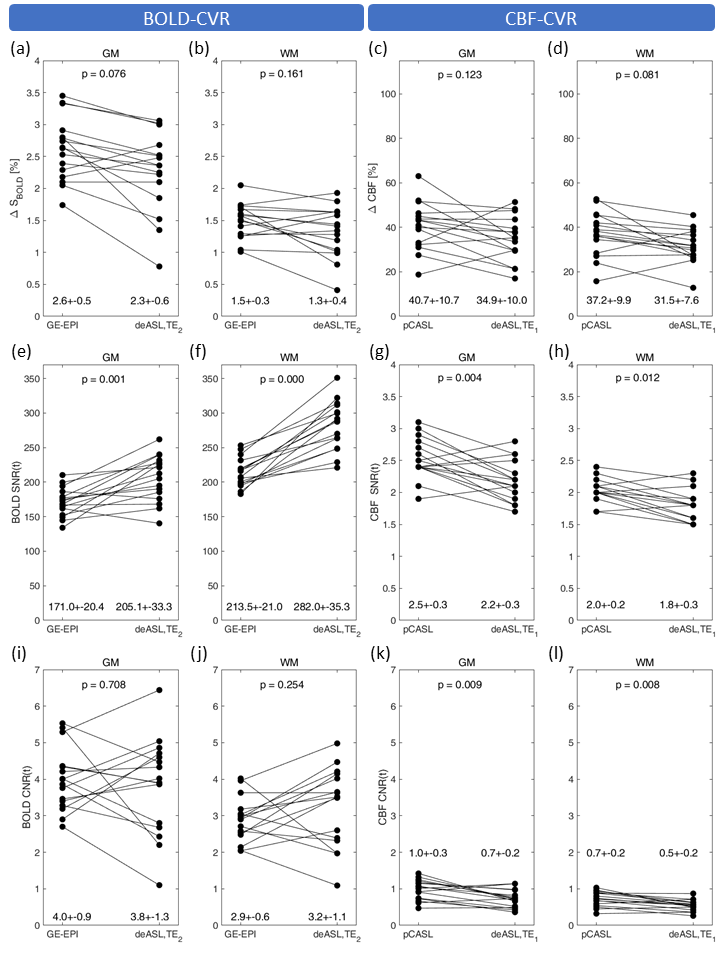
Figure 4: Paired scatterplots of quality assessment parameters. Grey matter (GM) and white matter (WM) averages of hypercapnia-induced signal changes (DSBOLD (a,b); DCBF (c,d)), temporal signal to noise ratio (SNR(t); BOLD (e,f); CBF (g,h)) and contrast to noise ratio (CNR(t); BOLD (i,j); CBF (k,l)) are shown. Bullets indicate subject wise averages obtained with different contrasts (BOLD vs. CBF) and techniques (BOLD: GE-EPI vs. deASL,TE2; CBF: pCASL vs deASL,TE1). Group average parameter values (mean ± SD) and p-values are given in each panel at bottom and top, respectively.