0377
Oxygen Extraction Fraction mapping between normal cognition and mild cognitive impairment in an elderly cohort using quantitative BOLD1Department of Biomedical Engineering, University of California, Davis, Davis, CA, United States, 2Department of Neurology, University of California, Davis, Davis, CA, United States, 3School of Medicine & Health Sciences, University of Nottingham, Nottingham, United Kingdom
Synopsis
Keywords: Oxygenation, Aging
Oxygen Extraction Fraction (OEF) is a valuable indicator of brain physiology influenced by cognitive impairment and vascular pathology in older adults. Our objective is to explore age-related OEF change for cognitively normal (CN) and Mild-Cognitive-Impairment (MCI) subjects. In this study, 56 elderly participants were recruited. Individuals with MCI resulted in higher OEF compared to CN participants, especially in the occipital lobe (p=0.007). In parietal lobe, we observed an inverse correlation between OEF and age (p=0.026) in CN and positive association between OEF and executive function (p=0.023) in MCI. The results showed an effect of aging and cognitive impairment on OEFINTRODUCTION
Oxygen extraction fraction (OEF) is an important physiological biomarker for brain hemodynamic impairment, especially for Alzheimer’s Disease (AD) and vascular cognitive impairment, and dementia (VCID)1,2. Previous studies have suggested that OEF is affected by AD and VCID1,3. OEF is decreased in AD-related impairment, while OEF is elevated with higher vascular risk patients. However, changes in OEF between cognitively normal (CN) and Mild Cognitive Impairment (MCI) with vascular risk in older adults have not been investigated. Therefore, in this study, we quantify OEF in the elderly cohort using non-invasive Asymmetric Spin Echo (ASE) MRI scans and quantitative BOLD (qBOLD) modeling. We hypothesized that OEF would be pathologically elevated for MCI compared to CN. Additionally, we also hypothesized that CN group had a stronger association with age than MCI with decreased OEF.METHODS
Participants:A total of 56 participants (75.4±7.0yrs, 37F), including 46 CN individuals (75.2±7.3yrs, 29F) and 10 MCI patients (76.0±6.1yrs, 7F), were recruited from UC Davis Alzheimer’s Disease Research Center cohort.
MRI Acquisitions:
All MRI acquisitions were acquired on a 3T scanner (Siemens Tim Trio) with a 32-channel head coil. The MR protocols included a Gradient Echo Slice Excitation Profile Imaging Asymmetric Spin Echo (GASE)4 scan and a T1-weighted MPRAGE. The imaging parameters for GASE included TR/TE, 2800/66ms; 96x96 matrix, 20 slabs; 2.3x2.3.x1.3mm3 resolution; FOV, 224mm with 13 values of the spin echo displacement time, τ, from 0 to 52ms in the step of 4ms with spin echo scan at τ=0. Each slab was constructed by averaging four 1.25mm slices to correct for macroscopic field gradient.
Image processing:
T1-weighted images were processed to create regions of interest (ROI), including gray matter (GM) and white matter (WM), using FSL FAST5. GASE data from each participant were preprocessed and quantified OEF using a two-compartment qBOLD model6 with Variational Bayesian framework7–9 that fit data for a whole range of τ. Deoxygenated blood volume (DBV) and transverse relaxation rate (R2’) were estimated directly from the model and then used to quantify OEF with known constant:
$$OEF = \frac{3\times R_2^{'}}{DBV\times \gamma \times 4 \times \pi \times \triangle \chi_{0} \times Hct \times B_{0}}$$
where γ is the proton gyromagnetic ratio, Δχ0 is the susceptibility difference between fully oxygenated and deoxygenated red blood cells (0.264ppm), Hct is the hematocrit (0.40), and B0 is the field strength. All parameter maps were then registered to Montreal Neurological Institute (MNI) template space to create group-level average maps.
Statistical analysis:
Average OEF values were calculated for each ROI (GM, WM, frontal, parietal, occipital, and temporal lobes) and were compared between CN and MCI groups in each region using pairwise t-tests with Bonferroni correction. The correlations between OEF and age, and OEF and executive scores from the Spanish and English Neuropsychological Assessment Scales (SENAS)10 for each ROI were assessed using a linear mixed effects model in MATLAB that accounted for subject clustering.
RESULTS
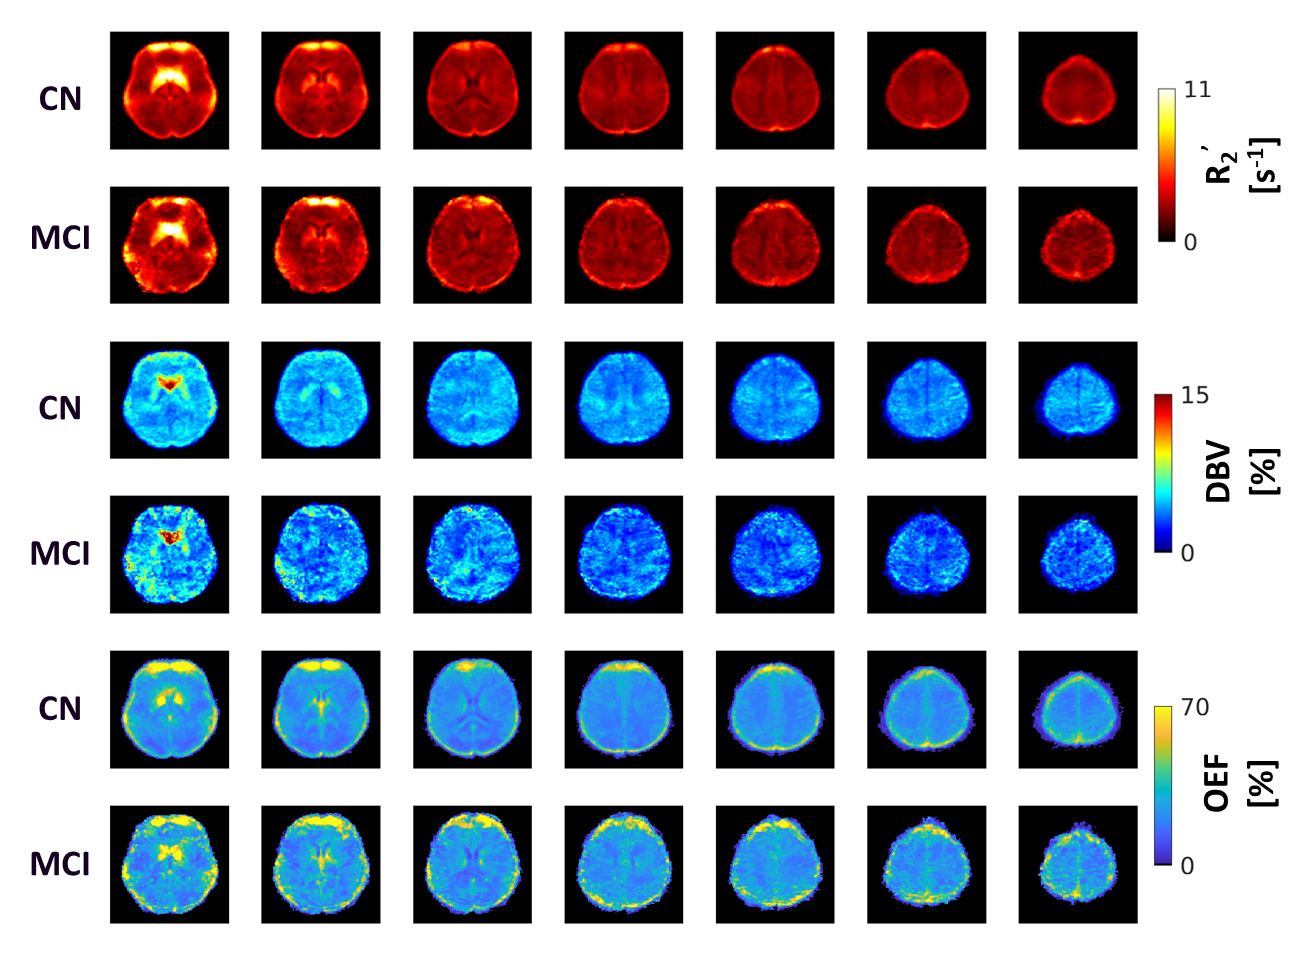
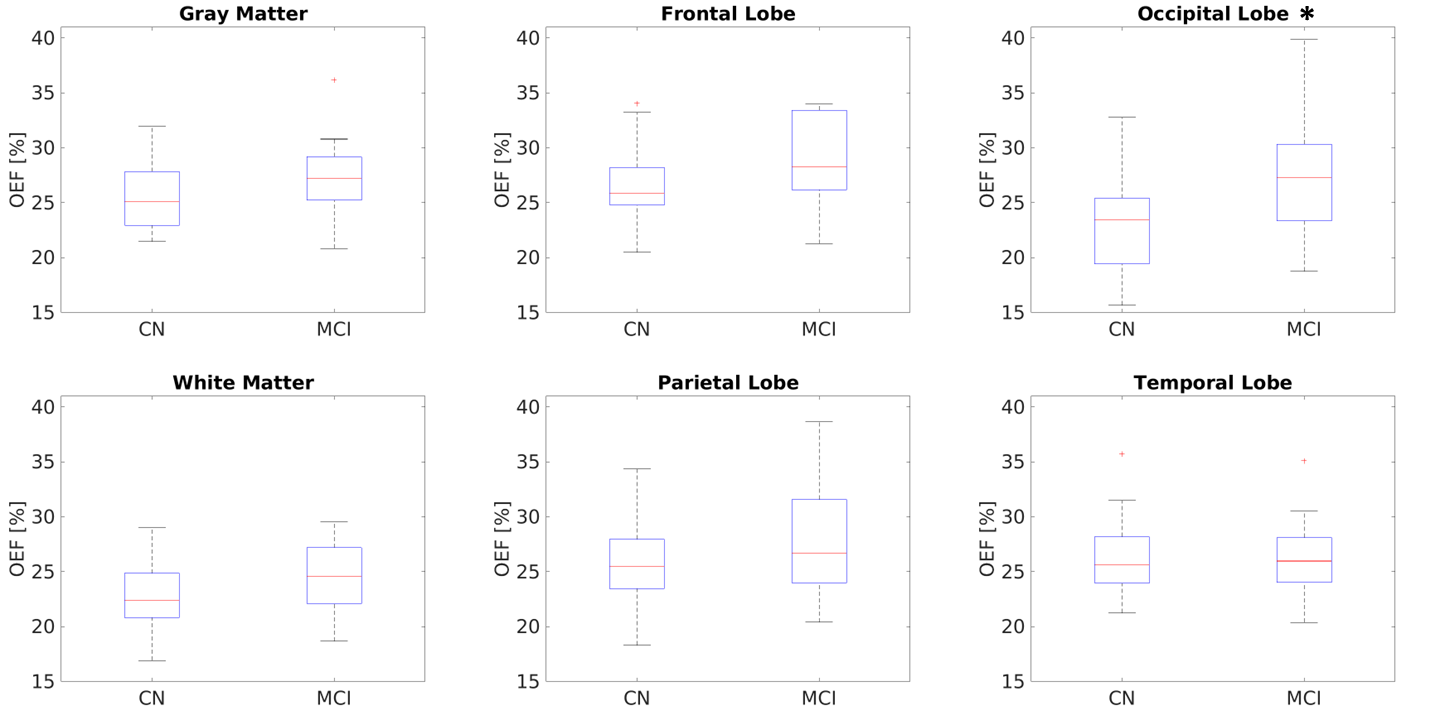
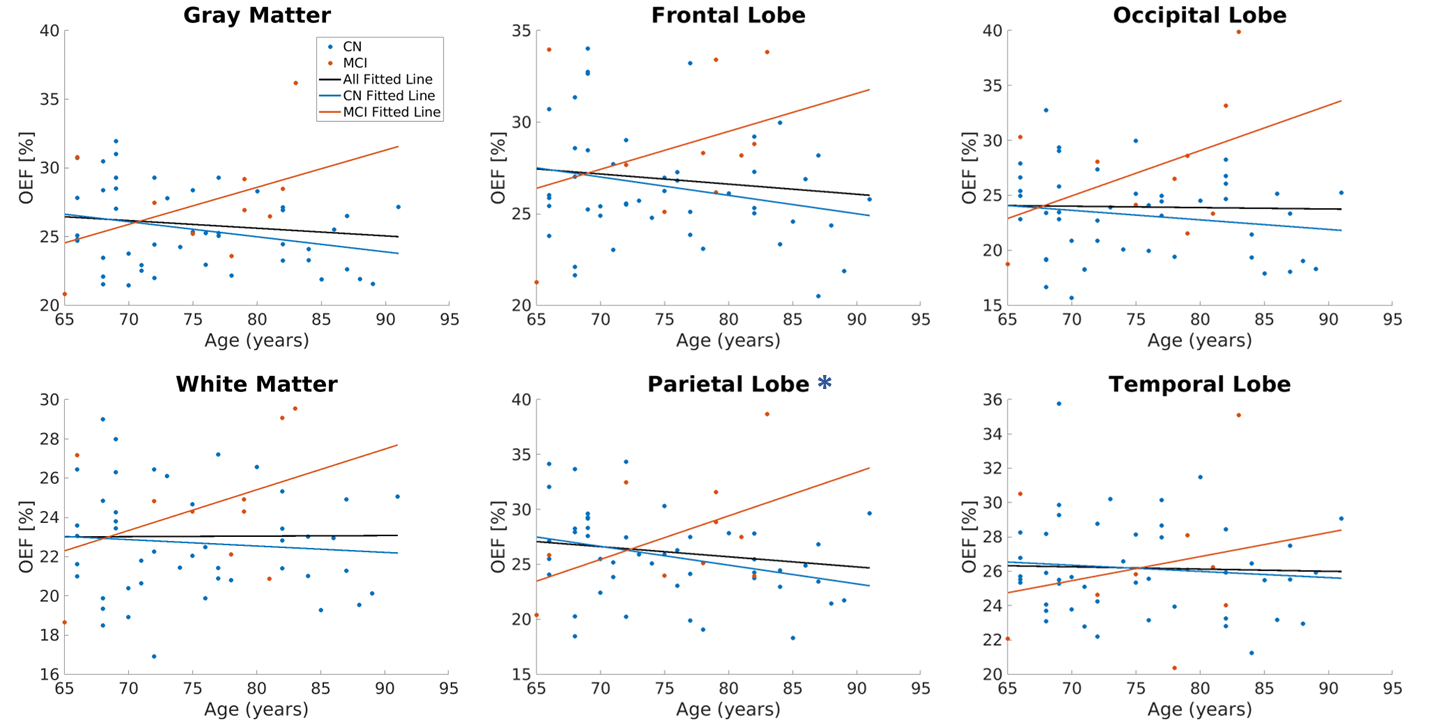
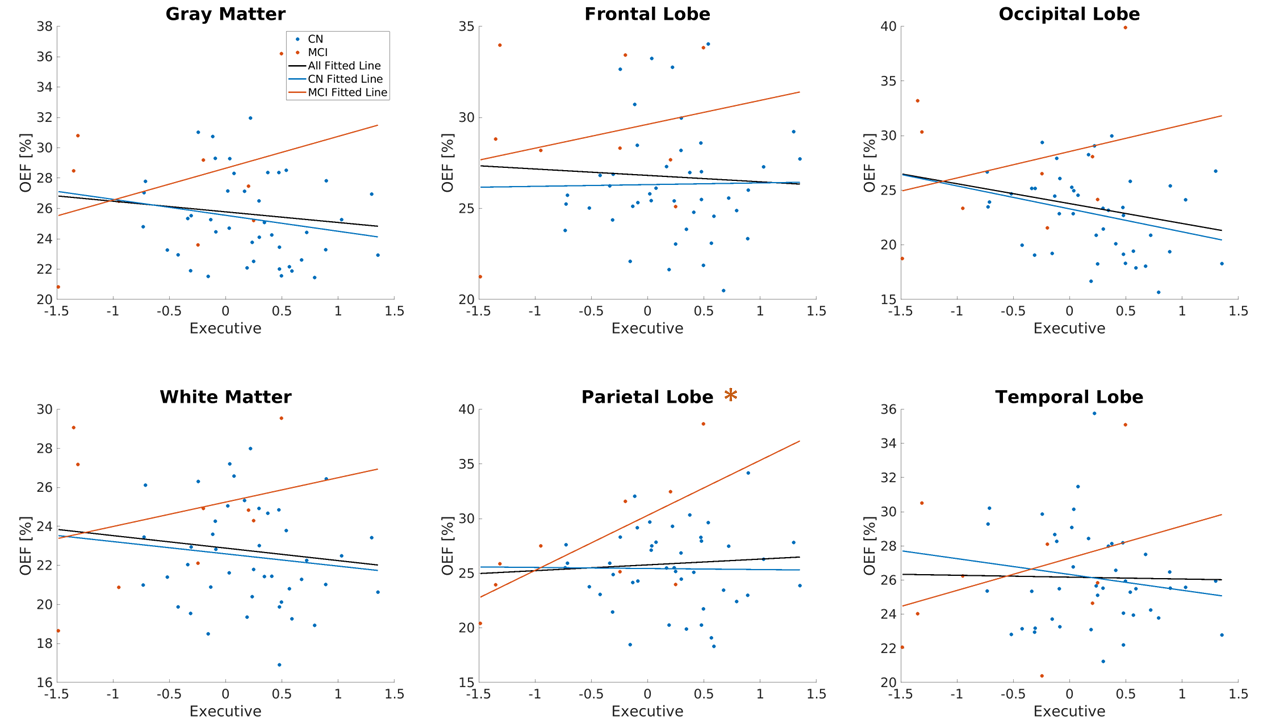
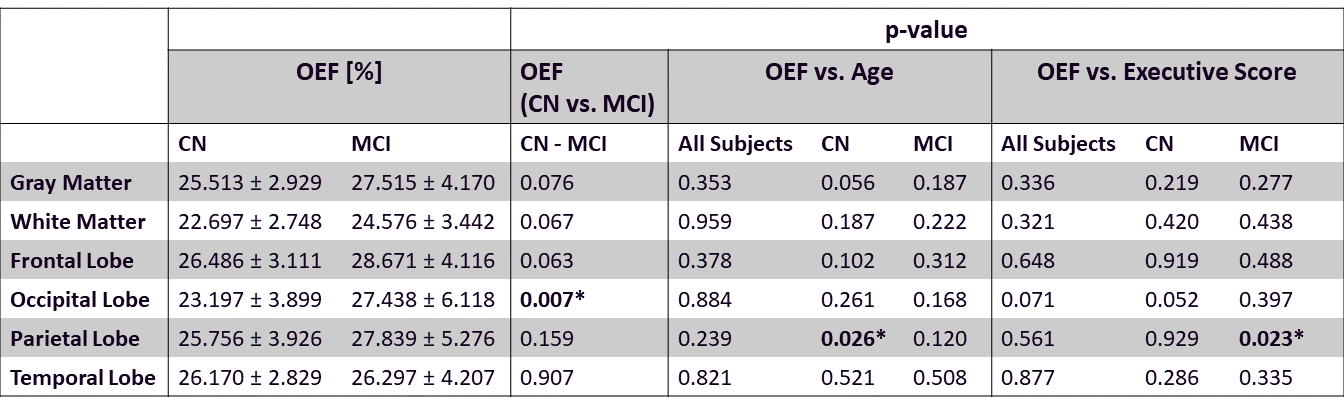
Compared to CN, reduced DBV and increased OEF were observed on the group average level (Figure 1). The changes in OEF between CN and MCI groups for each region were plotted in Figure 2 and Table 1. We observed increased OEF in MCI groups compared to CN in all regions, especially significant in the occipital lobe (p=0.007). The correlations between OEF and age in selected regions were plotted in Figure 3, indicating that OEF was inversely correlated with age in the parietal lobe for CN group (p=0.026). In contrast, there was a positive trend between OEF and age for MCI subjects across all regions. With the mixed linear effect model, the correlation between OEF and the executive score (Figure 4) indicates that OEF was inversely correlated with the executive score in occipital lobe for CN group (p=0.052); however, there is an opposite trend in parietal lobe for MCI group (p=0.023).DISCUSSION
Negative correlations between age and OEF in the CN older adults (Figure 3) are consistent with the results from previous PET and MRI studies3,11. The lack of a significant association of age with OEF in the MCI group may suggest that age effects are surpassed by disease-related effects on brain oxygen metabolism from amyloid-beta (Aβ)-induced neuronal toxicity in mitochondrial dysfunction12. However, our study has a limited number of MCI patients. Higher OEF in MCI than CN may reflect a compensatory increase in brain metabolism reported on PET in MCI with decreased blood flow13–15, increased white matter hyperintensities, or vascular injury. Additionally, the positive correlation between OEF and executive score in MCI (Figure 4) may indicate brain dysfunction associated with lower executive function. In future analysis, white matter hyperintensities and vascular risk factors should be considered as separate pathologies.CONCLUSION
In conclusion, this study showed an increase in OEF for patients with MCI, and older age was associated with decreased OEF in CN individuals. Higher brain OEF in MCI individuals may reflect changes in oxygen metabolism because of underlying pathology, including vascular injury. Both age and executive function have associations with brain oxygen extraction that are differently affected by normal aging and MCI.Acknowledgements
This study was supported by NIH R00-NS102884 and UC Davis Alzheimer’s Disease Research Center.References
1. Jiang, D. et al. Brain Oxygen Extraction Is Differentially Altered by Alzheimer’s and Vascular Diseases. J. Magn. Reson. Imaging JMRI 52, 1829–1837 (2020).
2. Lin, Z. et al. Longitudinal changes in brain oxygen extraction fraction (OEF) in older adults: Relationship to markers of vascular and Alzheimer’s pathology. Alzheimers Dement. n/a,.
3. Chiang, G. C. et al. Brain oxygen extraction and neural tissue susceptibility are associated with cognitive impairment in older individuals. J. Neuroimaging 32, 697–709 (2022).
4. Blockley, N. P. & Stone, A. J. Improving the specificity of R2’ to the deoxyhaemoglobin content of brain tissue: Prospective correction of macroscopic magnetic field gradients. NeuroImage 135, 253–260 (2016).
5. Zhang, Y., Brady, M. & Smith, S. Segmentation of brain MR images through a hidden Markov random field model and the expectation-maximization algorithm. IEEE Trans. Med. Imaging 20, 45–57 (2001).
6. He, X. & Yablonskiy, D. A. Quantitative BOLD: Mapping of human cerebral deoxygenated blood volume and oxygen extraction fraction: Default state. Magn. Reson. Med. 57, 115–126 (2007).
7. Cherukara, M. T., Stone, A. J., Chappell, M. A. & Blockley, N. P. Model-based Bayesian inference of brain oxygenation using quantitative BOLD. NeuroImage 202, 116106 (2019).
8. Chappell, M. A., Groves, A. R., Whitcher, B. & Woolrich, M. W. Variational Bayesian Inference for a Nonlinear Forward Model. IEEE Trans. Signal Process. 57, 223–236 (2009).
9. Groves, A. R., Chappell, M. A. & Woolrich, M. W. Combined spatial and non-spatial prior for inference on MRI time-series. NeuroImage 45, 795–809 (2009).
10. Woolrich, M. W. & Behrens, T. E. Variational Bayes inference of spatial mixture models for segmentation. IEEE Trans. Med. Imaging 25, 1380–1391 (2006).
11. Yamaguchi, T. et al. Reduction in regional cerebral metabolic rate of oxygen during human aging. Stroke 17, 1220–1228 (1986).
12. Pagani, L. & Eckert, A. Amyloid-Beta interaction with mitochondria. Int. J. Alzheimers Dis. 2011, 925050 (2011).
13. Rubinski, A., Franzmeier, N., Neitzel, J., Ewers, M., & Alzheimer’s Disease Neuroimaging Initiative (ADNI). FDG-PET hypermetabolism is associated with higher tau-PET in mild cognitive impairment at low amyloid-PET levels. Alzheimers Res. Ther. 12, 133 (2020).
14. Madsen, L. S. et al. Capillary function progressively deteriorates in prodromal Alzheimer’s disease: A longitudinal MRI perfusion study. Aging Brain 2, 100035 (2022).
15. Peng, S.-L. et al. Age-related increase of resting metabolic rate in the human brain. NeuroImage 98, 176–183 (2014).
Figures