0376
Analytical model for determination of exchange times in multi-TE velocity-selective Arterial Spin Labeling1Fraunhofer MEVIS, Bremen, Germany, 2University Bremen, Bremen, Germany, 3mediri GmbH, Heidelberg, Germany
Synopsis
Keywords: Arterial spin labelling, Arterial spin labelling, velocity-selective Arterial Spin Labeling, multi-TE
In this work, for the first time, an analytical model for determining the exchange times for obtaining vascular permeability information in velocity-selective Arterial Spin Labeling (VSASL) with multiple echo times (TE) is presented. Signal intensity comparisons were performed between different multi-TE VSASL techniques with each of the standard multi-TE pCASL and multi-TE PASL techniques for different sampling times. This demonstrates that, particularly for longer arterial transit times, the VSASL signal is twice as high compared with standard multi-TE measurements and thus shows promise in the field of non-invasive permeability measurements.Introduction
Velocity-selective (VS) Arterial Spin Labeling (ASL) is a technique for measuring perfusion by labeling blood water of supplying artery of the organ of interest within the imaging region1,2. Because of the insensitivity of arterial transit times (ATT) of labeled blood, VSASL is getting increasingly more interest, especially in organs with slow blood velocity.In addition, multiple echo (multi-TE) measurements offer the possibility to distinguish between different tissue types and determine exchange dynamics between them and with thus obtain information about the vascular permeability and exchange time quantified by Texch.
This abstract presents an analytical model to determine Texch times using the combination of VSASL and multi-TE measurements. Furthermore, signal comparisons were made between multi-TE VSASL measurements and multi-TE pseudocontinuous ASL (pCASL) and pulsed ASL (PASL) measurements.
Methods
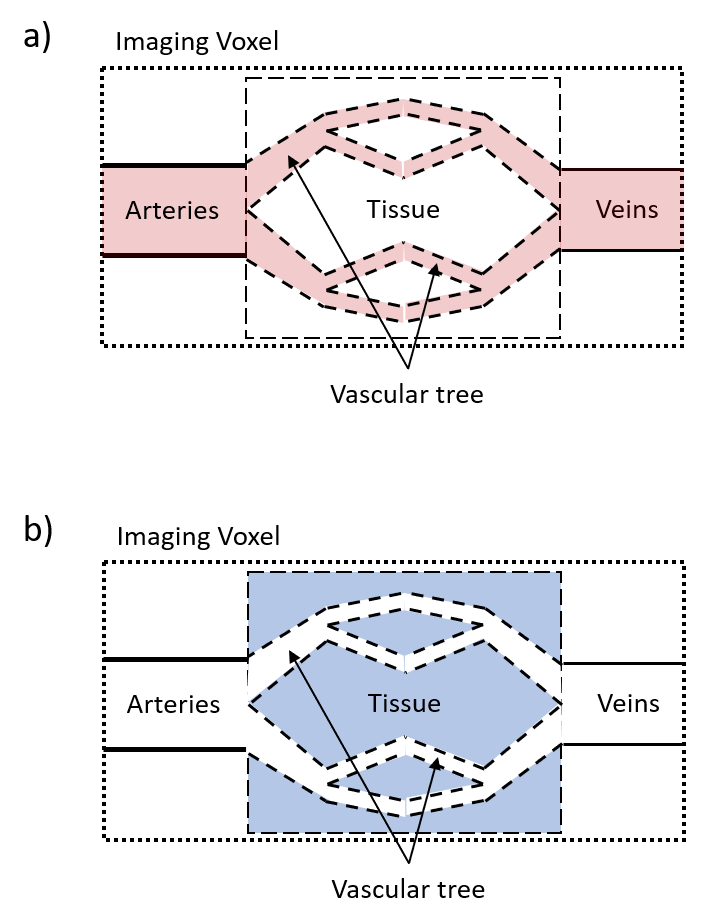
TheoryThe model is based on a two-compartment model3 which uses an exchange term with an exchange time that reflects the transfer of labeled blood into the tissue. In that model, the measured signal can be subdivided into blood and tissue and was recently extended by an intravoxel transit time (ITT) as additional compartment to account for delayed exchanges within a voxel4,5. VSASL allows selective labeling for flow velocities above a so-called cut-off velocity vc (figure 1a) and in combination with vascular crushers applied after an inflow time TI only decelerated labeled blood which enters the tissue contributes to the measuring signal (figure 1b).
The signal which depends on the measurement parameters TI and TE is calculated by
$$S_{VSASL}(TI,TE)=f\alpha_{VS}M_0\left(\int_0^{TI}e^{-\frac{t}{T1_b}}e^{-\frac{TI-t}{T1_{ex}}}\cdot (1-e^{-\frac{TI-t}{T_{exch}}})dt\right)\left(1-e^{-\frac{t_{sat}}{T1_{bl}}}\right)e^{-\frac{TE}{T2_{ex}}}$$
including the arterial input function of the VSASL bolus, the exchange function as well as the T1- and T2 magnetization relaxation function of blood and tissue. In addition, the signal depends on the saturation time tsat which is the time between the regional saturation and the VSASL module. f is the perfusion, $$$\alpha_{VS}$$$ the labeling efficiency of the selected VSASL technique ($$$\alpha_{VS}$$$=2 for inversion, 1 for saturation), M0 the equilibrium magnetization of blood. T1bl, T1ex are the T1-relaxation times of blood and tissue, T2ex the T2-relaxation time of tissue respectively.
Simulation
3D-data were simulated for ranges of TI=[0, 5000]ms and TE=(0, 19, 57, 95, 133, 171, 209, 247, 285, 323)ms with Texch=228ms using the equation above with: M0=1; f = 60 ml/100g/min; $$$\alpha_{VS}$$$=1 or 2 (for saturation or inversion), T1bl=1584ms; T1ex=1331ms; T2ex=80ms, tsat=2000ms. Additionally, a signal intensity comparison between pCASL and PASL with the VSASL technique was done. For this, the signals of all techniques were calculated for different TI, ATT (ITT=300ms) and TE values. The quotient Signal_VSASL/Signal_PASL and Signal_VSASL/Signal_pCASL were determined for VS-inversion (inv-VSASL) and VS-saturation (sat-VSASL) for comparison at different sampling times. The PASL and pCASL signals were calculated using the extended model4 with bolus duration BD_pCASL=1800ms and BD_PASL=800ms.
Results
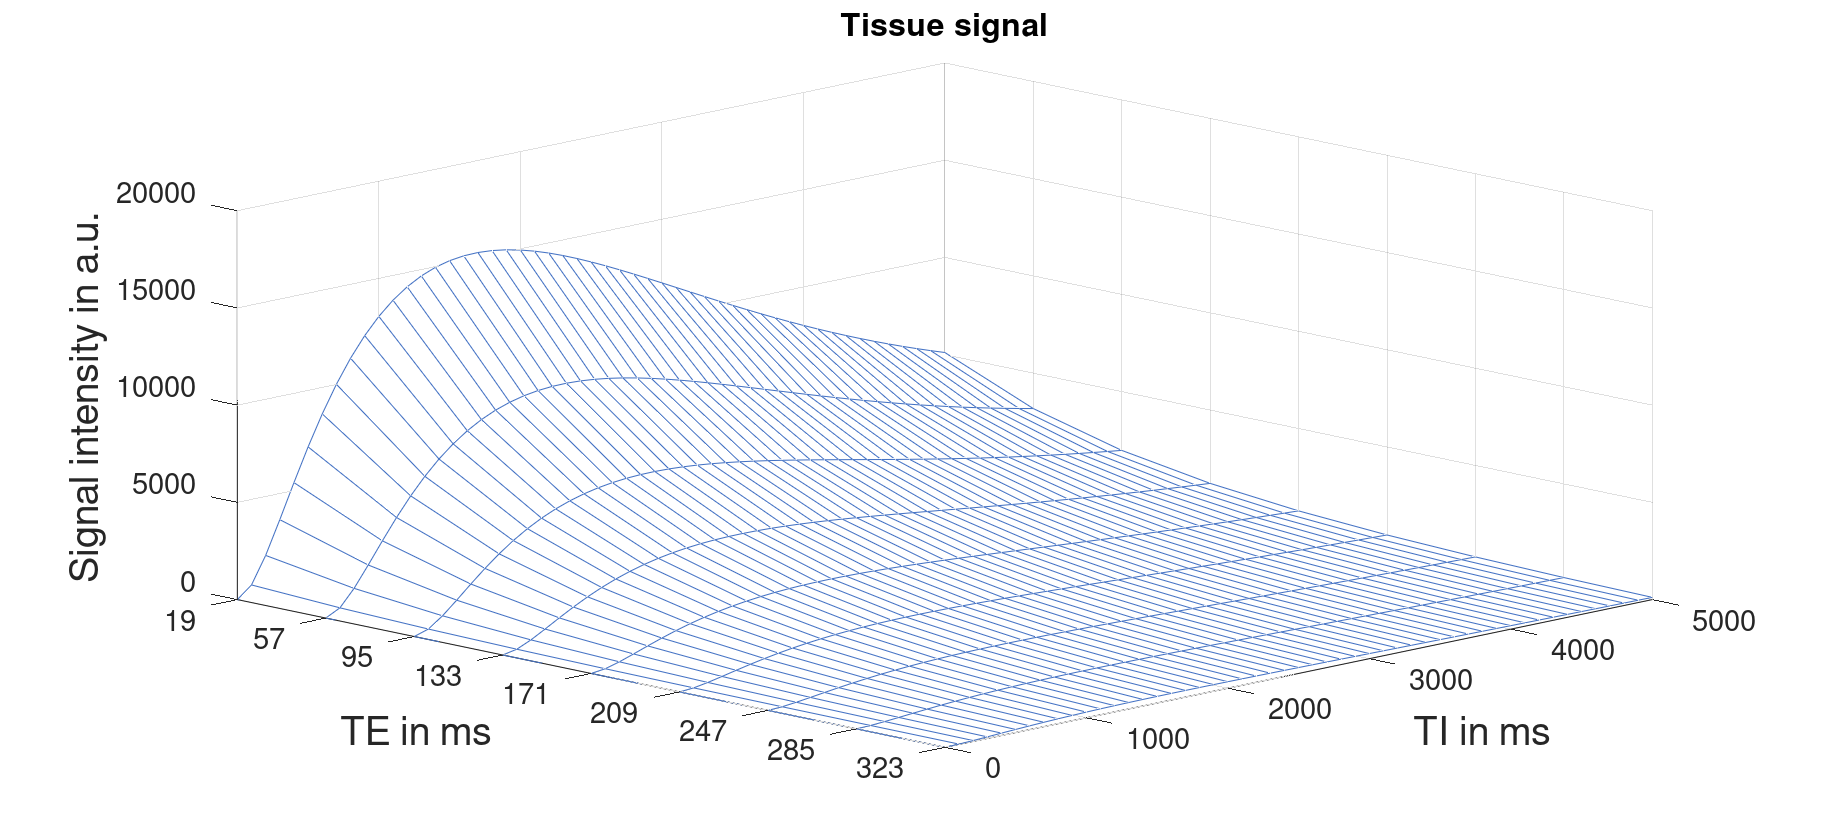
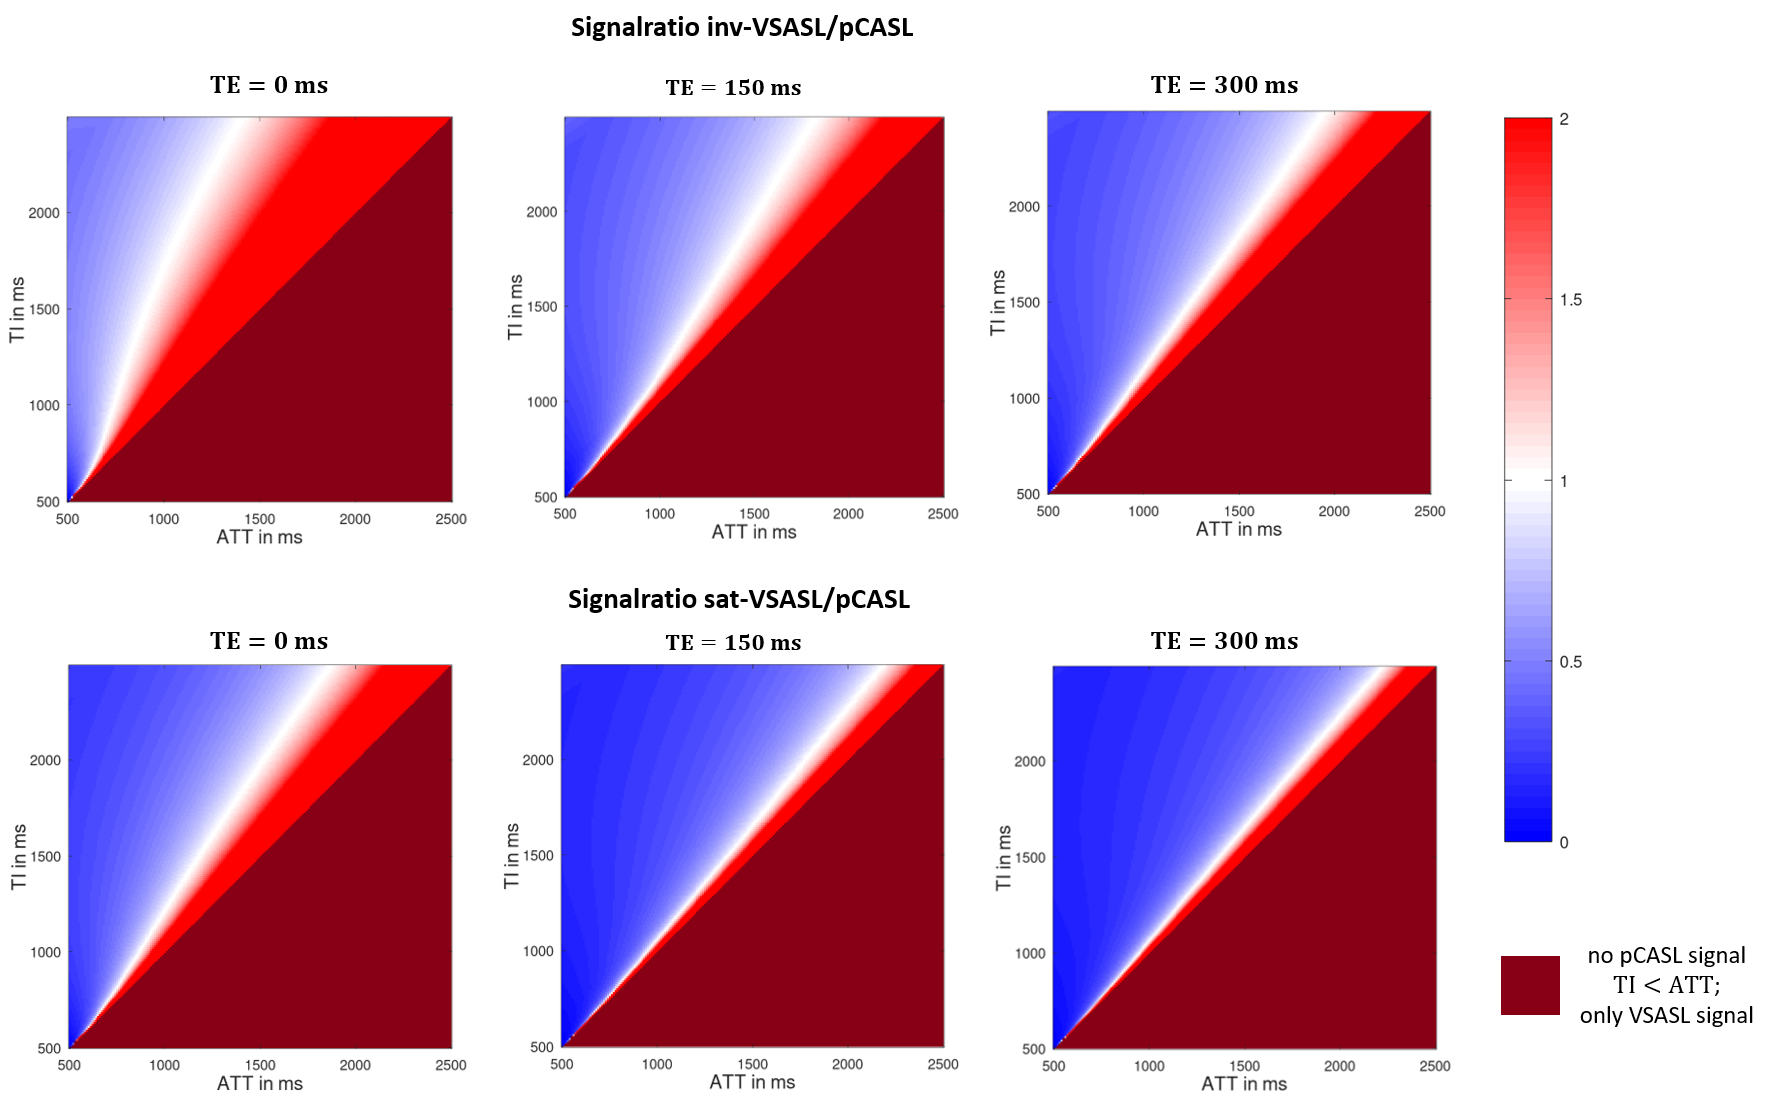
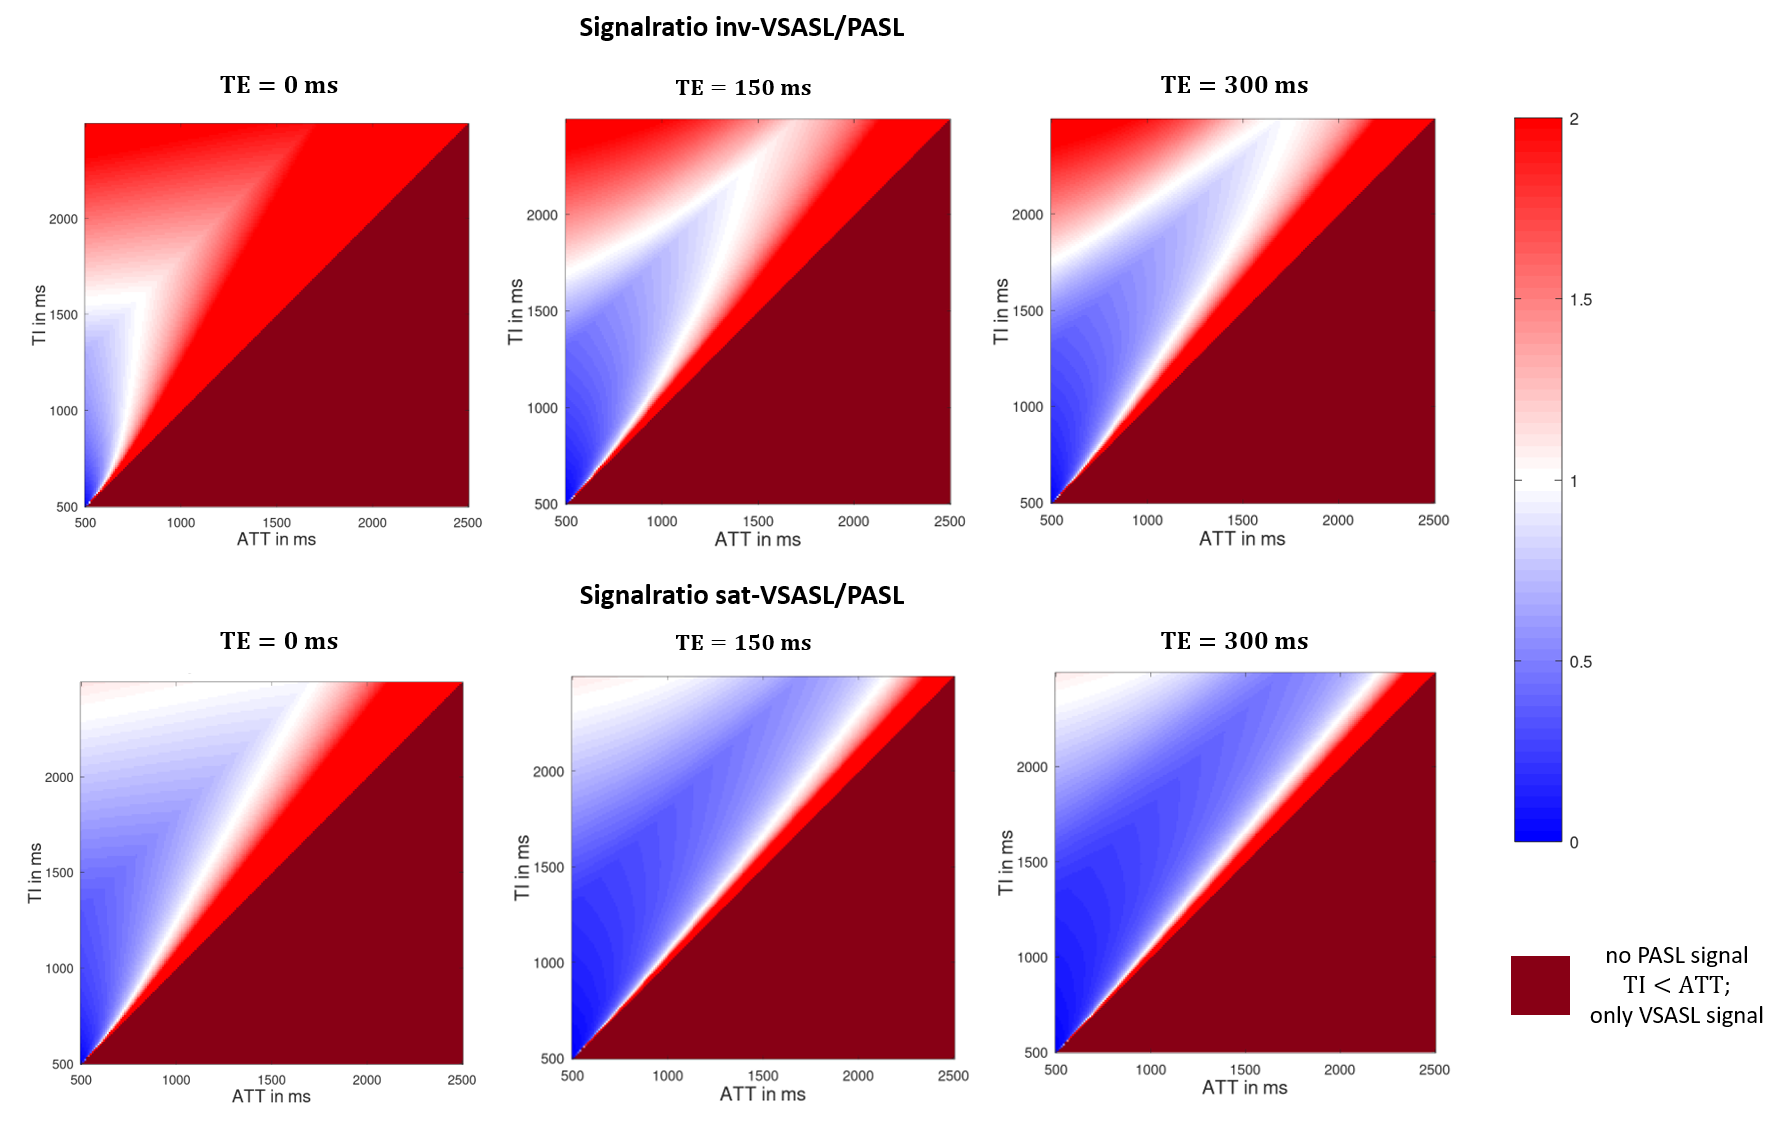
3D simulated data for the imaging voxel and the influence of different TI and TE values are shown in figure 2. Along the TI-axis it can be seen that the VSASL signal rises immediately due to the independence of ATT and decreases again after TI=1675ms. With increasing TE values, the signal decreases with respect to the exponential T2-decay along the TE-axis.Figure 3 and 4 show the signal ratio of VSASL to pCASL and VSASL to PASL for different TI and ATT values. The comparison was done for inv-VSASL and sat-VSASL for TE=(0, 150, 300)ms. It can be seen that especially for longer ATT values, the signal intensity is higher with the VSASL technique compared to pCASL in all cases. In the comparison with PASL it can be seen, that additionally for short ATTs and long TIs the inv-VSASL signal is higher.
Discussion
Due to the insensitivity of VSASL to ATT, the signal starts to increase immediately because of labeling directly within the voxel and a steady inflow of blood into the tissue can be seen. The chosen TI determines the bolus length and therefore the signal increases steadily as new, freshly labeled blood enters the voxel with increasing TI. After a maximum at TI=1675ms, the signal starts to decrease due to the T1-relaxation. The point at which the signal starts to decrease indicates that T1-relaxation has become the dominant effect over the accumulated signal of labeled blood entering the tissue.Furthermore, the 3D simulation shows a decrease in tissue signal during multi-TE measurements according to the T2-decay. The signal difference between individual TEs also reaches maximum at TI=1675ms, which indicates that an optimal timing of TI will help to optimize a multi-TE measurement.
The colormaps of the signal quotient show the benefit of VSASL over pCASL and PASL in measurements with expected prolonged ATTs. For example, according to the White Paper6 TI=1800ms is recommended for pCASL. Figure 3 clearly shows that in this case, for ATTs above 1400ms, inv-VSASL for TE=150ms is expected to have higher signal intensities.
Conclusion
In conclusion, this abstract presents an analytical model for combining VSASL with multi-TE measurements to determine exchange dynamics and permeability information. The comparison of signal intensities between pCASL or PASL and VSASL shows that especially for higher ATT values multi-TE VSASL could be a promising alternative to the standard multi-TE pCASL or multi-TE PASL measurements.Acknowledgements
No acknowledgement found.References
[1] E. C. Wong et al., “Velocity-selective arterial spin labeling,” Magn. Reson. Med., vol. 55, no. 6, pp. 1334–1341, 2006, doi: 10.1002/mrm.20906.
[2] Q. Qin et al., “Velocity-selective arterial spin labeling perfusion MRI: A review of the state of the art and recommendations for clinical implementation,” Magn. Reson. Med., vol. 88, no. 4, pp. 1528–1547, 2022, doi: 10.1002/mrm.29371.
[3] J. Gregori et al., “T2-based arterial spin labeling measurements of blood to tissue water transfer in human brain,” J. Magn. Reson. Imaging, vol. 37, no. 2, pp. 332–342, 2013, doi: 10.1002/jmri.23822.
[4] A. Mahroo et al., “Robust Multi-TE ASL-Based Blood–Brain Barrier Integrity Measurements,” Front. Neurosci., vol. 15, no. December, pp. 1–14, 2021, doi: 10.3389/fnins.2021.719676.
[5] M. A. Buck et al., “Considering intravoxel transit times is a must for robust determination of blood brain barrier integrity using arterial spin labeling,” in Proceedings of the 38th Annual Scientific Meeting of the ESMRMB, 2021
[6] D. C. Alsop et al., “Recommended implementation of arterial spin-labeled Perfusion mri for clinical applications: A consensus of the ISMRM Perfusion Study group and the European consortium for ASL in dementia,” Magn. Reson. Med., vol. 73, no. 1, pp. 102–116, 2015, doi: 10.1002/mrm.25197
Figures