0375
Velocity-selective arterial spin labelling bolus duration measurements: Implications for consensus recommendations1Cardiff University Brain Research Imaging Centre (CUBRIC), School of Psychology, Cardiff University, Cardiff, United Kingdom, 2Cardiff University Brain Research Imaging Centre (CUBRIC), School of Physics and Astronomy, Cardiff University, Cardiff, United Kingdom, 3Department of Neurosciences, Imaging and Clinical Sciences, ‘G. d’Annunzio University’ of Chieti-Pescara, Chieti, Italy, 4Institute for Advanced Biomedical Technologies (ITAB), ‘G. d’Annunzio University’ of Chieti-Pescara, Chieti, Italy
Synopsis
Keywords: Arterial spin labelling, Brain, cerebrovascular reactivity
Velocity-selective ASL (VSASL) measurement of CBF is relatively insensitive to arterial arrival times, unlike other ASL techniques, making it suitable for measuring CBF in patient groups with long arrival times. However, VSASL can underestimate CBF when the trailing edge of the labelled bolus arrives before imaging. Our study finds substantial spatial heterogeneity in bolus duration in Fourier Transform velocity-selective inversion (FT-VSI), with short bolus durations in anterior regions and longer bolus durations in posterior regions. These results build on a recent VSASL consensus paper contributing to recommendations for cerebrovascular reactivity mapping experiments.
Introduction
Velocity-selective arterial spin labelling (VSASL) has been the focus of significant recent development 1, due to the relative insensitivity of the method to arterial arrival time. This is particularly important in patient groups with abnormal vasculature leading to long arrival times. However, whilst the community is reaching consensus on acquisition sequence parameters, a recent Fourier Transform velocity-selective inversion (FT-VSI) study 2 demonstrated that cerebrovascular reactivity (a change in CBF and arterial arrival times induced by hypercapnia) was dependant on the post-inversion delay (PID; time between inversion and vascular crushing), indicating that the trailing edge of the labelled bolus arrives before a standard PID of 1520ms, causing an underestimation in CBF. In this abstract we measure FT-VSI bolus duration to assess whether the community consensus PID of 1400 ms 1 is shorter than the bolus duration in a young healthy group.Methods
Bolus duration and CBF were measured in eight healthy participants (6 females; ages 18-43, median 21 years), using a Siemens Prisma 3 Tesla MRI with 32 channel head receive coil. FT-VSI was implemented with regional pre-sat (2s pre-delay), composite refocusing pulses, velocity-compensated control, and a sym-BIR-8-based vascular crushing module. vcutoff was defined as per 1. Data were acquired with 3 different vcutoff values (2, 3, and 4cm/s) and 11 post-inversion delay times (4 averages each) with 3 background suppression pulses timed to ensure negative perfusion contrast at each PID. The PID times were 0.55, 0.66, 0.8, 0.96, 1.15, 1.39, 1.67, 2, 2.4, 2.9, 3.5s. A 2D EPI readout was used (such that the post-label delay increased for each slice), with 3.3x3.3mm in-plane resolution, 15 slices (6mm thickness), and 6/8 partial Fourier. A 1mm isotropic MPRAGE (TI = 0.85s; TR = 2.1s; 8°) was acquired for image registration and grey matter segmentation.Bolus duration and CBF were estimated using a standard 1-compartment kinetic model and unconstrained minimisation. M0 scans were coregistered to the MPRAGE using FSL epi_reg 3,4 and the MPRAGE coregistered to MNI152 space using FSL FLIRT 3. Group average bolus duration and CBF were calculated in MNI152 space.
Results and Discussion
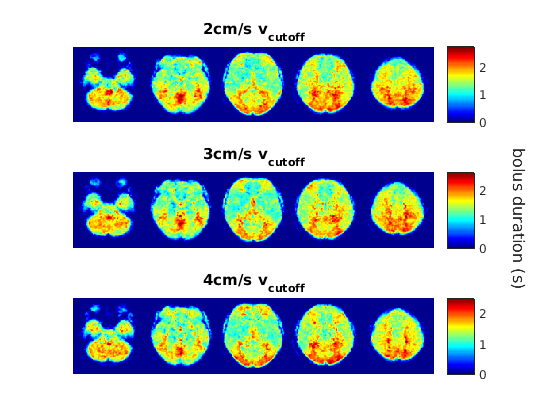
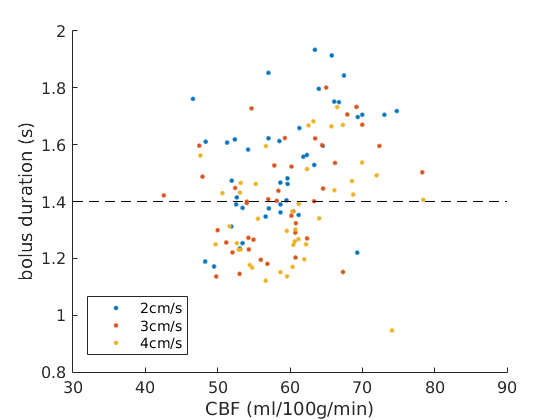
Bolus duration heterogeneityGroup-average bolus duration maps (Figure 1) show spatial heterogeneity, with longer bolus durations in regions fed by posterior feeding arteries and shorter bolus durations in anterior regions. The distribution of bolus durations and CBF across brain regions are demonstrated in Figure 2, which shows that many regions have bolus durations lower than the consensus recommendation PID of 1.4s.
PID recommendation
To probe the recommended PID, the percentage of grey matter where bolus duration is shorter than 1.4s was assessed for each subject. 46±12 % (mean± standard deviation across subjects) of grey matter in the 2cm/s cutoff data was below the consensus recommendation of 1.4s. Table 1 also presents this percentage for the other vcutoff data and illustrates the effect of reducing PID. Our data suggest that a PID of 1s or less significantly reduces FT-VSI dependence on bolus duration and would be appropriate for studies that are expected to be sensitive to changes in bolus duration.
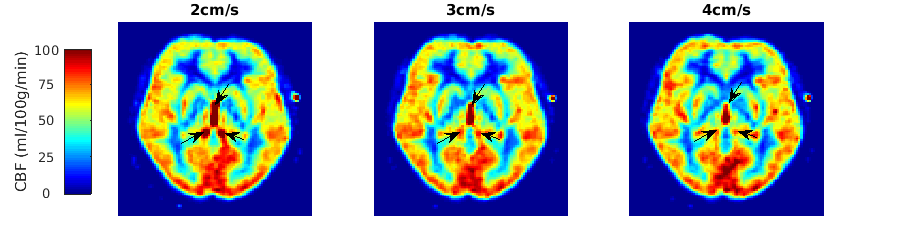
Velocity cutoff (vcutoff) values were varied from the recommended 2cm/s to assess whether higher vcutoff values were hindered by significantly shorter bolus durations. Bolus durations appear to be similar across the three vcutoff values investigated (Figures 1 and 2), although this study lacks the power to robustly assess whether there is a small effect of vcutoff on bolus duration, it suggests that any decrease is small compared with the regional variations in bolus duration. The reason for choosing higher vcutoff is to reduce CSF contamination, as exemplified in the ventricles in CBF measurements in Figure 3.
Conclusion
Heterogeneity in bolus duration in FT-VSI can lead to underestimation of CBF with the currently recommended PID of 1.4 s. Our data suggests that a PID of 1s or less will minimise any bias in CBF measurements, although at the expense of reduced signal-to-noise in superior and posterior brain regions. The use of a shorter PID will be particularly important when studying groups or states where bolus duration is expected to change, such as cerebrovascular reactivity mapping or ageing studies. We also found that increasing vcutoff did not have a significant effect on either bolus duration or CBF quantification. However, there is a clear reduction in CSF contamination, which could bias cerebrovascular reactivity measurements, or confound CBF quantification in certain pathologies. Therefore, we recommend increasing FT-VSI vcutoff to at least 3cm/s for such studies.Acknowledgements
HLC, ID, and MG were funded by a Wellcome Strategic Award to CUBRIC, ‘Multi-scale and multi-modal assessment of coupling in the healthy and diseased brain’, grant reference 104943/Z/14/Z. EP and MG were funded by EPSRC grant ‘An integrated MRI tool to map brain microvascular and metabolic function: improving imaging diagnostics for human brain disease’ EP/S025901/1. MG thanks the Wellcome Trust for its support via a Sir Henry Dale Fellowship (220575/Z/20/Z).References
1. Qin Q, Alsop D, Bolar D, et al. Velocity-selective arterial spin labeling perfusion MRI: A review of the state of the art and recommendations for clinical implementation. Magn Reson Med. 2022;88(4):1528–1547.
2. Xu F, Xu C, Liu D, et al. Comparison of velocity selective ASL and PCASL with phase-contrast MRI for measuring CO2-induced cerebrovascular reactivity. Proc. ISMRM 2022; 31:4907.
3. Jenkinson M, Bannister P, Brady J, and Smith S. Improved Optimisation for the Robust and Accurate Linear Registration and Motion Correction of Brain Images. NeuroImage. 2002;17(2):825-841.
4. Greve D and Fischl B. Accurate and robust brain image alignment using boundary-based registration. NeuroImage. 2009;48(1):63-72.Figures