0374
Simultaneous 4D ASL angiography and perfusion MRI using time-encoded pCASL preparation with Stack of Spirals readout
Merlijn C.E. van der Plas1,2, Kirsten Koolstra3, Martijn Nagtegaal2, Emiel Hartsema2, Lena Vaclavu2, Sophie Schmid2, Leoni Petitclerc2, Peter Bornert4, and Matthias van Osch2
1University Medical Center Utrecht, Utrecht, Netherlands, 2C.J. Gorter Center for high field MRI, Leiden University Medical Center, Leiden, Netherlands, 3Phillips, Best, Netherlands, 4Phillips, Hamburg, Germany
1University Medical Center Utrecht, Utrecht, Netherlands, 2C.J. Gorter Center for high field MRI, Leiden University Medical Center, Leiden, Netherlands, 3Phillips, Best, Netherlands, 4Phillips, Hamburg, Germany
Synopsis
Keywords: Arterial spin labelling, Perfusion
In this study, a framework was set up for the simultaneous acquisition of 4D MRA and perfusion ASL data while maintaining whole brain coverage. A Hadamard-8 preparation was combined with a 3D Stack of Spirals readout which resulted in 7 timepoints. By combining these two techniques we were able to obtain both angiography and perfusion from a single dataset. By improving the efficiency of the sampling scheme i.e. using variable density spirals, the total scan time could be reduced further while improving the SNR during the perfusion phase, albeit at the expense of the quality of the 4D MRA.Introduction
The combination of 4D angiographic and perfusion information can provide essential insight into the hemodynamic condition of the brain. Recently, ASL was combined with a single slice radial readout to simultaneously obtain high temporal and high spatial resolution 2D angiography and low spatial resolution perfusion images1,2. Compared to radial trajectories, spiral trajectories are more efficient regarding k-space coverage and are even more flexible, since the sampling density can be varied3. Especially for the simultaneous acquisition of angiography and perfusion data, a variable density spiral could be of interest, since the center of k-space can be oversampled to improve the SNR of the perfusion images. On the other hand, the outer part of k-space can easily be undersampled, as angiographic images are well-known to be sparse4.The aim of this study was to simultaneously acquire 4D ASL angiographic and perfusion images from a single dataset while maintaining whole brain coverage and improve SNR during the perfusion phase. Therefore, we combined a time-encoded pseudo-continuous arterial spin labeling (te-pCASL) preparation with a (uniform or variable density) 3D Stack of Spirals (SoS) readout.
Methods
Three healthy volunteers (age 25-28 y.o., 3f) were scanned using a 32-channel head coil on a 3T-scanner (Ingenia-CX, Philips). All volunteers provided informed consent and the study was approved by the local IRB.A Hadamard-8 matrix, which was used as the temporal resolution source, was followed by a segmented 3D SoS turbo-field echo spiral readout block having a golden angle feature, played out after a post-labeling-delay (PLD) of 280 ms (Figure 1). Two Frequency Offset Corrected Inversion (FOCI) pulses at 1815 and 3135 ms were used for background suppression. Three different spiral trajectories were used to acquire three datasets: uniform density spiral and a variable density spiral with R=2 or R=3 (Figure 2) using 19 kz phase-encodings employing a flip-angle-sweep to maintain constant signal (TR/TE 31/1.85 ms, acquisition matrix 256).
An offline reconstruction in Python (V3.6 and V3.7), using the SigPy package, was employed. Sampling density correction was applied before the adjoint non-uniform Fast Fourier Transform5 and final coil combination by using a sum-of-squares approach. For the angiography an oversampling factor of 1.1 along the z-direction was used. For the perfusion phase an oversampling factor of 1.6 was used, because fold-in artefacts are more evident in the perfusion images than in the 4D MRA images. Since for perfusion imaging a low spatial resolution is preferred to enhance SNR, only the densely sampled center of k-space was included in the perfusion reconstructions (Figure 2).
To compare the SNR between the different acquired datasets, all scans were repeated once. Temporal SNR for the perfusion data was calculated as follows: tSNR=(mean signal over time)/(std over time) within the gray matter (GM).
Results
Figure 3 shows the maximum intensity projection (MIP) for the angiographic phase (A) and the perfusion phase (B) for a representative subject for all three datasets. The labeled blood is captured flowing into and through the Circle of Willis while later time points show the blood traversing the vasculature towards the tissue. The rightmost images show the MIP of the sum of all four timepoints of the angiographic phase. The second and third row show the angiographic phase for the undersampled datasets. For the fully sampled dataset the labeled blood is visible further down the vascular tree and the signal intensity is higher. The perfusion phase is reconstructed at a lower spatial resolution leading to an increased SNR as when reconstructed at the high resolution of the angiography images.The GM tSNR showed an increase for the variable density scans compared to a uniform spiral (Table 1). The data with R=3 showed the highest tSNR, since for this dataset the center of k-space was oversampled the most, resulting in a higher percentage of k-space points being included for the perfusion reconstruction.
The two repeats of the variable density spiral with R=3 were averaged to increase SNR (Figure 4). The total scan time for this dataset was 5 min 54 sec and especially in the perfusion phase, an increase in image quality can be observed compared to the fully sampled dataset.
Discussion and Conclusion
In this study, a framework was set up for the simultaneous acquisition of 4D MRA and perfusion ASL data while maintaining whole brain coverage. By combing te-pCASL with a 3D SoS readout, which resulted in 7 timepoints, both angiography and perfusion were obtained from a single dataset. Using variable density spirals, the total scan time could be reduced further while improving the SNR during the perfusion phase, albeit at the expense of the quality of the 4D MRA.It was checked whether a conjugate phase reconstruction6,7 would improve the quality of the images, however, since B0 inhomogeneities were small (within 30 Hz), this was not the case. In addition, for the perfusion reconstruction only the densely sampled center of k-space was used, which resulted in a very short acquisition window of 2.3 ms per spiral. Further optimization of the exact spiral trajectories, the use of concurrent magnetic field monitoring to characterize the effective trajectories, as well as improved reconstruction approaches would be logical next steps8.
Acknowledgements
This work is part of the research programme Innovational Research Incentives Scheme Vici with project number 016.160.351, which is financed by the Netherlands Organisation for Scientific Research (NWO).References
1. T.W. Okell, Combined angiography and perfusion using radial imaging and arterial spin labeling. Magn Reson Med, 2019. 81(1): p. 182-194.2. M.C.E. van der Plas, S. Schmid, M. Versluis, T. Okell and M. van Osch, Time-encoded golden angle radial arterial spin labeling: Simultaneous acquisition of angiography and perfusion data. NMR in Biomedicine, 2021. 34: p. e4519.
3. J.G. Pipe and N.R. Zwart, Spiral trajectory design: a flexible numerical algorithm and base analytical equations. Magn Reson Med, 2014. 71(1): p. 278-85.
4. M. Lustig, D. Donoho and J.M. Pauly, Sparse MRI: The application of compressed sensing for rapid MR imaging. Magn Reson Med, 2007. 58(6): p. 1182-95.
5. R.D. Hoge, R.K.S. Kwan and G.B. Pike, Density compensation functions for spiral MRI. Magnetic Resonance in Medicine, 1997. 38: p. 117-128.
6. Lai-Chee Man, John M. Pauly and A. Macovski, Multifrequency interpolation for fast off‐resonance correction. Magnetic Resonance in Medicine, 1997. 37: p. 785-792.
7. P. Bornert, H. Schomberg, B. Aldefeld and J. Groen, Improvements in Spiral MR Imaging. MAGMA, 199: p. 19-41.
8. B.J. Wilm, C. Barmet, S. Gross, et al., Single-shot spiral imaging enabled by an expanded encoding model: Demonstration in diffusion MRI. Magn Reson Med, 2017. 77(1): p. 83-91.
Figures
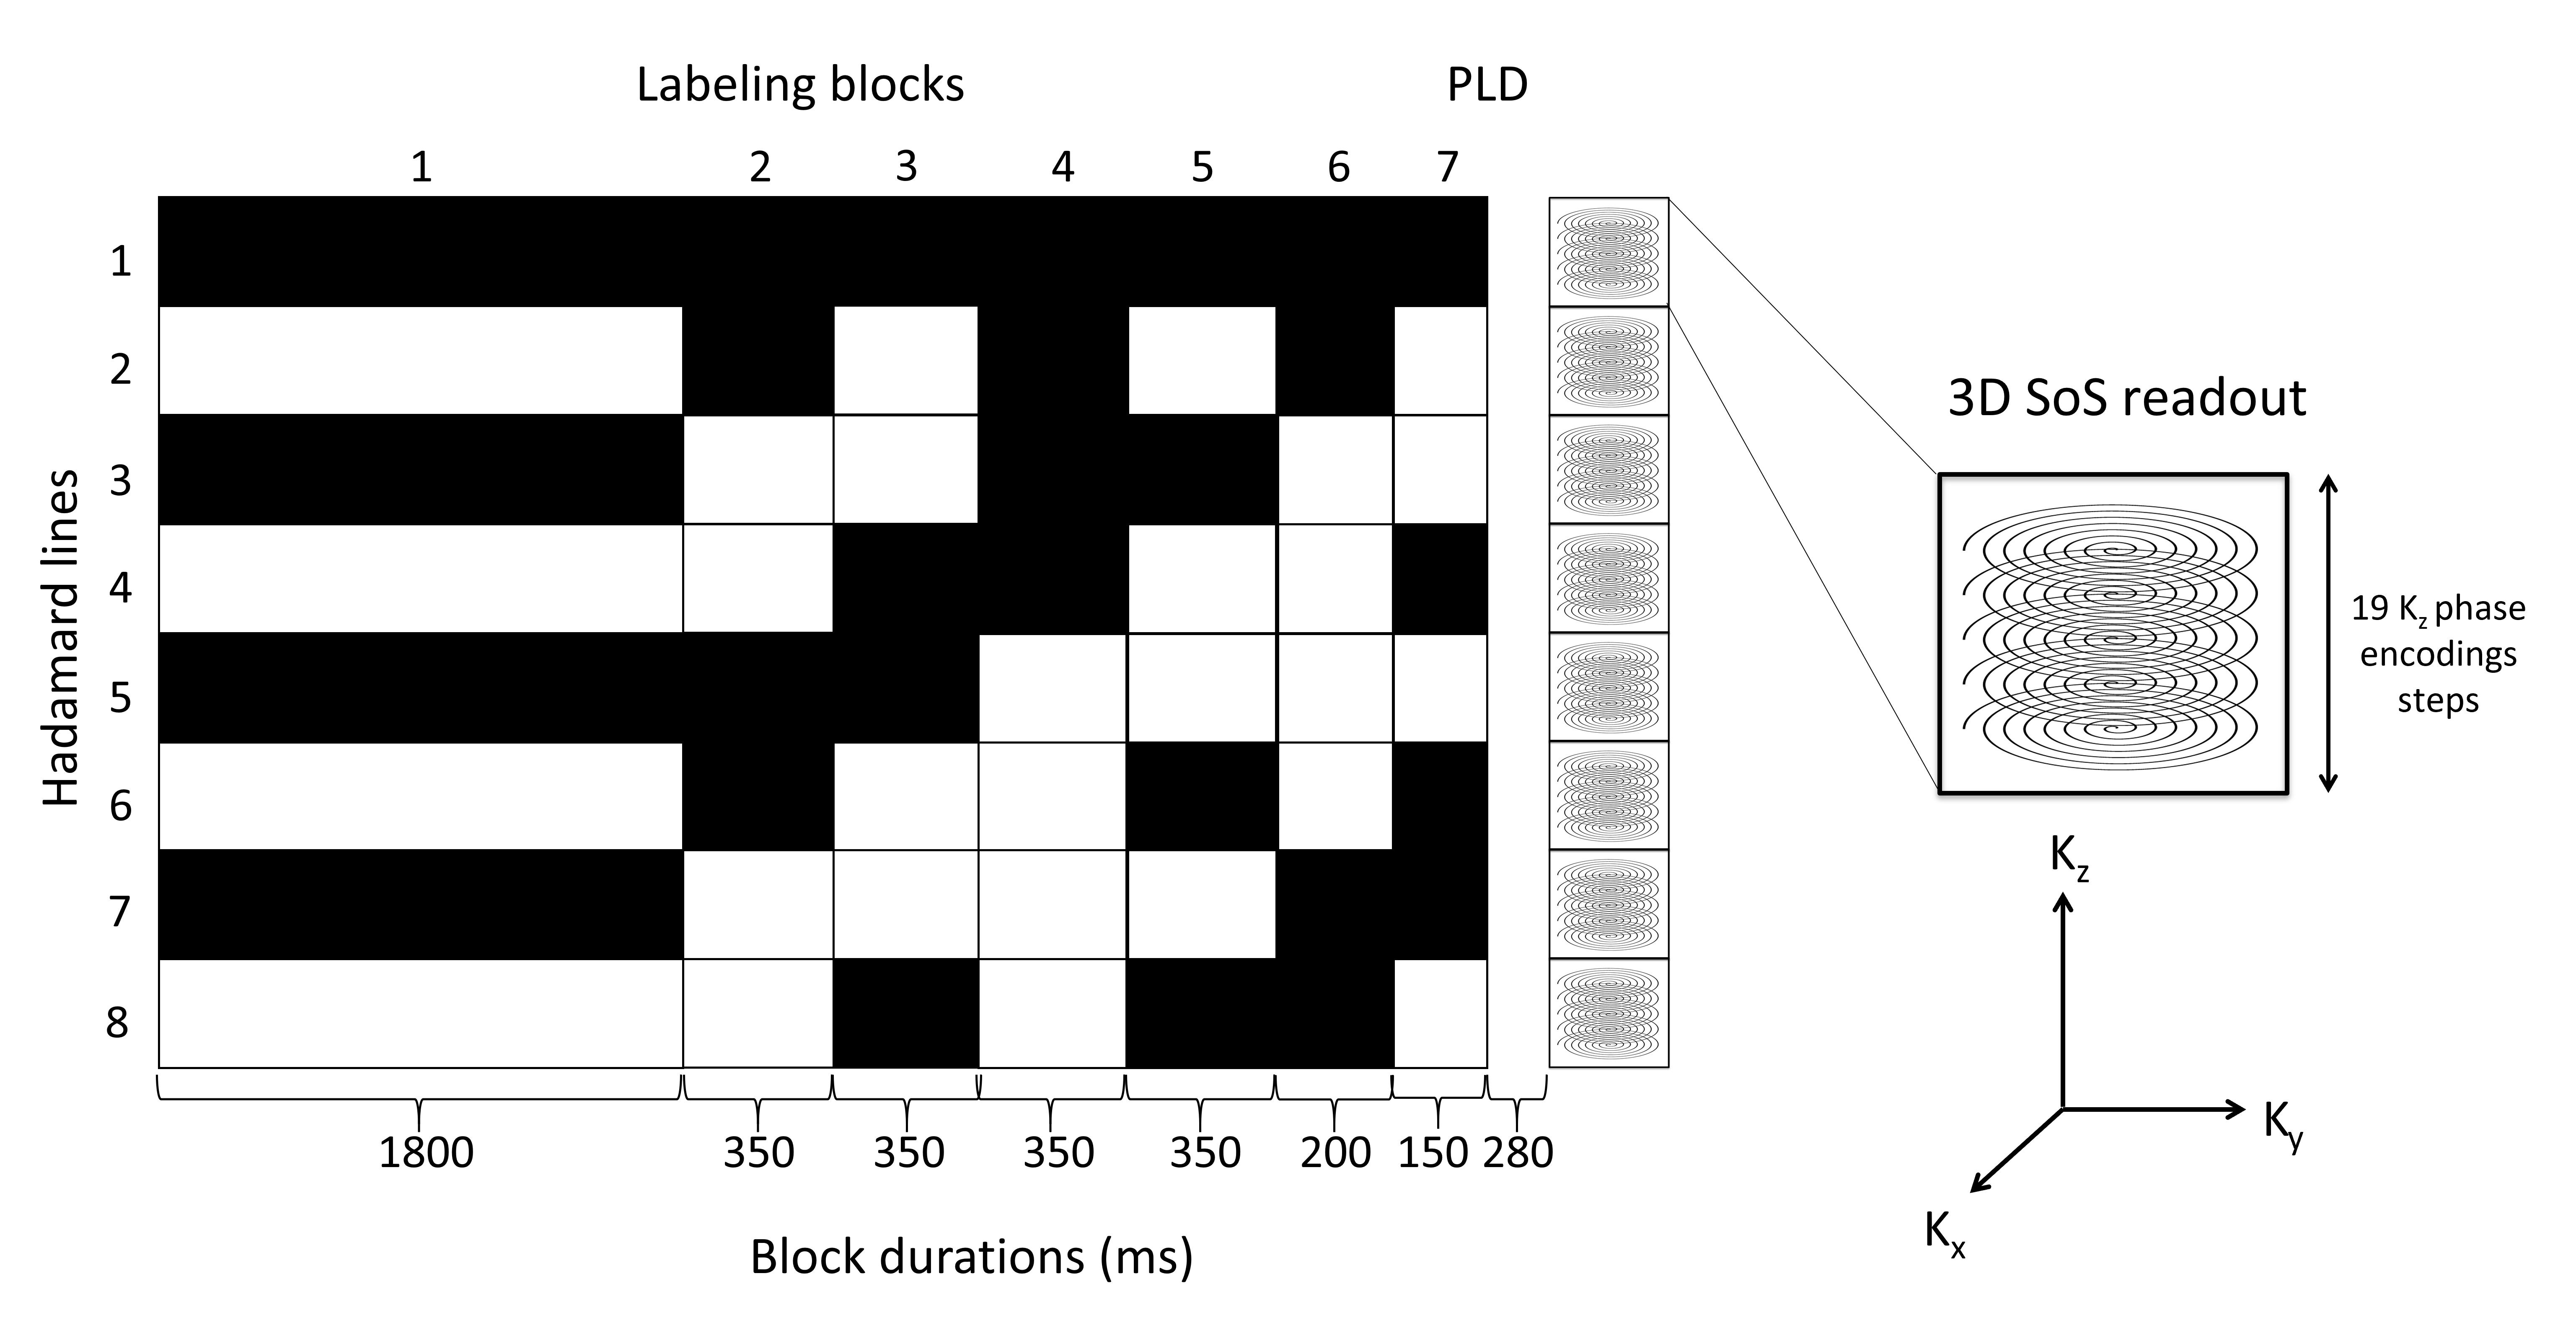
Figure 1.
Overview of the Hadamard-8 labeling scheme for a 3D turbo-field echo SoS
readout. The total label duration of 3550 ms was divided over seven sub-boli. The
black blocks indicate labeling; the white blocks indicate control condition,
and the numbers below the blocks represent the duration in milliseconds. Please
note, that each magnetization prepared 3D SoS sampling block samples the same
in-plane spiral interleaf for all kz steps, after which the next
magnetization preparation (labeling) is
repeated and the next spiral interleaf is acquired for all kz
phase-encodes.
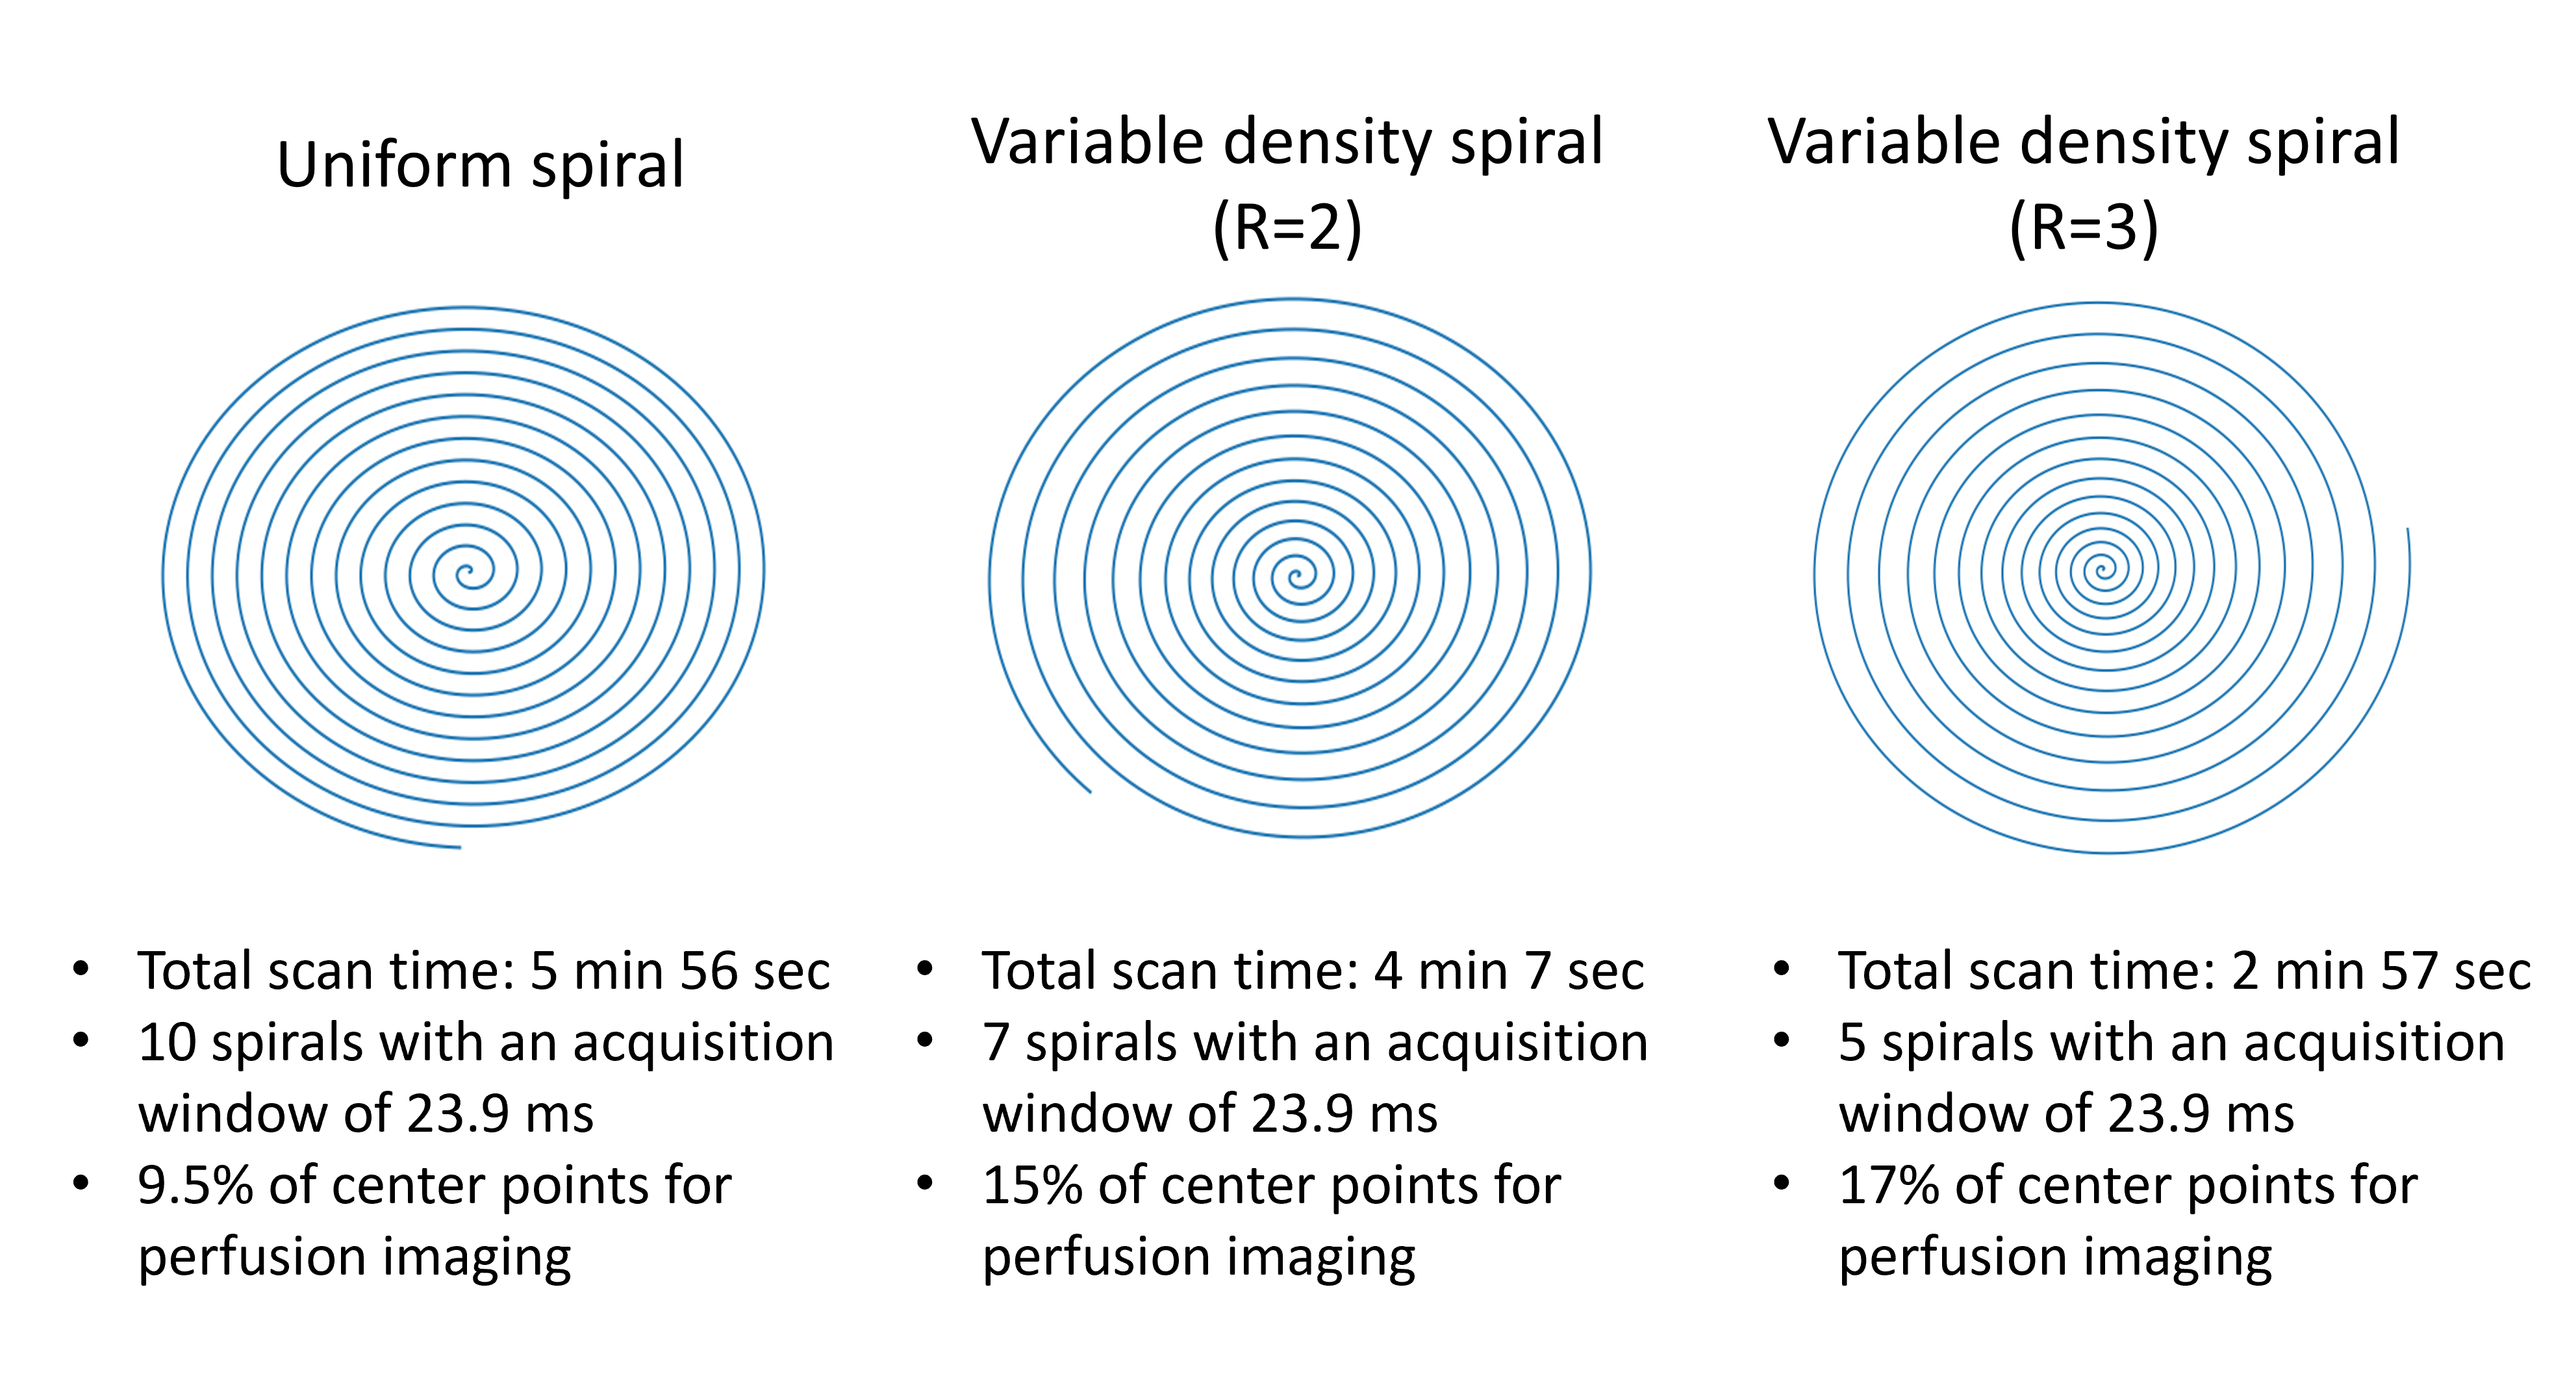
Figure 2.
Different spiral trajectories employed in this study. (left) A uniform spiral
is shown, were the radial distribution of sample points is kept constant over
the entire k-space. (middle and right) Variable density spirals with
respectively an undersampling factor of 2 and 3 of the outer part of k-space.
The center of k-space is now more densely sampled than the outer part, which
will benefit the SNR of the perfusion images whereas the undersampling of the
outer part of k-space will only result in a slightly higher risk of artefacts,
due to the sparsity of angiographic images.
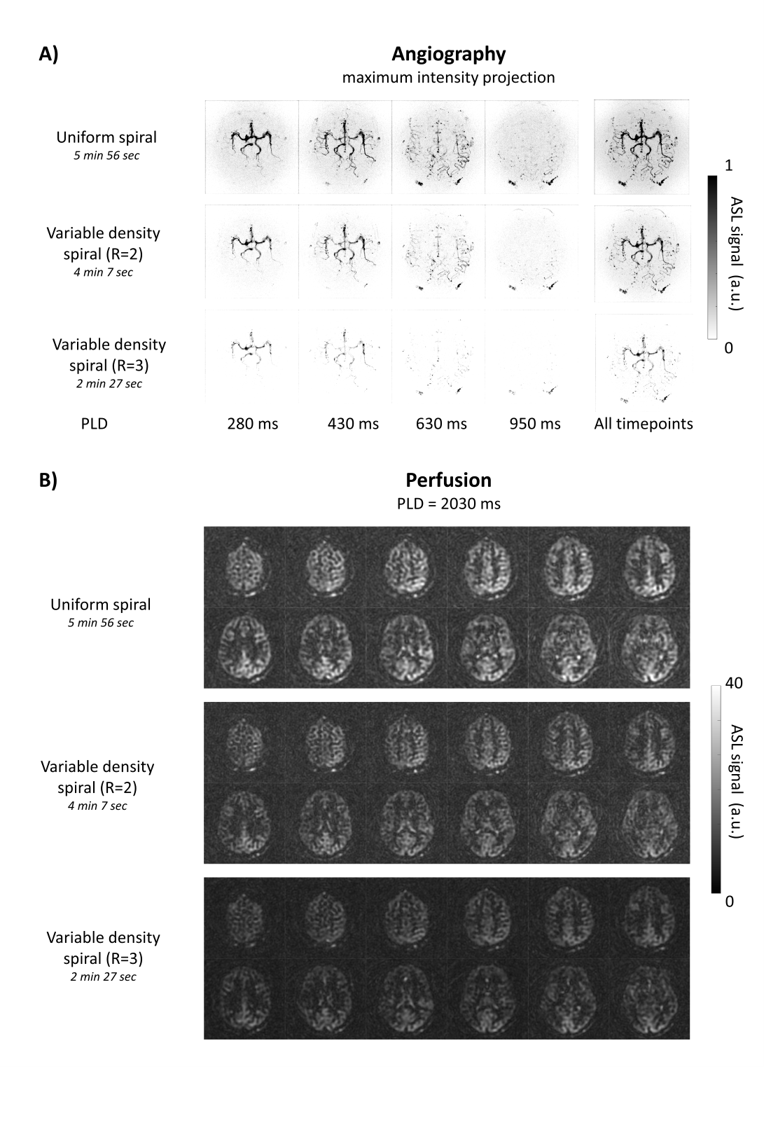
Figure 3. Simultanous angiography and perfusion A) MIPs of the angiographic phase of the ASL data for
all three datasets for a representative volunteer. Separate timepoints are
shown on the left side with the corresponding PLD. On the right side the
maximum intensity projections of the average of these four timepoints is shown.
Note that for the uniformly sampled spiral, the signal is visible further into
the vascular tree compared to the undersampled datasets. B). Perfusion images, for all three
datasets, with an effective label duration of 1800 ms in combination with a PLD
of 2030 ms.
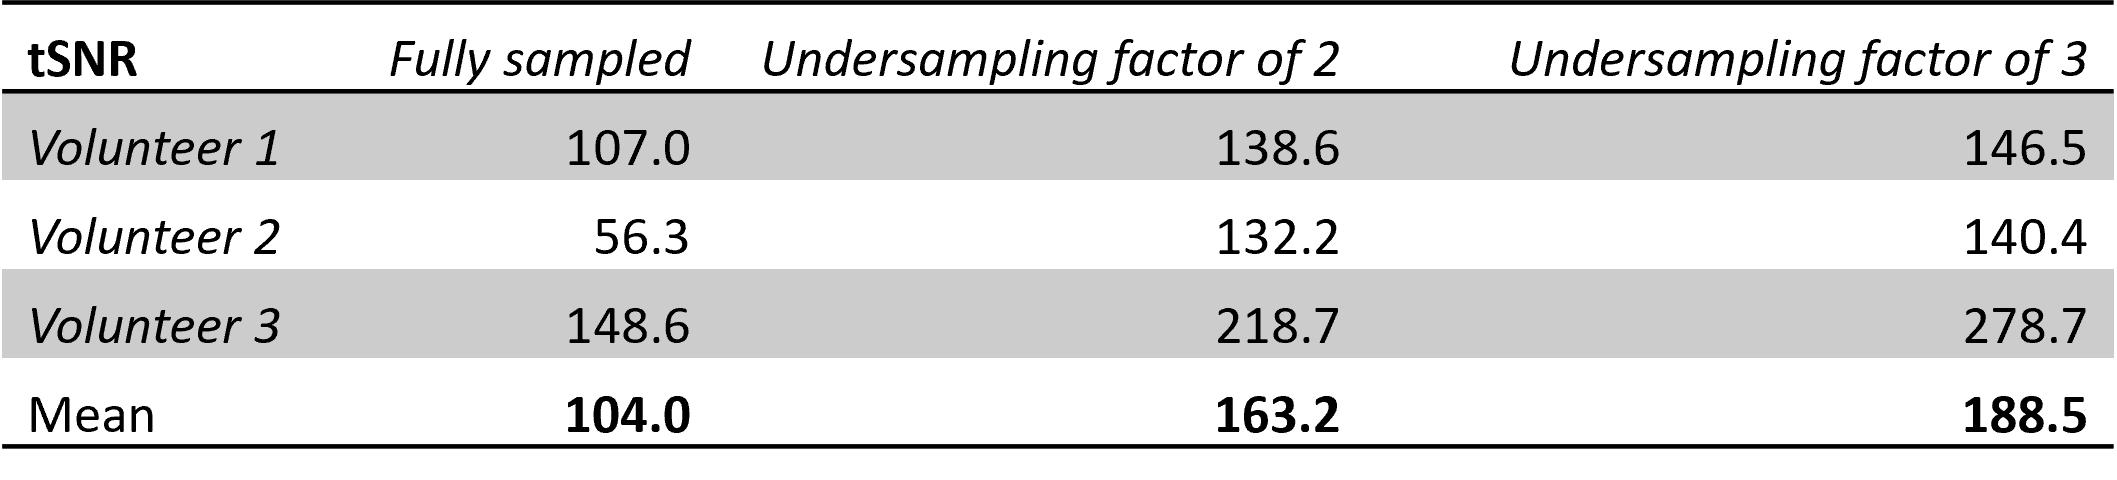
Table 1.
Temporal signal-to-noise ratio (tSNR) in
gray matter per dataset for the perfusion data.
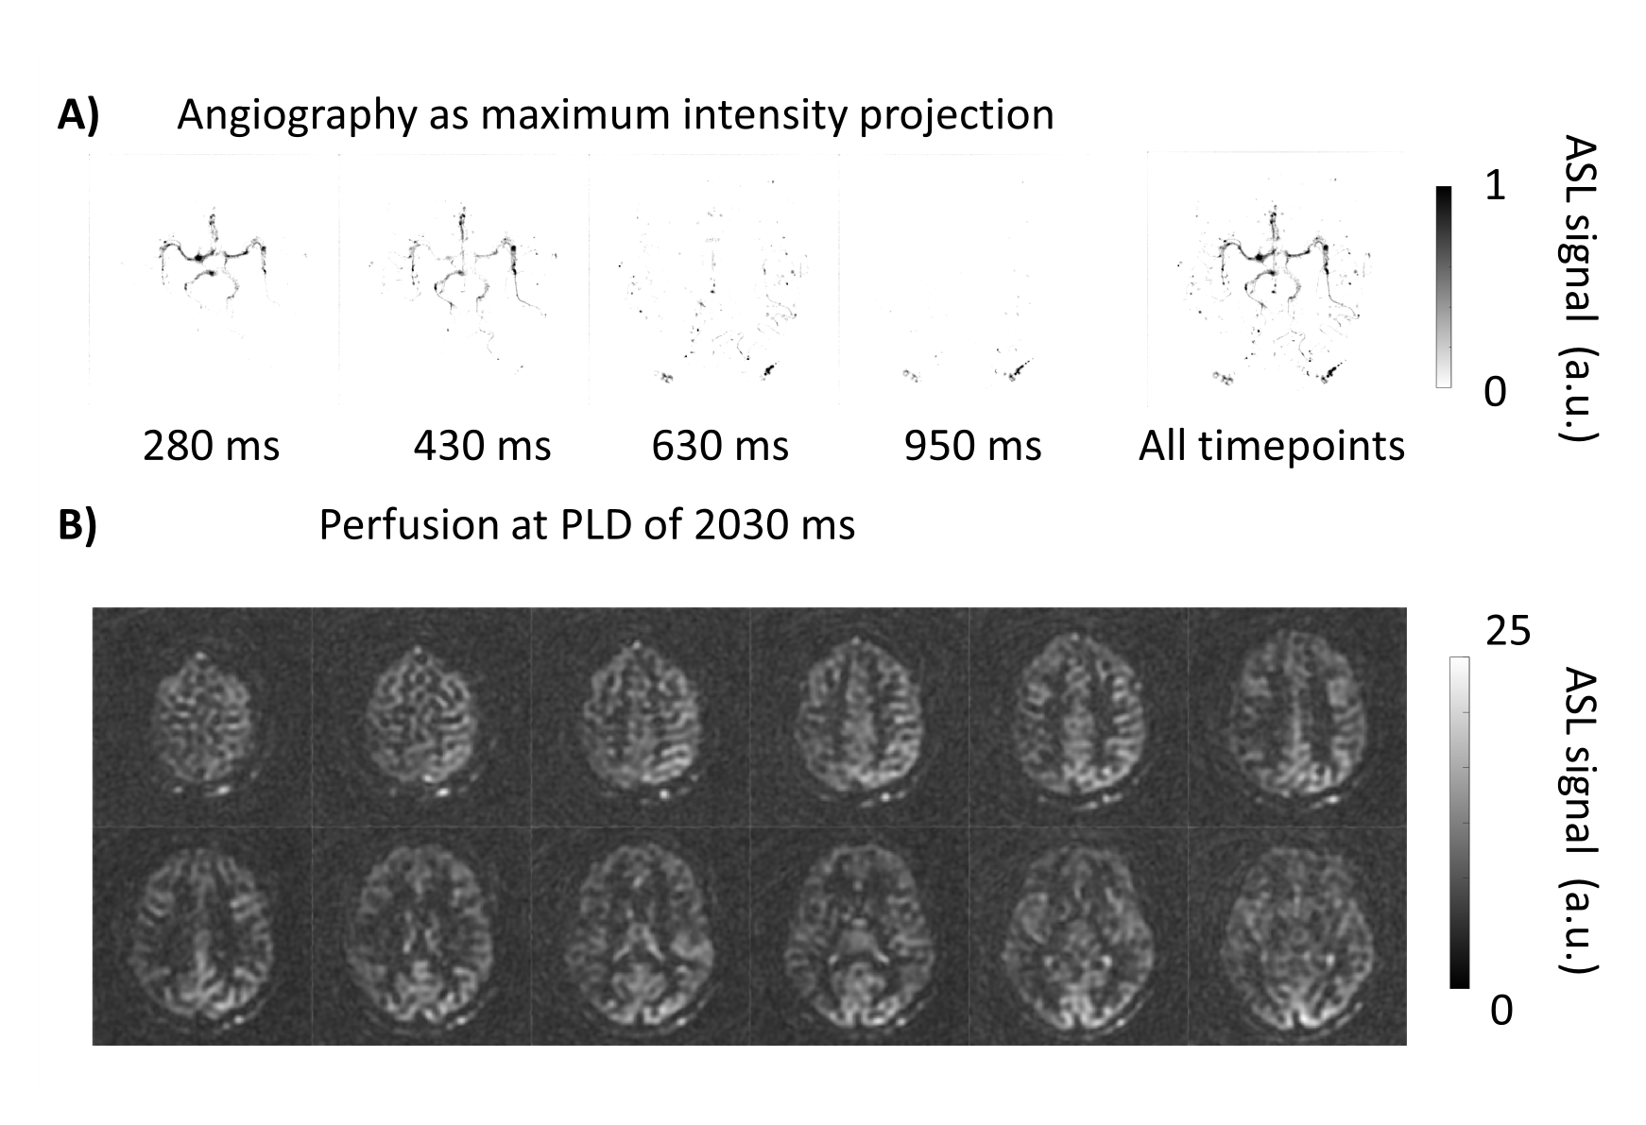
Figure 4.
Angiography and perfusion images of the undersampled variable density spiral
data. Two repeats that were acquired are averaged to increase SNR. The total
scan duration of these two repeats is similar to the scan time of the fully
sampled dataset (Figure 3B, top row). An increase in image quality during the
perfusion phase can be observed.
DOI: https://doi.org/10.58530/2023/0374