0370
Simultaneous imaging of cerebral perfusion and blood-CSF exchange using dual-TE split echo train Fast-Spin-Echo Arterial Spin Labeling1Division of MRI Research, department of Radiology, Beth Israel Deaconess Medical Center, Harvard Medical School, Boston, MA, United States
Synopsis
Keywords: Arterial spin labelling, Neurofluids
The recent years have seen a growing interest in the study of brain waste clearance mechanisms, also referred to as glymphatics. Recently, ASL has been used to image choroid plexus perfusion but also the exchange between blood and CSF by taking advantage of the long CSF T2 compared to blood and brain tissue. We evaluate the possibility to measure this using reduced flip-angles FSE with variable-density k-space sampling, using a split echo-train strategy to collect in the same echo-train a short-TE PD-weighted as well as long-TE T2-weighted ASL datasets. We evaluate in a pilot group potential age-related differences.Introdut
The recent years have seen a growing interest in the study of brain waste clearance mechanisms, also referred to as glymphatics. Particularly, an emphasis is being set on non-invasive methods allowing imaging such function. To achieve such goal, imaging the exchange between blood and cerebrospinal fluid (CSF) is key as the CSF serves as the main clearance pathway of brain waste.Recently, Arterial Spin Labeling (ASL) perfusion imaging has been used to image perfusion in the choroid plexus, a key structure in CSF production1, but also to image more widely the exchange between blood and CSF by taking advantage of the extremely long CSF transverse relaxation time T22,3 compared to blood and brain tissue, creating a long-lived, although small signal. A pioneering study in humans3 provided a theoretical model as well as evidence of a brain-wide signal at ultra-long TE. Based on multi-ASL delay, multi-echo 3D GRASE with high refocusing flip-angles, this study suggested widespread exchange in subarachnoid spaces as well as the choroid plexus.We propose here to evaluate the possibility to observe such signal using a reduced flip-angles FSE readout with variable-density k-space sampling, using a split echo-train strategy to collect in the same echo-train a short TE PD-weighted as well as long-TE T2-weighted ASL datasets. We evaluate in a pilot group potential age-related differences.Methods
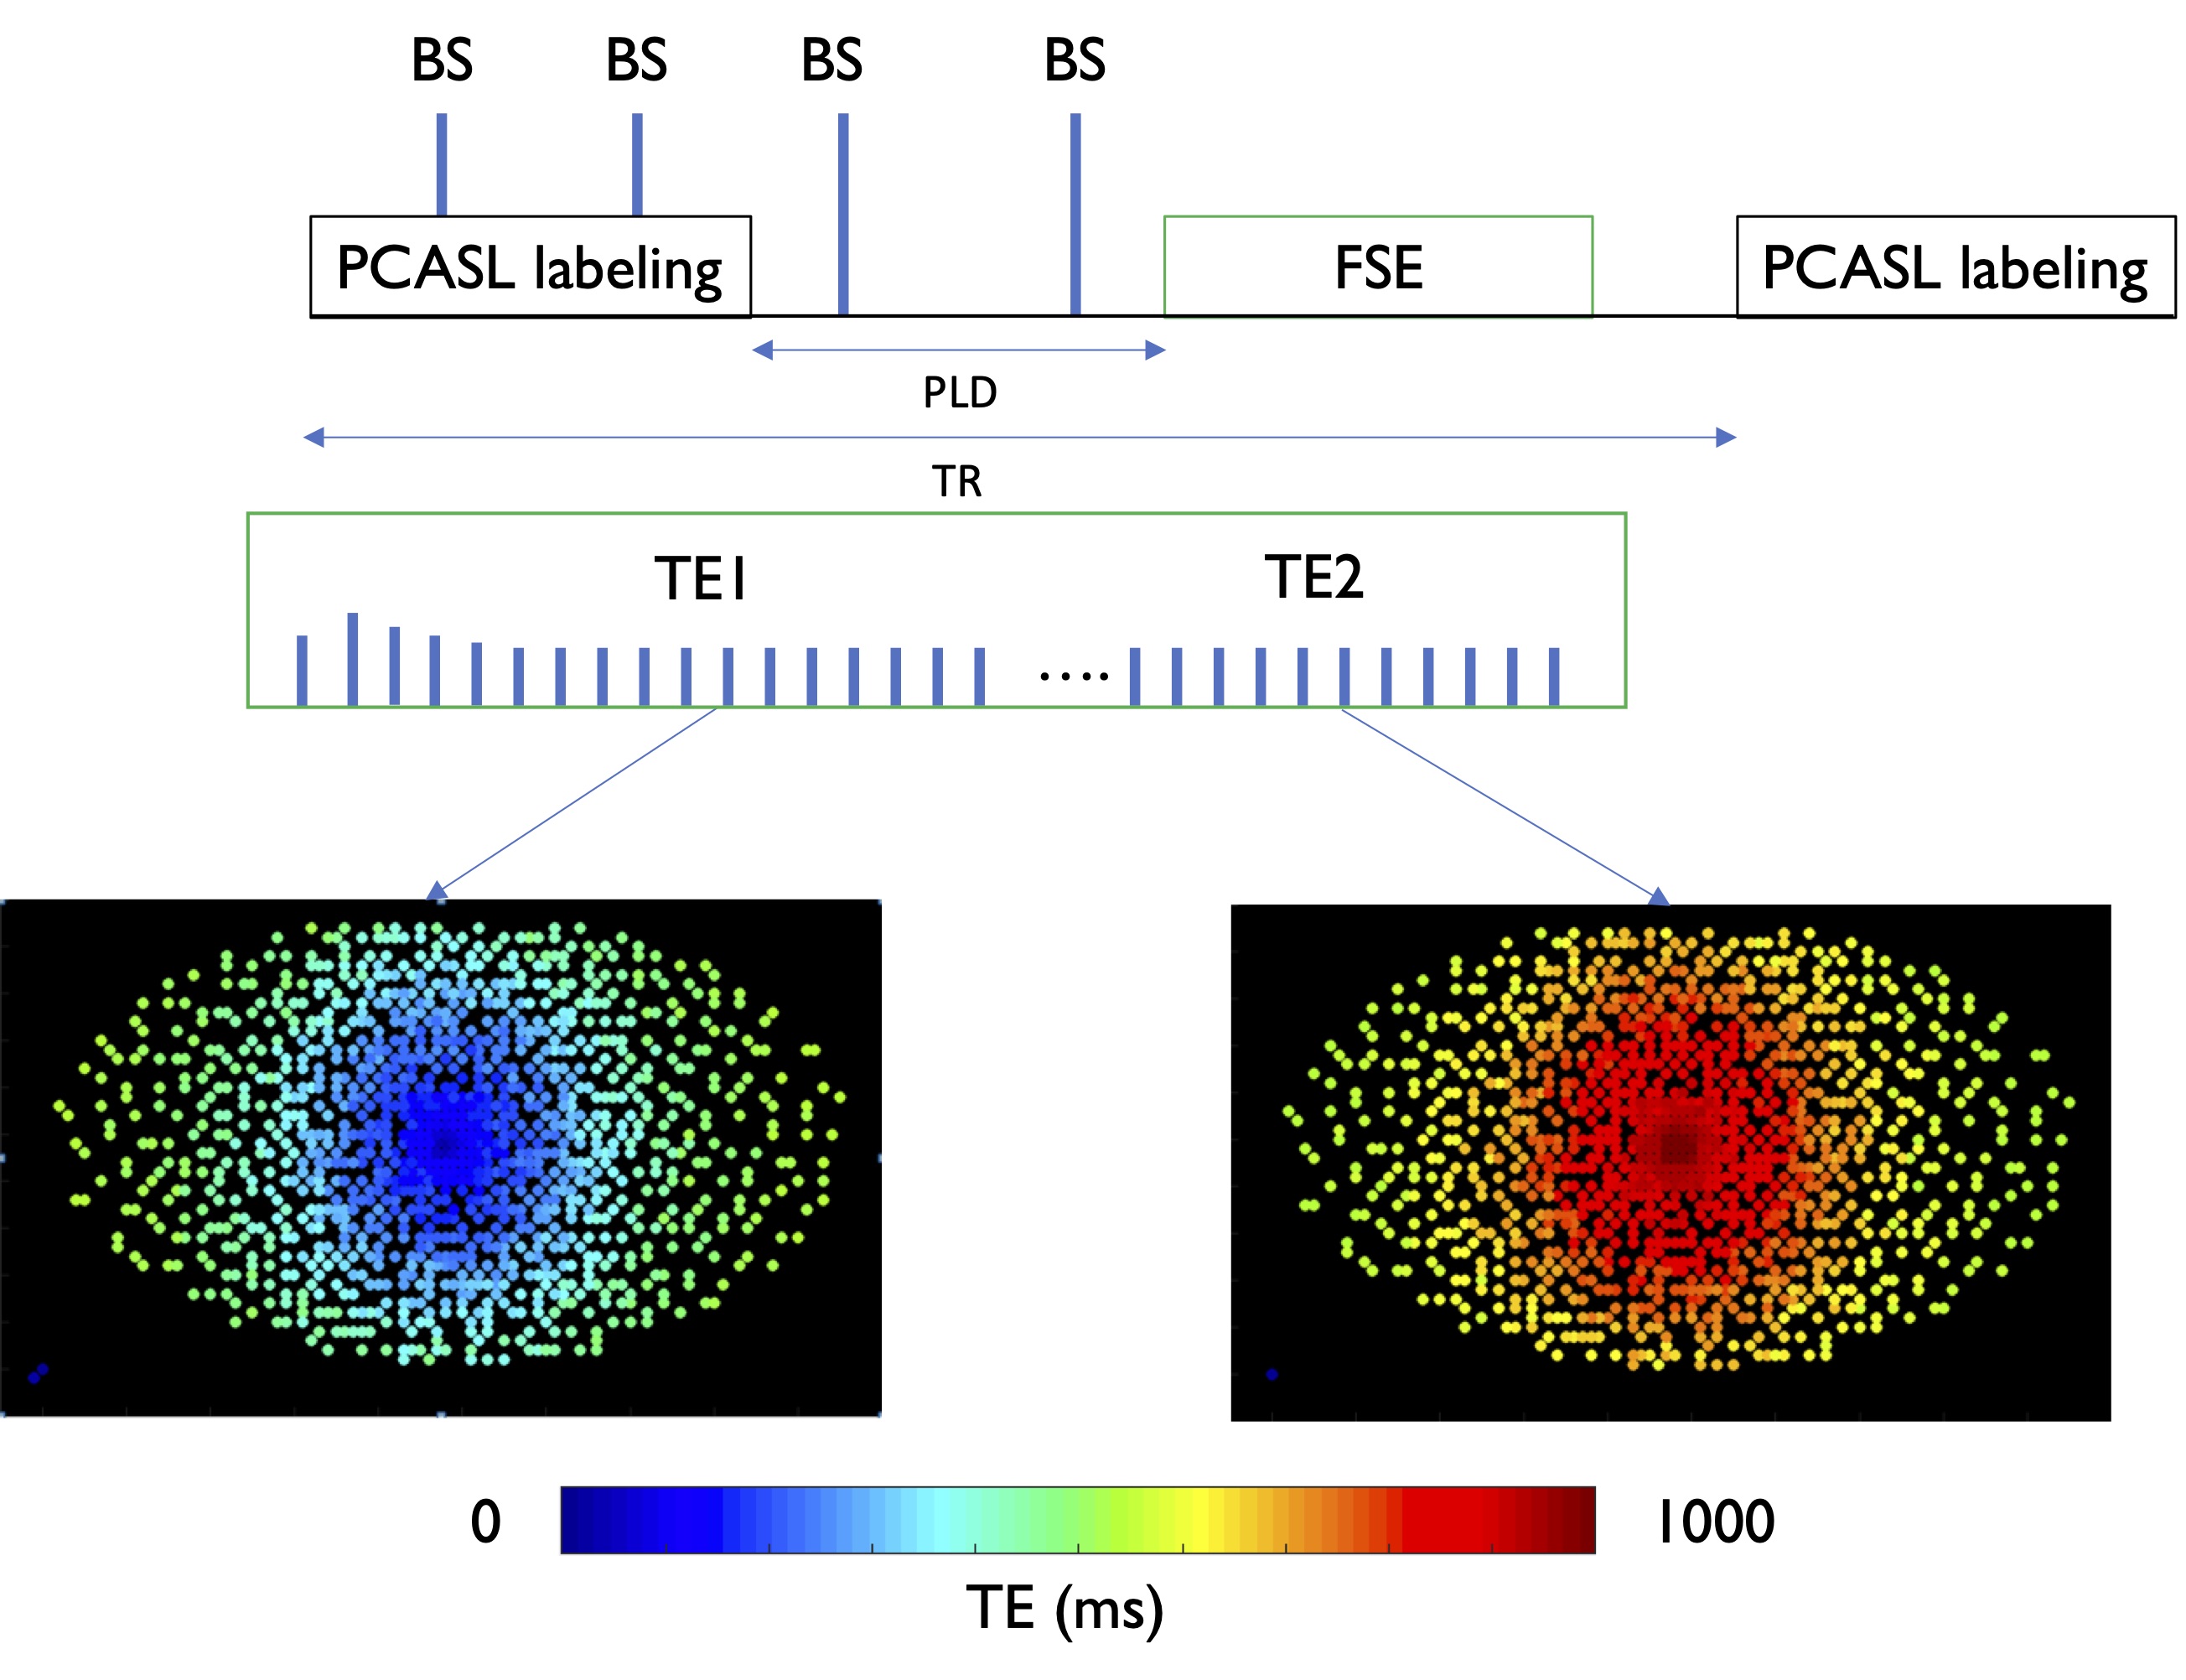
Design: We implemented a split echo-train strategy for dual TE sampling in a variable-density Poisson-disk 3D FSE sequence4,5. After a single excitation, we encode a first proton-density weighted volume (ASL-PD) with a centric-out sampling which is reversed in the same echo train starting at echo = skipped_echoes + ETL/2, effectively re-sampling the k-space center at the latest echo of the echo-train to provide the heavily T2-weighted volume (ASL-T2). This is illustrated in Figure 1.Experiments: Six healthy volunteers (44±18yo) were recruited and divided in two groups (<35yo,N=3;>55yo,N=3). Scans were performed at 3T (GE Signa Premier) using a 48-ch head coil. The dual-TE ASL sequence was acquired with VD sampling (net acceleration ≈4), 4x4 k-space center oversampling, 96x96 matrix, 48 sagittal slices for a nominal resolution of 2.8x2.8x4mm3. The total echo-train-length was 174, split between 4 discarded echoes and 85/85 echoes for the PD and T2-weighted volumes (TR=9000ms, TE1/TE2=24/1100ms), with a 10.8kHz bandwidth for a total readout time of 1100ms. We used reduced refocusing flip-angles6,7, starting at 120 ramping down to 75 degrees for reduced SAR and blurring.Specific ASL parameters were: unbalanced labeling, labeling duration/PLD = 2/2s, B1,av=1.4μT, 4 background suppression pulses. Total ASL imaging time for the 4 volumes was 10min21 (6min54 for ASL and 3min27 reference).
Reconstruction and analysis: Raw k-space data were saved for offline reconstruction. We performed an L1-wavelet Compressed-Sensing reconstruction using the BART toolbox8 of the 4 volumes (ASL-PD and T2-weighted and M0 PD and T2-weighted) after estimating coil-sensitivities using the high SNR M0 PD-weighted volume.ASL-PD and ASL-T2 were normalized by the PD-M0. All data were then normalized to a common template9 and averaged separately in two groups <35 and >55yo.
Results
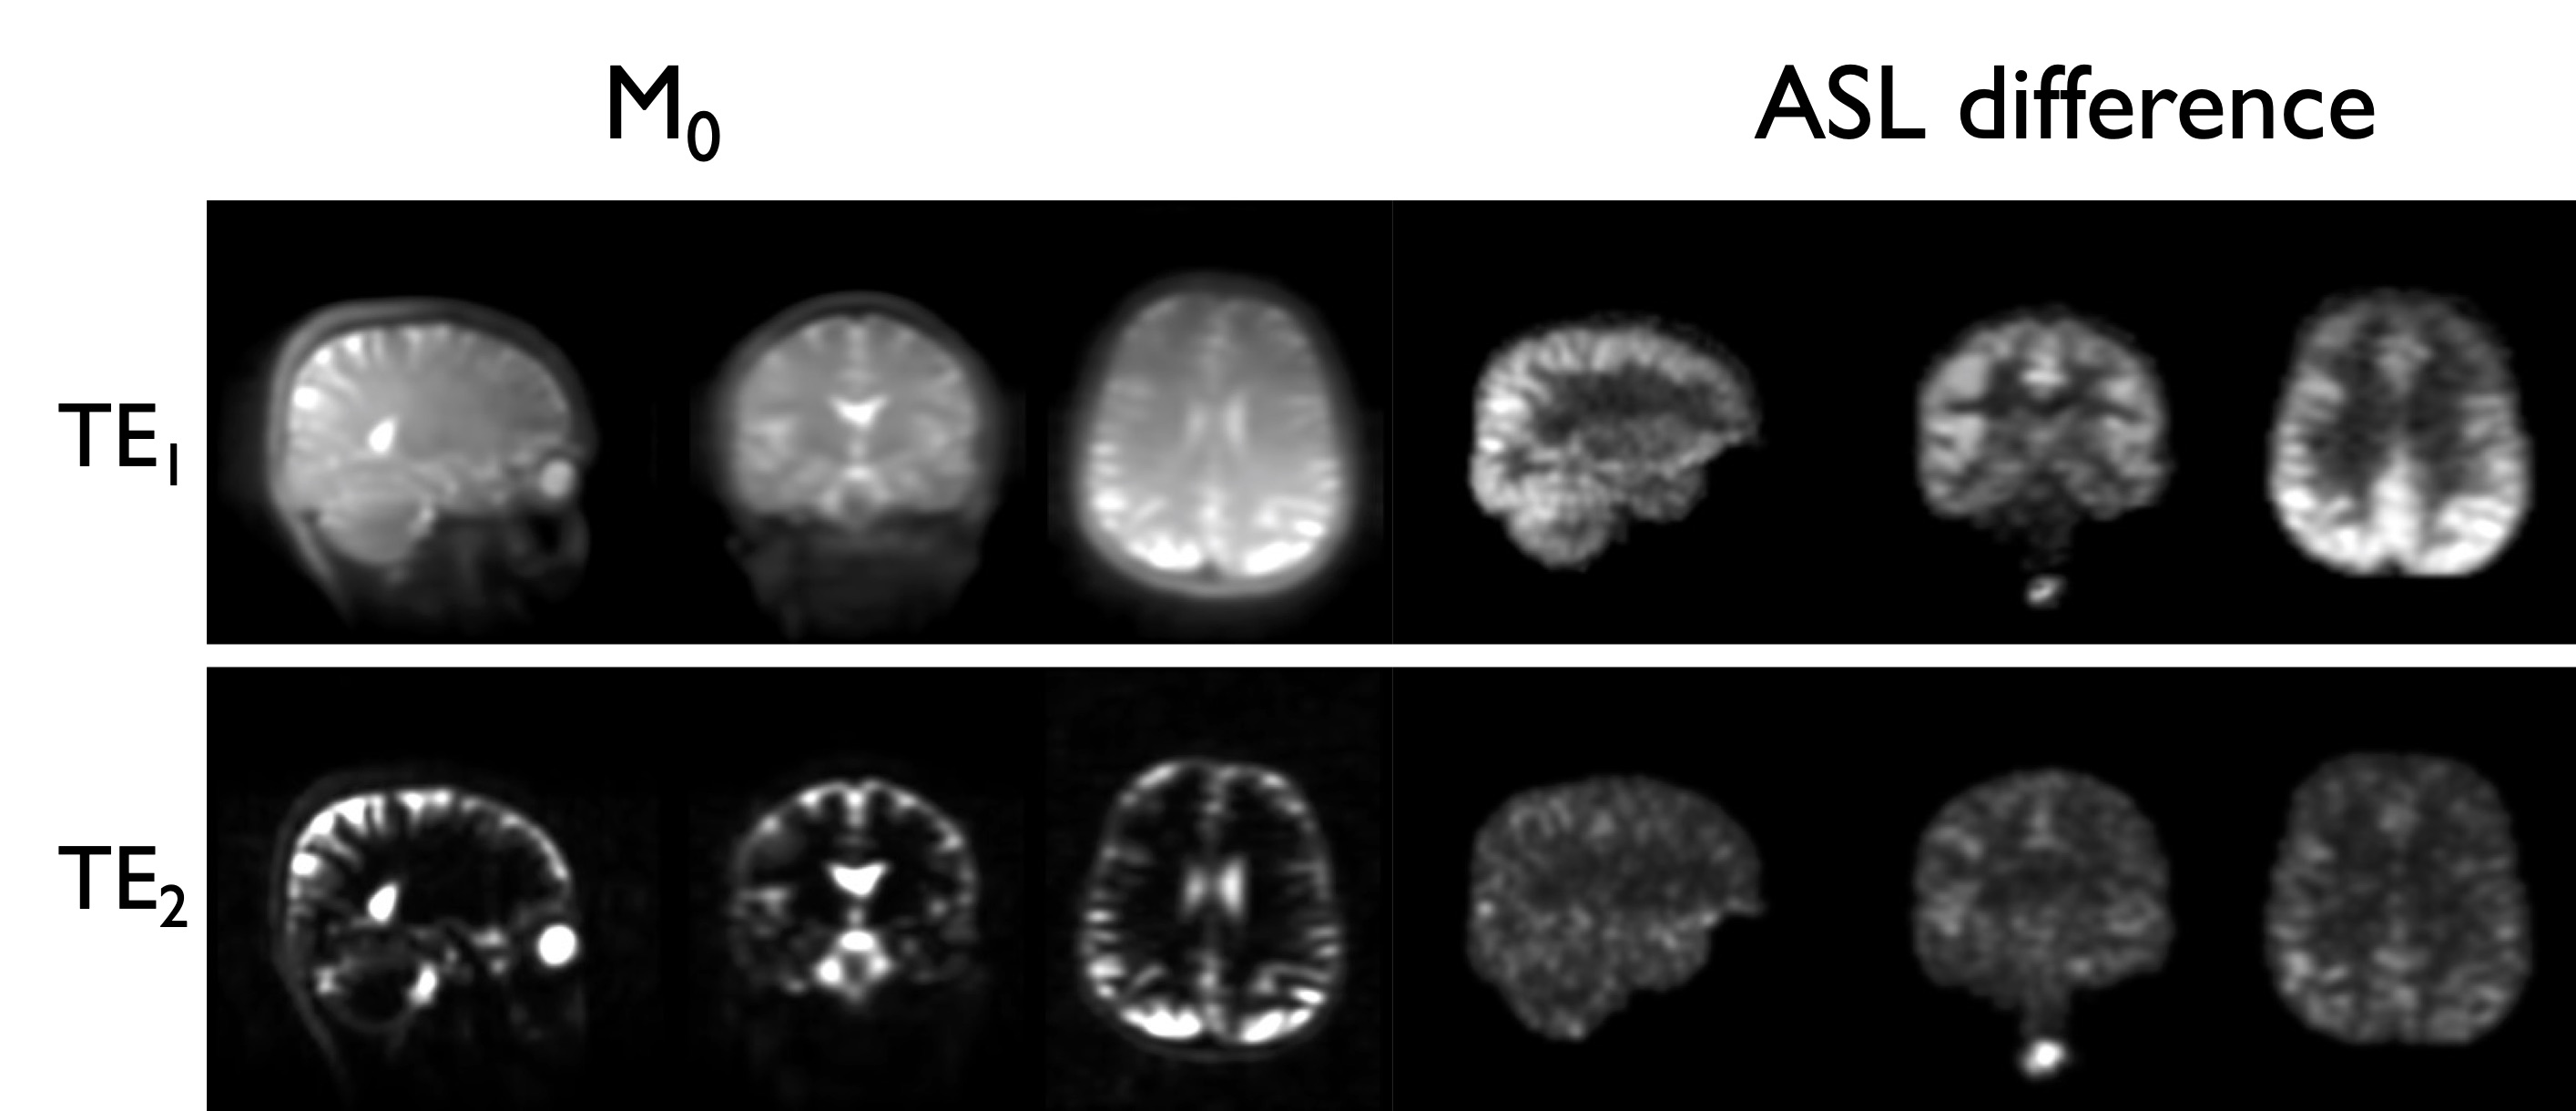
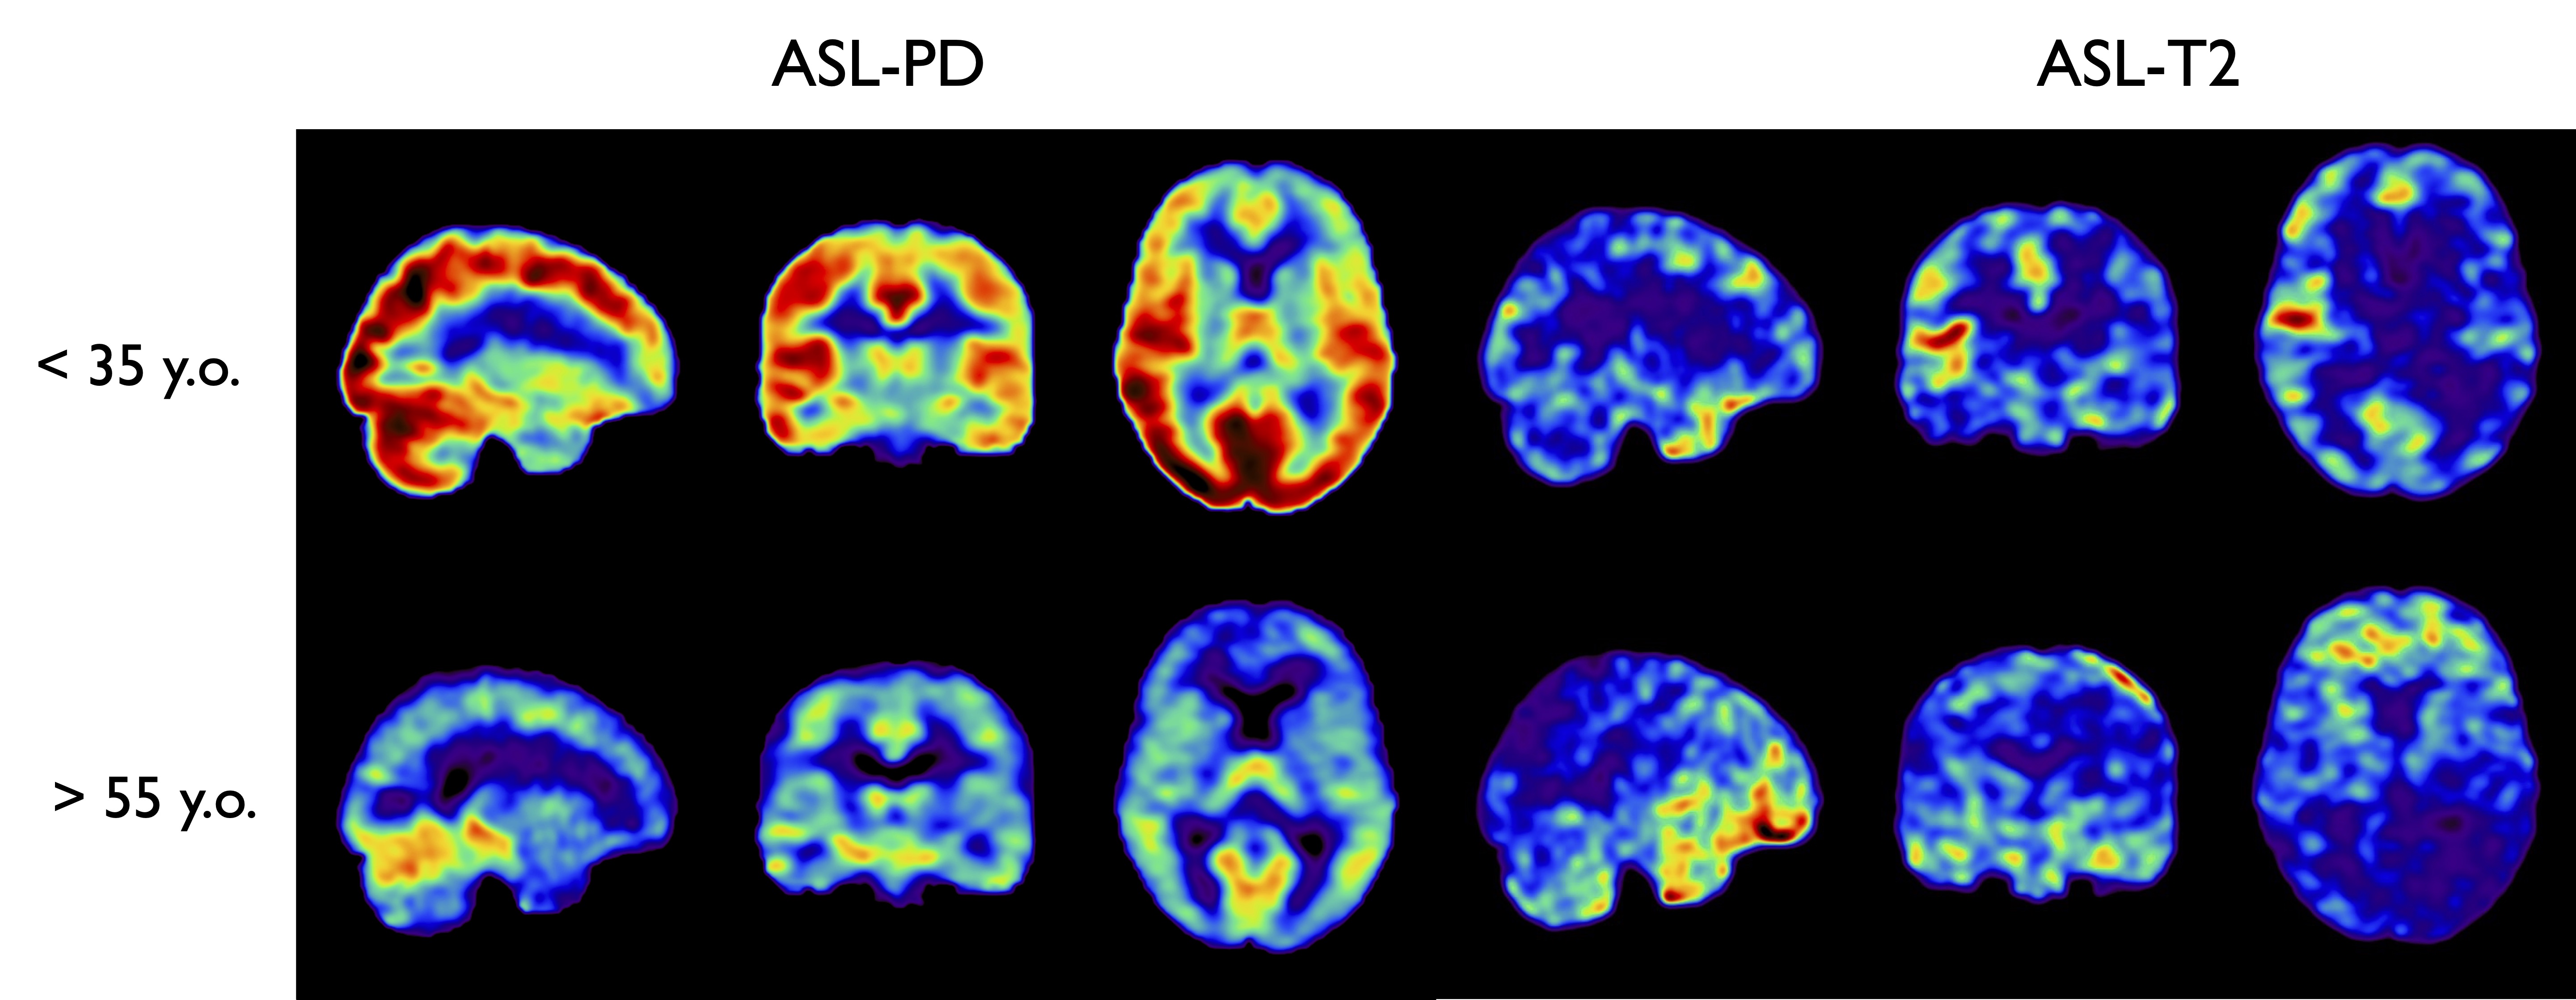
An individual representative dataset is shown in Figure 2, highlighting the suppression of tissue signal in long TE reference images, as well as highlighting the ASL signal as observed in previous work at ultra-long TE. The ASL-T2 signal amplitude is found to be ≈6-10% of the ASL-PD perfusion signal.When looking at age-specific group averages (Figure 3), we can observe a marked difference in signal distribution at long TE between our two groups, while the ASL-PD data show widespread ≈20-30% signal reduction in the >55yo group, consistent with larger earlier group10.The difference in ASL-T2 signal is visualized by a subtraction of the average normalized groups in Figure 4 highlighting areas of putative reduced blood-CSF exchange mainly in posterior temporal occipital and parietal regions while an increased signal in the >55yo group can be seen mostly in inferior frontal and temporal regions. However, because of our small sample size, formal statistical analysis was beyond the reach of this work.Discussion and Conclusions
We have shown the possibility of measuring long TE ASL signal suggestive of blood to CSF exchange as previously reported3 using a reduced flip-angle FSE sequence, with a split echo-train strategy for dual TE sampling. Interestingly, we found a substantial difference in spatial distribution of such signal when comparing two (small) different age groups, although a detailed analysis and explanation of such difference is beyond the scope of this pilot work. However, limitations and areas of improvement have to be considered, such as the possibility of transit delay effects that could influence signal differences. Additionally, from a sampling/reconstruction standpoint, view-sharing strategies and optimization of PD/T2 sampling could be performed to reduce blurring in short TE acquisitions or potentially sample extra echo-times to support multi-compartment signal models that have been previously proposed.Acknowledgements
No acknowledgement found.References
1. Zhao, L., Taso, M., Dai, W., Press, D. Z. & Alsop, D. C. Non-invasive measurement of choroid plexus apparent blood flow with arterial spin labeling. Fluids and Barriers of the CNS 17, 58 (2020).
2. Evans, P. G. et al. Non-Invasive MRI of Blood–Cerebrospinal Fluid Barrier Function. Nat Commun 11, 2081 (2020).
3. Petitclerc, L. et al. Ultra-long-TE arterial spin labeling reveals rapid and brain-wide blood-to-CSF water transport in humans. NeuroImage 245, 118755 (2021).
4. Taso, M., Zhao, L., Guidon, A., Litwiller, D. V. & Alsop, D. C. Volumetric abdominal perfusion measurement using a pseudo-randomly sampled 3D fast-spin-echo (FSE) arterial spin labeling (ASL) sequence and compressed sensing reconstruction. Magnetic Resonance in Medicine 82, 680–692 (2019).
5. Taso, M., Munsch, F., Zhao, L. & Alsop, D. C. Regional and depth-dependence of cortical blood-flow assessed with high-resolution Arterial Spin Labeling (ASL). J Cereb Blood Flow Metab 41, 1899–1911 (2021).
6. Alsop, D. C. The sensitivity of low flip angle RARE imaging. Magnetic Resonance in Medicine 37, 176–184 (1997).
7. Zhao, L., Chang, C.-D. & Alsop, D. C. Controlling T2 blurring in 3D RARE arterial spin labeling acquisition through optimal combination of variable flip angles and k-space filtering. Magnetic Resonance in Medicine 80, 1391–1401 (2018).
8. Uecker, M. et al. Berkeley Advanced Reconstruction Toolbox. in Proc. Intl. Soc. Mag. Reson. Med 2486 (2015).
9. Taso, M., Munsch, F. & Alsop, D. C. The Boston ASL Template and Simulator: Initial development and implementation. J Neuroimaging (2022) doi:10.1111/jon.13042.
10. Chen, J. J., Rosas, H. D. & Salat, D. H. Age-associated reductions in cerebral blood flow are independent from regional atrophy. NeuroImage 55, 468–478 (2011).
Figures