0368
Non-contrast assessment of blood-brain barrier permeability to water in mice: An arterial spin labeling study1Russell H. Morgan Department of Radiology and Radiological Science, Johns Hopkins University School of Medicine, Baltimore, MD, United States, 2F. M. Kirby Research Center for Functional Brain Imaging, Kennedy Krieger Research Institute, Baltimore, MD, United States, 3Department of Psychiatry and Behavioral Sciences, Johns Hopkins University School of Medicine, Baltimore, MD, United States, 4The Solomon H. Snyder Department of Neuroscience, Johns Hopkins University School of Medicine, Baltimore, MD, United States, 5Department of Biomedical Engineering, Johns Hopkins University School of Medicine, Baltimore, MD, United States
Synopsis
Keywords: Arterial spin labelling, Animals
Blood-brain barrier (BBB) plays a critical role in brain health and diseases. However, there is a scarcity of tools to assess BBB integrity, particularly in mouse models. Here, we aimed to develop a non-contrast arterial-spin-labeling-based MRI technique to estimate BBB permeability in mice by measuring relative fractions of labeled water in cerebral veins. Systematic optimizations were performed to enhance signal sensitivity with a further study investigating reproducibility. The proposed method revealed significant BBB dysfunctions in a mouse model of Huntington’s disease, which were further validated with histology. Our method may open new avenues for preclinical mechanistic research or therapeutic trails.INTRODUCTION
Blood-brain barrier (BBB), which plays important roles in blocking toxins and regulating fluid transportations, is a promising biomarker for normal aging and several neurological disorders.1-3 Dynamic contrast-enhanced (DCE) MRI is a commonly used method for evaluating BBB function.4 However, its sensitivity in studying diseases with subtle BBB damages at the early stage, e.g., Alzheimer’s disease, is limited. Alternatively, approaches based on arterial-spin-labeling (ASL) MRI have been proposed to investigate the BBB’s permeability to water5,6 and were applied in disease studies2,7. In this work, we aim to develop a non-contrast MRI technique to estimate BBB permeability to water in mice by measuring arterially labeled water in major veins, similar to the principle of water-extraction-with-phase-contrast-arterial-spin (WEPCAST)5 MRI. We optimized the sequence in terms of labeling duration and post-labeling delay. Test-retest reproducibility was characterized. An initial application of the proposed technique to a mouse model of Huntington’s disease (HD) was performed to demonstrate the utility of the proposed method in pathological conditions, which was further validated with histology.METHODS
BBB permeability can be defined as the permeability surface-area product (PS) per unit-mass tissue (Renkin-Crone model8,9):$$PS=-ln(1-E)×CBF, (1)$$
where CBF denotes cerebral blood flow (by phase-contrast [PC] MRI) and E denotes water extraction fraction (by ASL signals at vein). Analogous to WEPCAST,5 ASL signals at vein are:$${\Delta}M_{vein}(t)=2{\alpha}(1-E)M_{0,blood}e^{-\frac{BAT_{vein}}{T_{1b}}}c(t), (2) $$ where α denotes inversion efficiency, M0,blood the blood equilibrium magnetization (by M0 scan at long TR), BATvein the bolus arrival time of vein, T1b the blood T1, and c(t) the arterial input function (a step function convolved with a Gaussian function to account for bolus dispersion). Therefore, a complete PS measurement requires a PC MRI scan and a venous-ASL scan.
All experiments were approved by local IACUC. A total of 41 mice (17 female 24 male; age: 14-44 weeks; body weight: 21-40g) were included in four sub-studies.
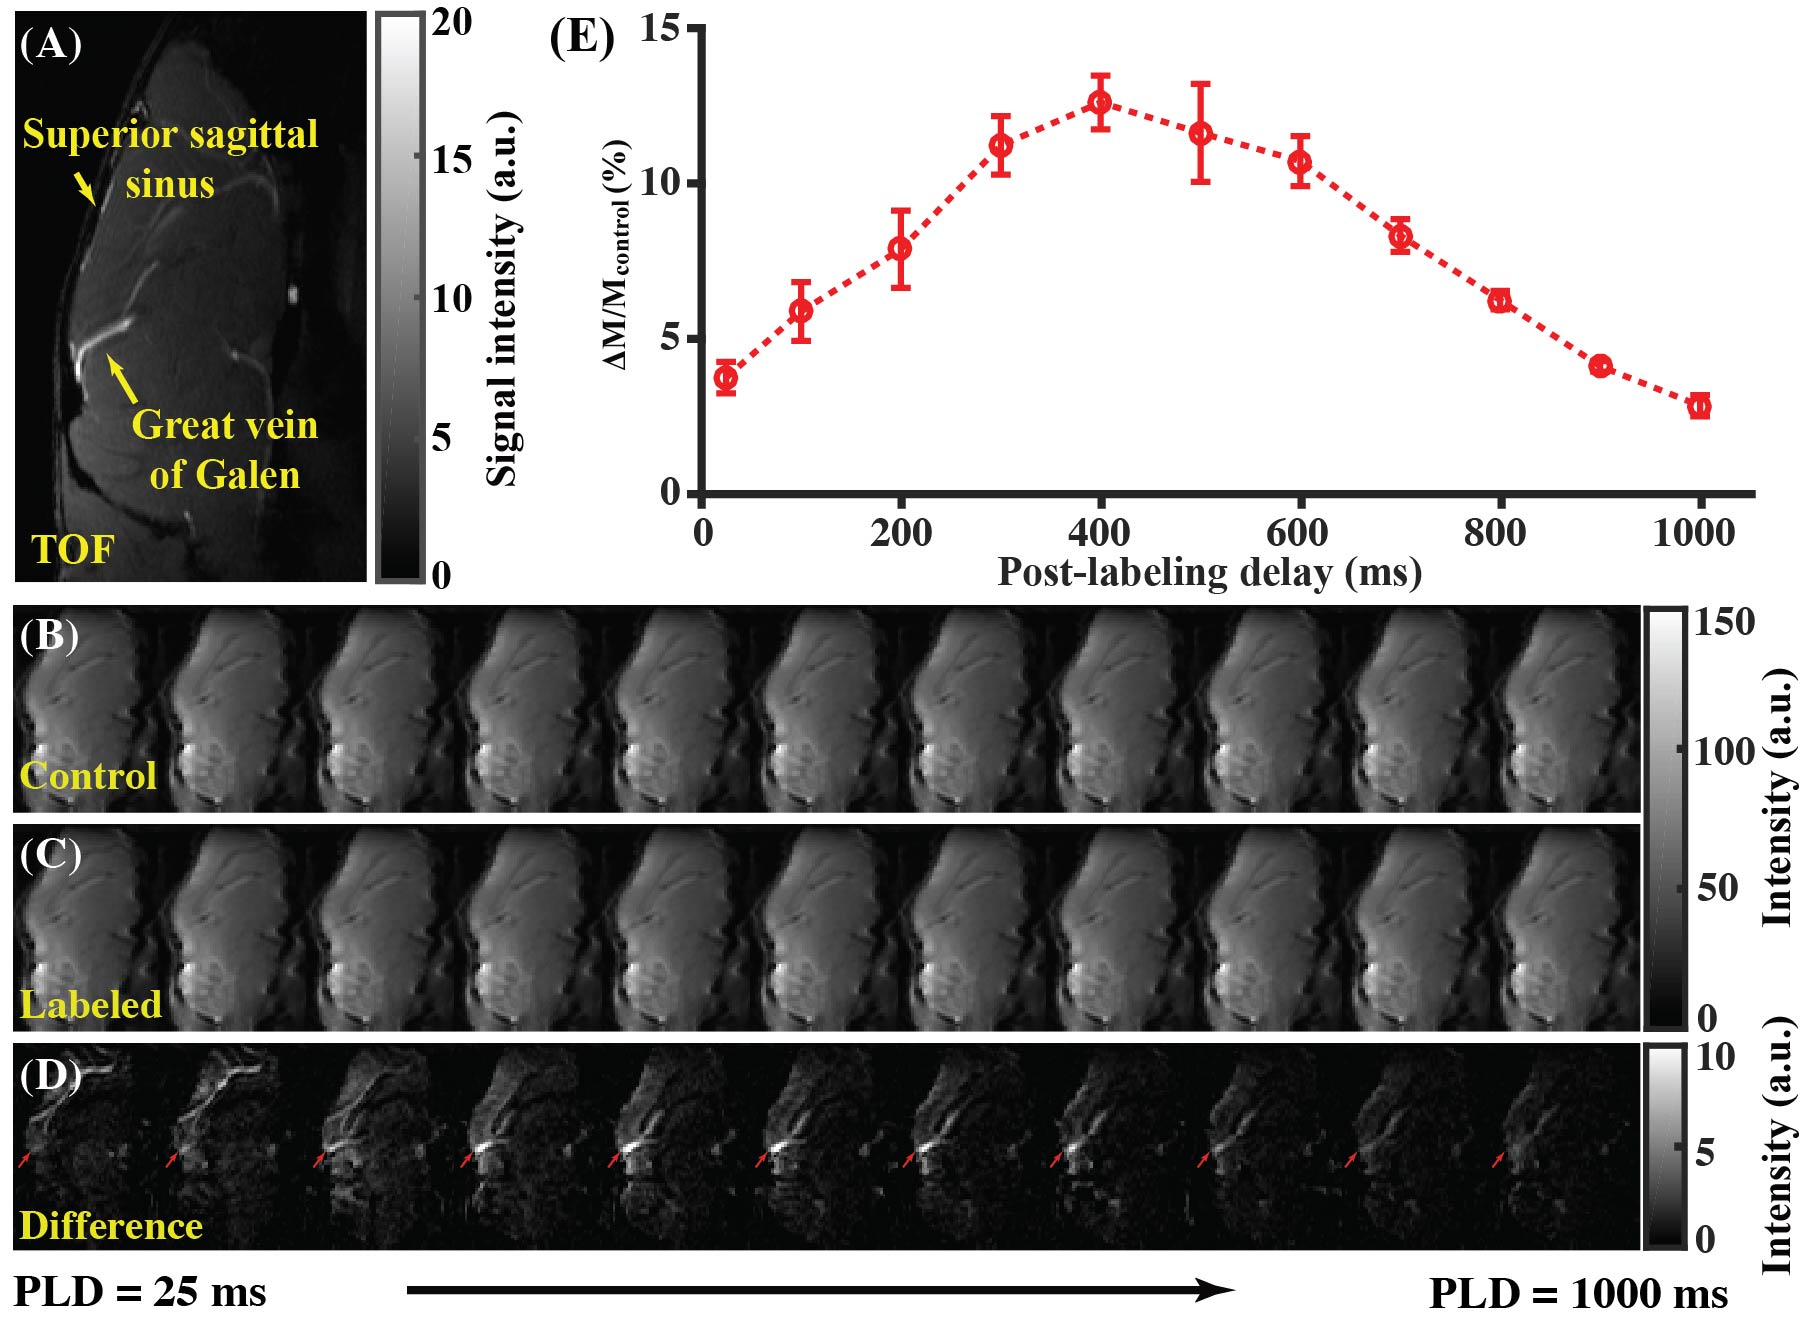
Study 1: Estimation of BATvein in mice (N=5). Eq. (2) requires the knowledge of BATvein, which has not been elucidated before. Therefore, Study 1 aims to measure BATvein. ASL (sagittal slice covering brain midline) was performed with a short labeling duration (500ms) and multiple post-labeling delays (PLDs) (25,100,200,300,400,500,600,700,800,900,1000 ms) to estimate BATvein. Other parameters followed previous reports.10,11
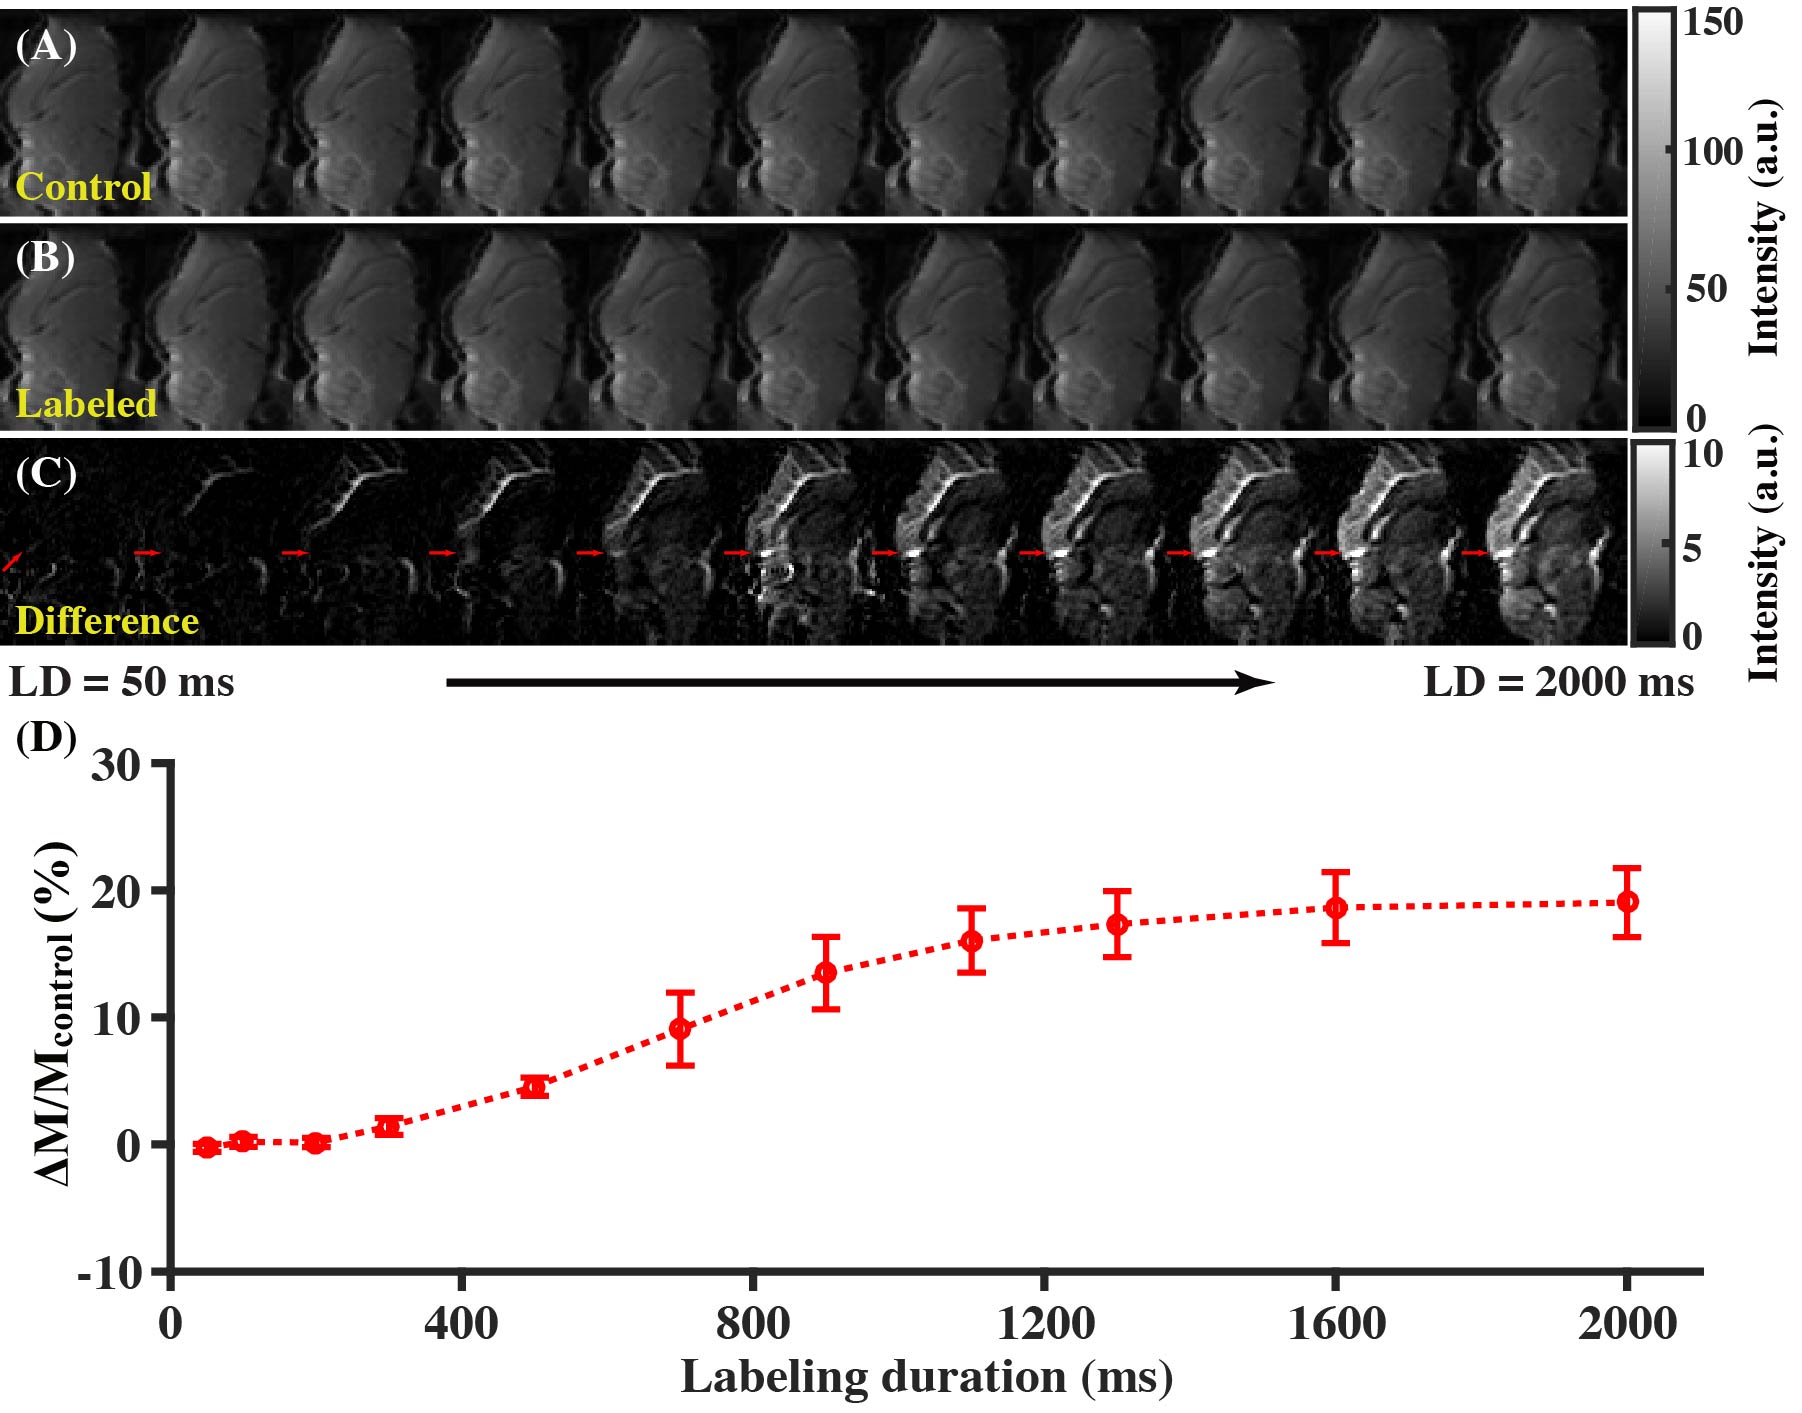
Study 2: Optimization of labeling duration (LD) (N=5). ASL was performed with a fixed PLD=25ms and 11 LDs (50,100,200,300,500,700,900,1100,1300,1600,2000 ms) to examine the dependence of ΔMvein on LDs.
Study 3: Assessment of BBB permeability in wild-type (WT) mice (N=5). ASL (optimized parameters from Studies 1&2 used) and PC MRI were repeated by three times to test the reproducibility of measurements.
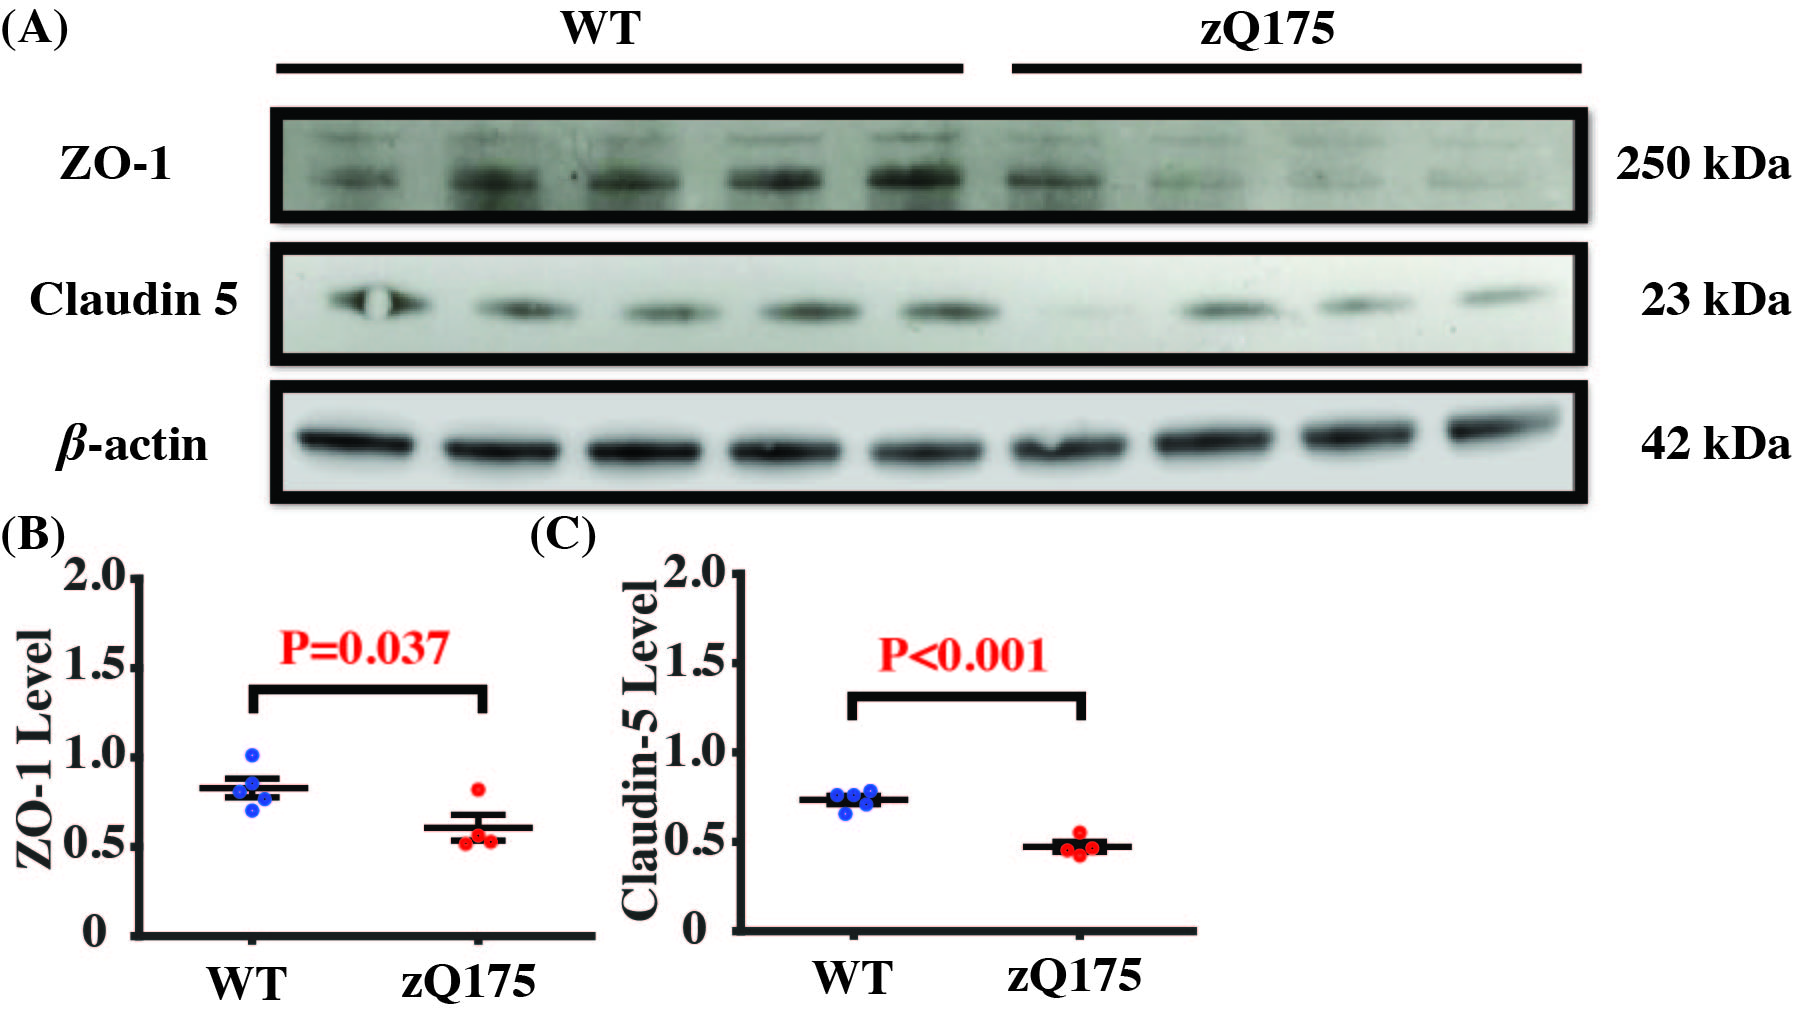
Study 4: BBB permeability in a mouse model of HD (N=26). 17 mice (20-24 weeks; 9 zQ175 HD and 8 WT) were included in MRI sessions to test the sensitivity of our method in detecting BBB dysfunction induced by disease pathology. Another 9 age-matched mice (4 zQ175 and 5 WT) were included for Western blotting analyses focusing on two types of tight-junction proteins (ZO-1 and Claudin-5), which were critical components of the BBB structure.
Linear mixed-effect (LME) model and Student's t-test were used for statistical analyses (significance level at P<0.05).
RESULTS AND DISCUSSION
Study 1: Great vein of Galen (VG) was larger than the superior sagittal sinus (used in human WEPCAST5) and therefore was vein of interest in mice (Fig. 1A). Figures 1B-1D present the control, labeled, and difference ASL images with PLDs. By fitting VG signals at different PLDs (Fig. 1E) into Eq. (2), it was estimated that BATvein=691.2±14.5 ms.Study 2: Figures 2A-2C show the control, labeled, and difference ASL images as functions of LDs. A progressive buildup of ASL signals can be noticed at the VG (Fig. 2C). Fitting of VG signals at different LDs (Fig. 2D) led to the estimation that LD=1200 ms with PLD=100ms provides a trade-off among sensitivity, scan duration, and specific absorption rate.
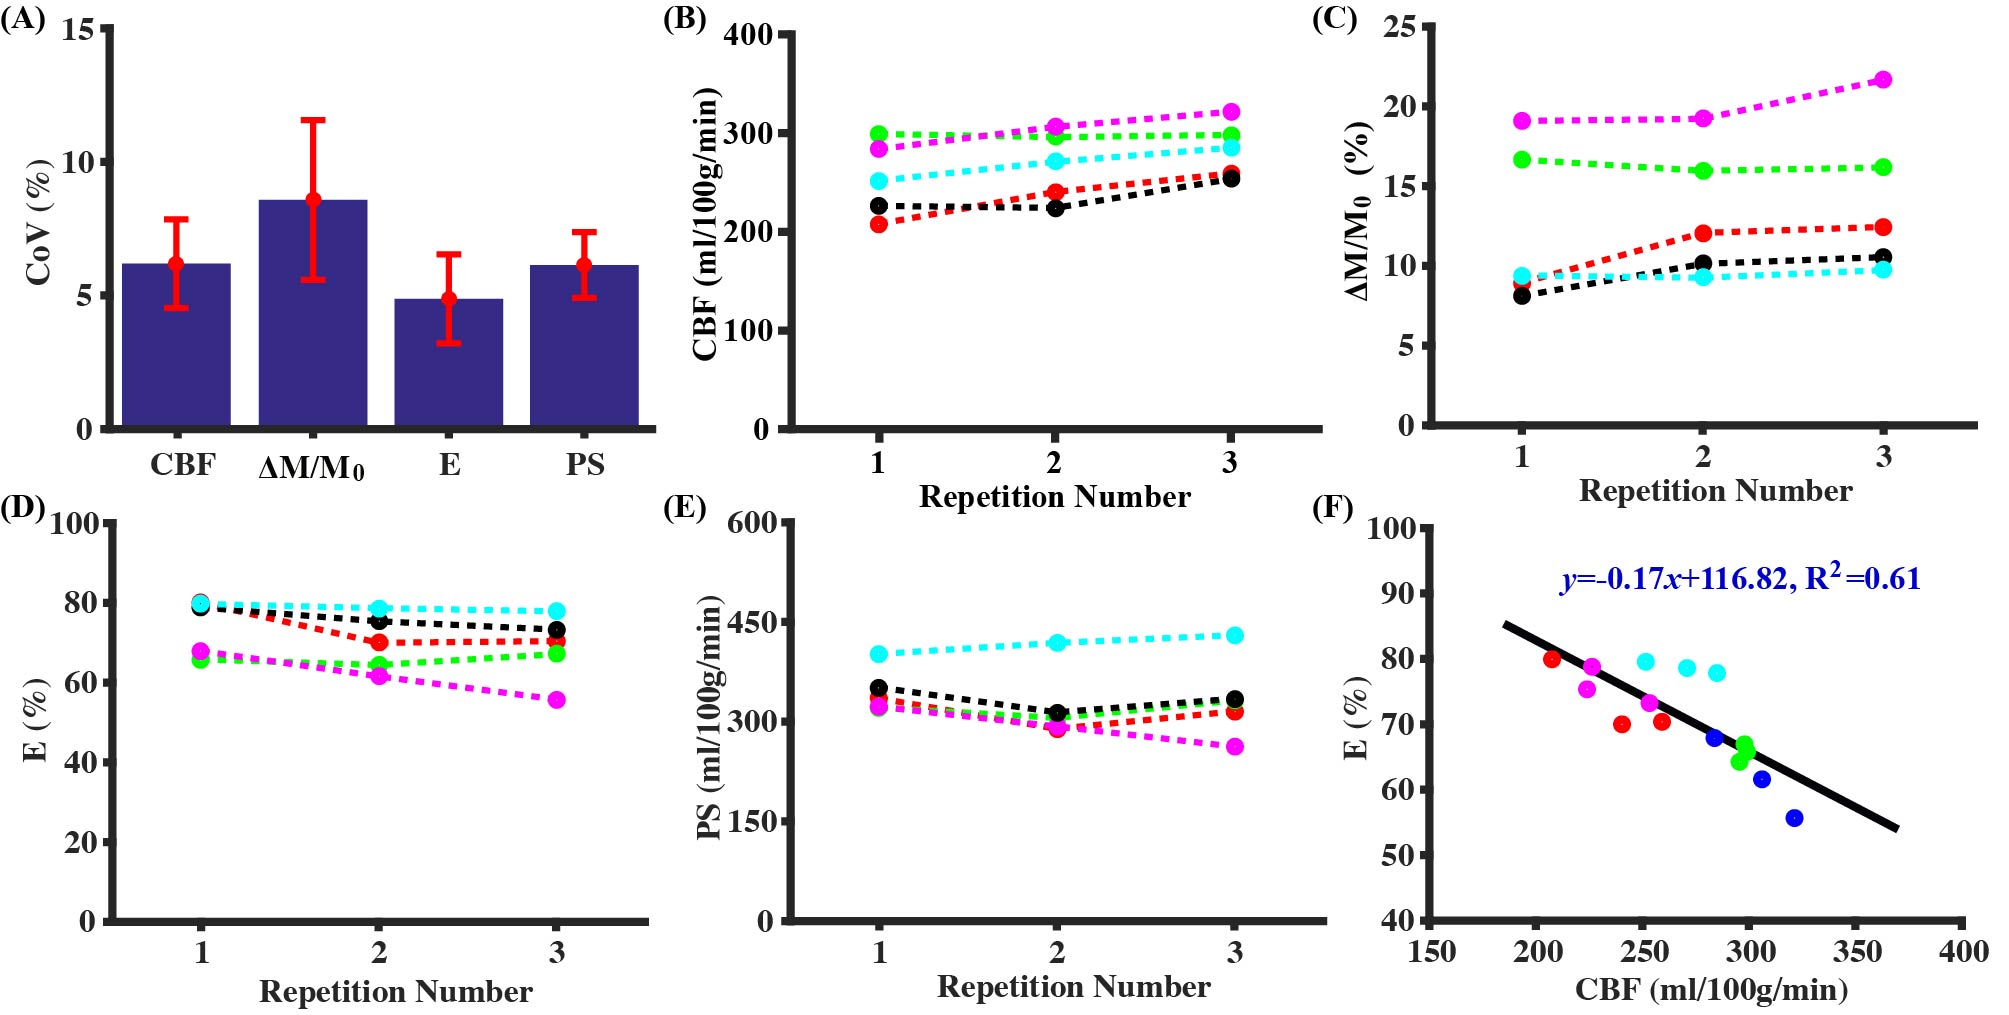
Study 3: Figure 3 summarizes the test-retest reproducibility results. The BBB permeability index, PS, has a CoV of 6.1±1.2%, suggesting excellent reliability. We also observed a significant increases in CBF (Fig. 3B; P=0.0004) and ΔM/M0 signal (Fig. 3C; P=0.012), a significant decrease in E (Fig. 3D; P=0.009), but no significant change in PS (Fig. 3E; P=0.38), which we attributed to accumulation effect of anesthesia. There was a significant negative correlation between CBF and E (Fig. 3F, y=-0.17x+116.82, R2=0.61, P=0.0006), suggesting that the variations in CBF and E have a physiological origin.
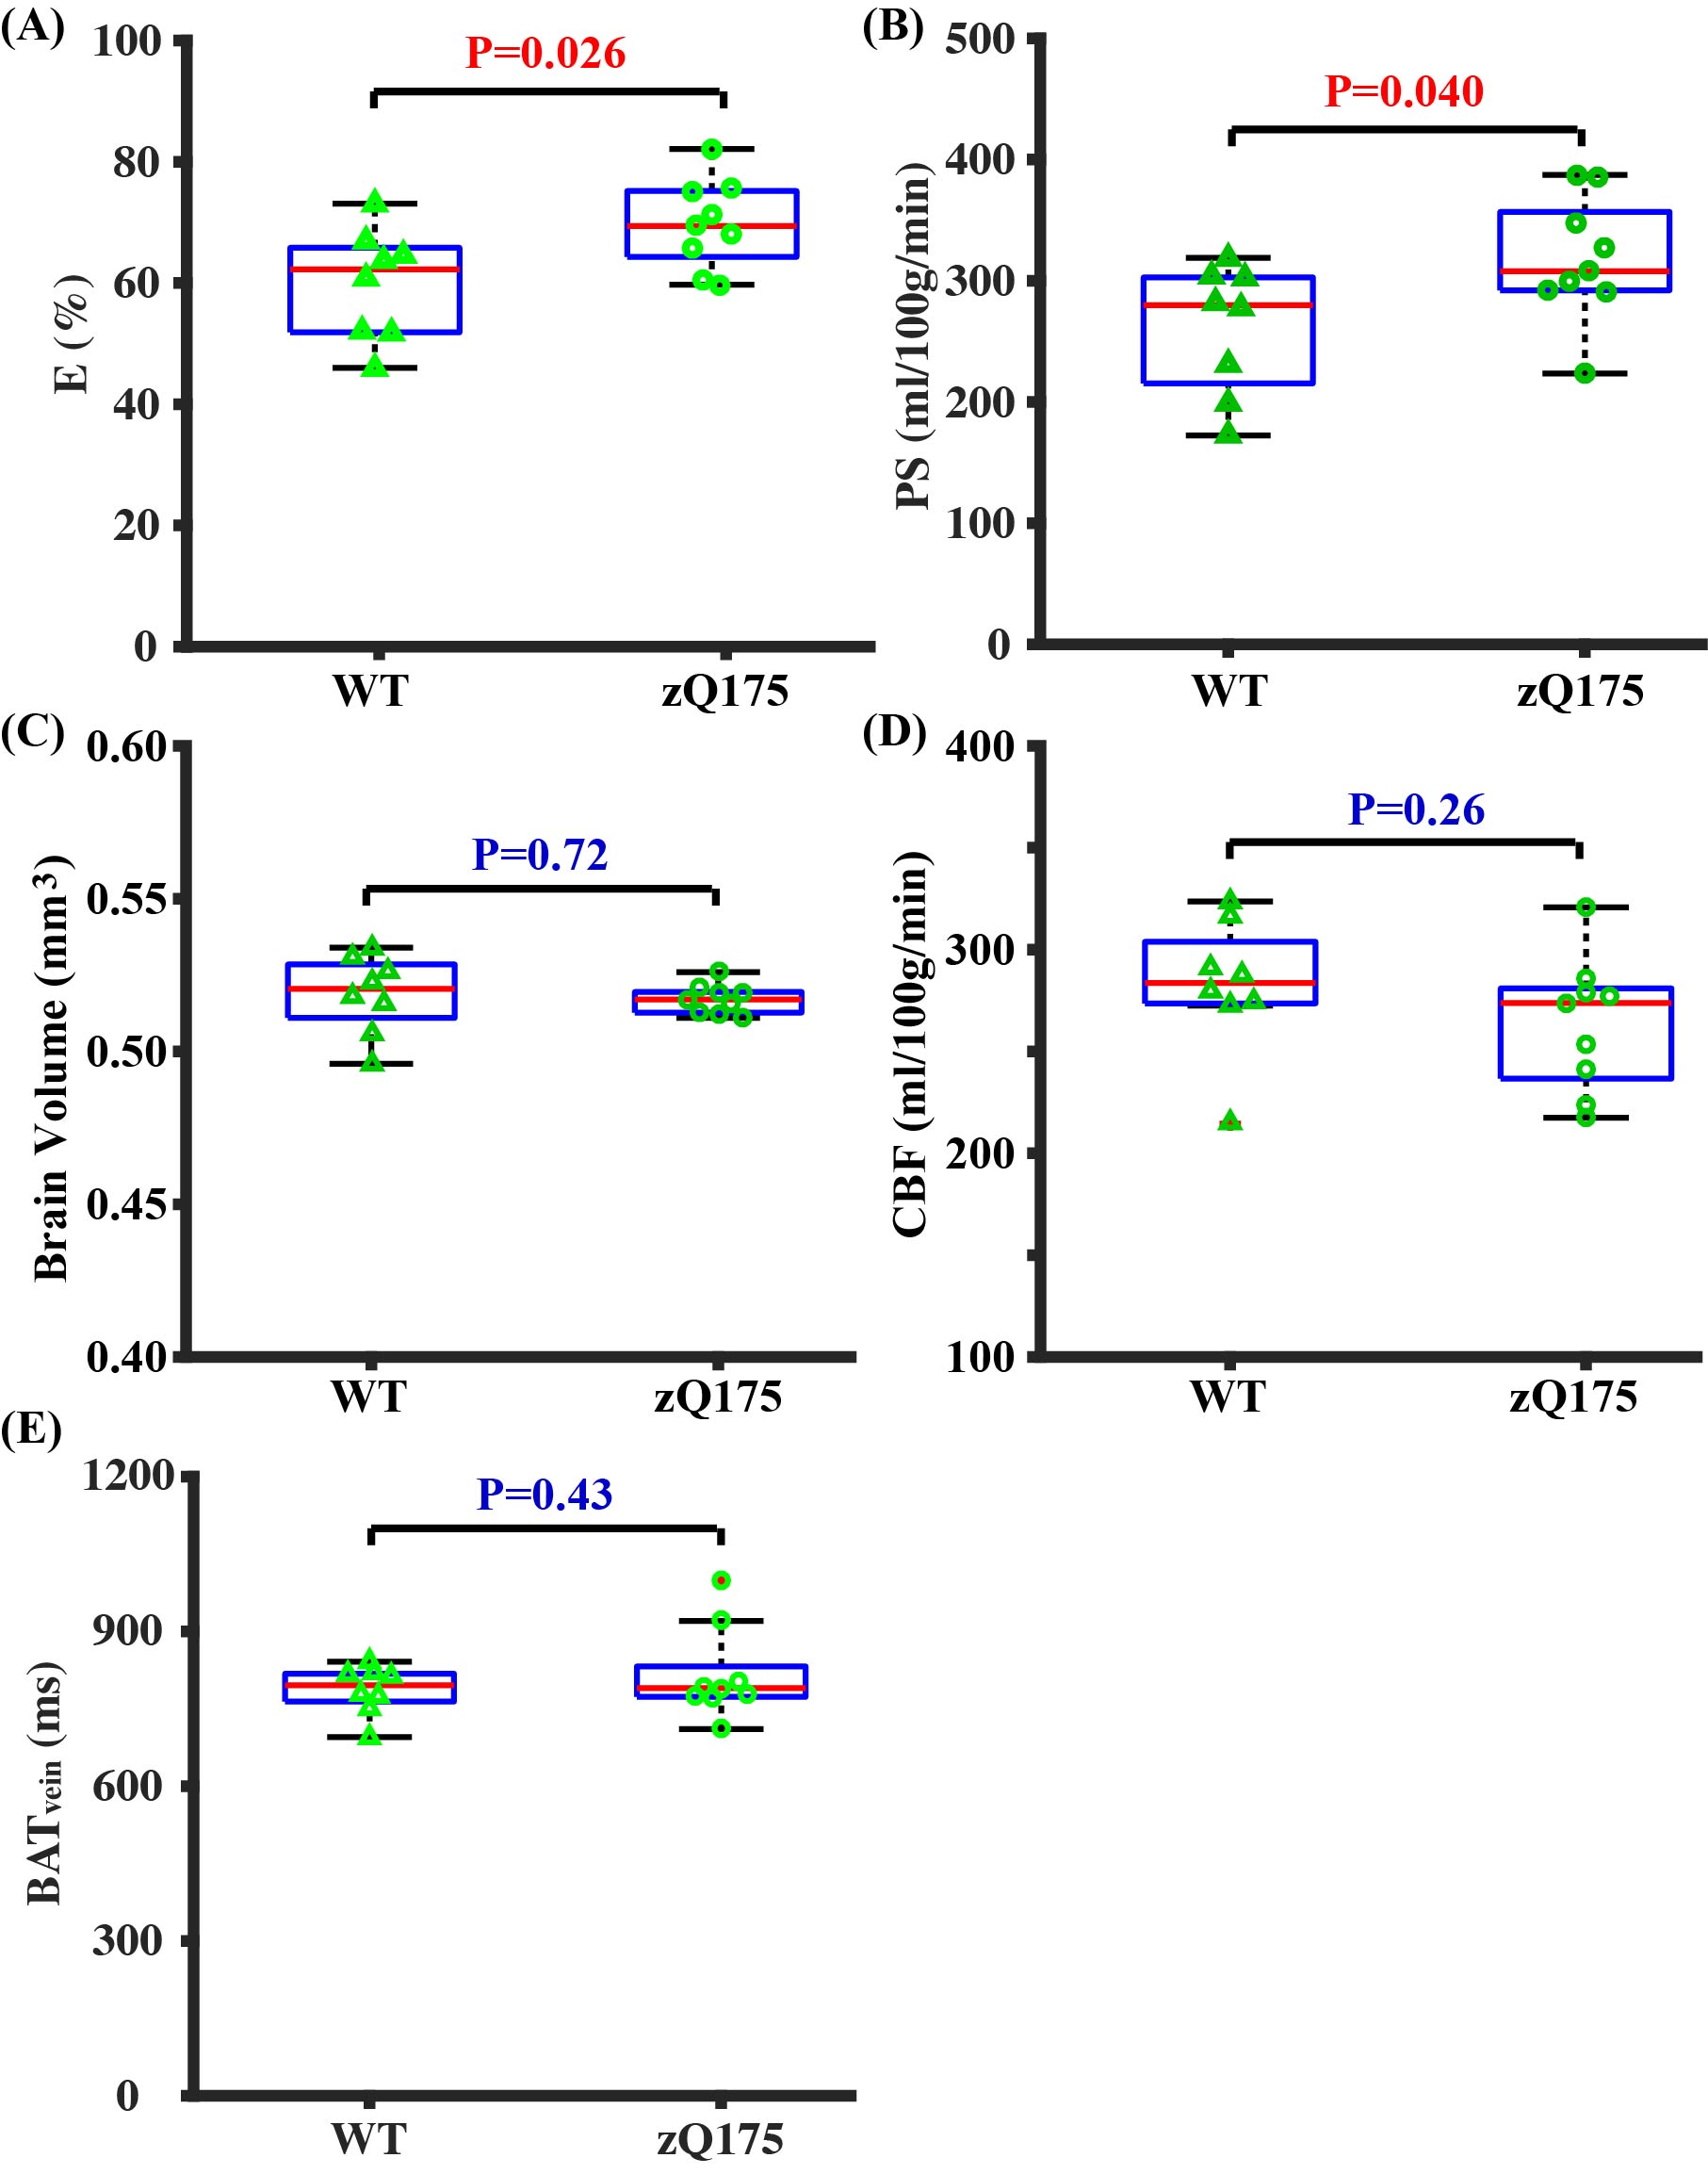
Study 4: HD mice showed a higher E (69.7±2.4%, Fig. 4A, P=0.026) and PS (318.1±17.1 ml/100g/min, Fig. 4B, P=0.040) when compared to WT mice (E=59.9±3.2%, PS=260.9±18.9 ml/100g/min), suggesting a higher BBB permeability. There were no significant differences in brain volume (Fig. 4C, P=0.72), baseline CBF (Fig. 4D, P=0.26), and BATvein (Fig. 4E, P=0.43). There were significant differences in ZO-1 (Fig. 5B, P=0.037) and Claudin 5 (Fig. 5C, P<0.001). The reduced ZO-1 and Claudin-5 in HD mice showed agreement with the increased E and PS, supporting the BBB-related measurements with non-invasive imaging.
CONCLUSION
We developed a quantitative MRI method for measuring BBB permeability in mice. Initial application in the mouse model of Huntington's disease supports the sensitivity of this technique in detecting subtle BBB breakdown.Acknowledgements
Z Wei and H Liu contributed equally to this work.References
1. Banks WA, Reed MJ, Logsdon AF et al. Healthy aging and the blood-brain barrier. Nat Aging 2021; 1(3): 243-254.
2. Lin Z, Sur S, Liu P et al. Blood-brain barrier breakdown in relationship to Alzheimer and vascular disease. Ann Neurol 2021; 90(2): 227-238.
3. Drouin-Ouellet J, Sawiak SJ, Cisbani G et al. Cerebrovascular and blood-brain barrier impairments in Huntington's disease: Potential implications for its pathophysiology. Ann Neurol 2015; 78(2): 160-77.
4. Montagne A, Toga AW, Zlokovic BV. Blood-Brain Barrier Permeability and Gadolinium: Benefits and Potential Pitfalls in Research. JAMA Neurol 2016; 73(1): 13-4.
5. Lin Z, Li Y, Su P et al. Non‐contrast MR imaging of blood‐brain barrier permeability to water. Magn Reson Med 2018; 80(4): 1507-1520.
6. Dickie BR, Parker GJM, Parkes LM. Measuring water exchange across the blood-brain barrier using MRI. Prog Nucl Magn Reson Spectrosc 2020; 116: 19-39.
7. Lin Z, Lance E, McIntyre T et al. Imaging Blood-Brain Barrier Permeability Through MRI in Pediatric Sickle Cell Disease: A Feasibility Study. J Magn Reson Imaging 2022; 55(5): 1551-1558.
8. Renkin EM. Transport of potassium-42 from blood to tissue in isolated mammalian skeletal muscles. Am J Physiol 1959; 197: 1205-10.
9. Crone C. The permeability of capillaries in various organs as determined by use of the 'indicator diffusion' method. Acta Physiol Scand 1963; 58: 292-305.
10. Wei Z, Li Y, Hou X et al. Quantitative cerebrovascular reactivity MRI in mice using acetazolamide challenge. Magn Reson Med 2022; 88: 2233–2241.
11. Wei Z, Xu J, Chen L et al. Brain metabolism in tau and amyloid mouse models of Alzheimer's disease: An MRI study. NMR Biomed 2021; 34(9): e4568.
Figures