0362
Effects of myelin structures on R2 values in the aged rat corpus callosum1Ulsan National Institute of Science and Technology, Ulsan, Korea, Republic of
Synopsis
Keywords: Data Analysis, Relaxometry, Myelin, Magnetic field perturbation
In this study, the effects of myelin structures such as myelin volume fraction (MVF) and myelin sheath thickness (MST) were investigated by measuring the intra/extracellular water signals in post-mortem aging rat brains. R2 values calculated by intra/extracellular water signals obtained using Carr-Purcell-Meiboom-Gill (CPMG) sequence are theoretically verified by comparison with transmission electron microscopy (TEM) and simulation results. It was confirmed that MVF affects the increase of R2 and MST affects the decrease of R2, and the analysis of R2 through this relationship was statistically significant. These results suggest that effects of myelin structures may affect CPMG-based intra/extracellular water signals.Introduction
Myelin water imaging (MWI), known as a representative technique in the myelin MRI field, evaluates myelin content by capturing the signal of water within the myelin based on a multi-echo technique : Carr-Purcell-Meiboom-Gill (CPMG) sequence.1–4 However, it is difficult to detect myelin water signal because it is treated as a short-T2 component (10–40 ms in human).5 In addition, studies analyzing the influence of myelin structures such as myelin volume fraction (MVF) and myelin sheath thickness (MST) via intra/extracellular water signals has rarely been investigated. Therefore, the main objective is to analyze the effects of structural information of myelin on the intra/extracellular water signals of the CPMG sequence.Methods
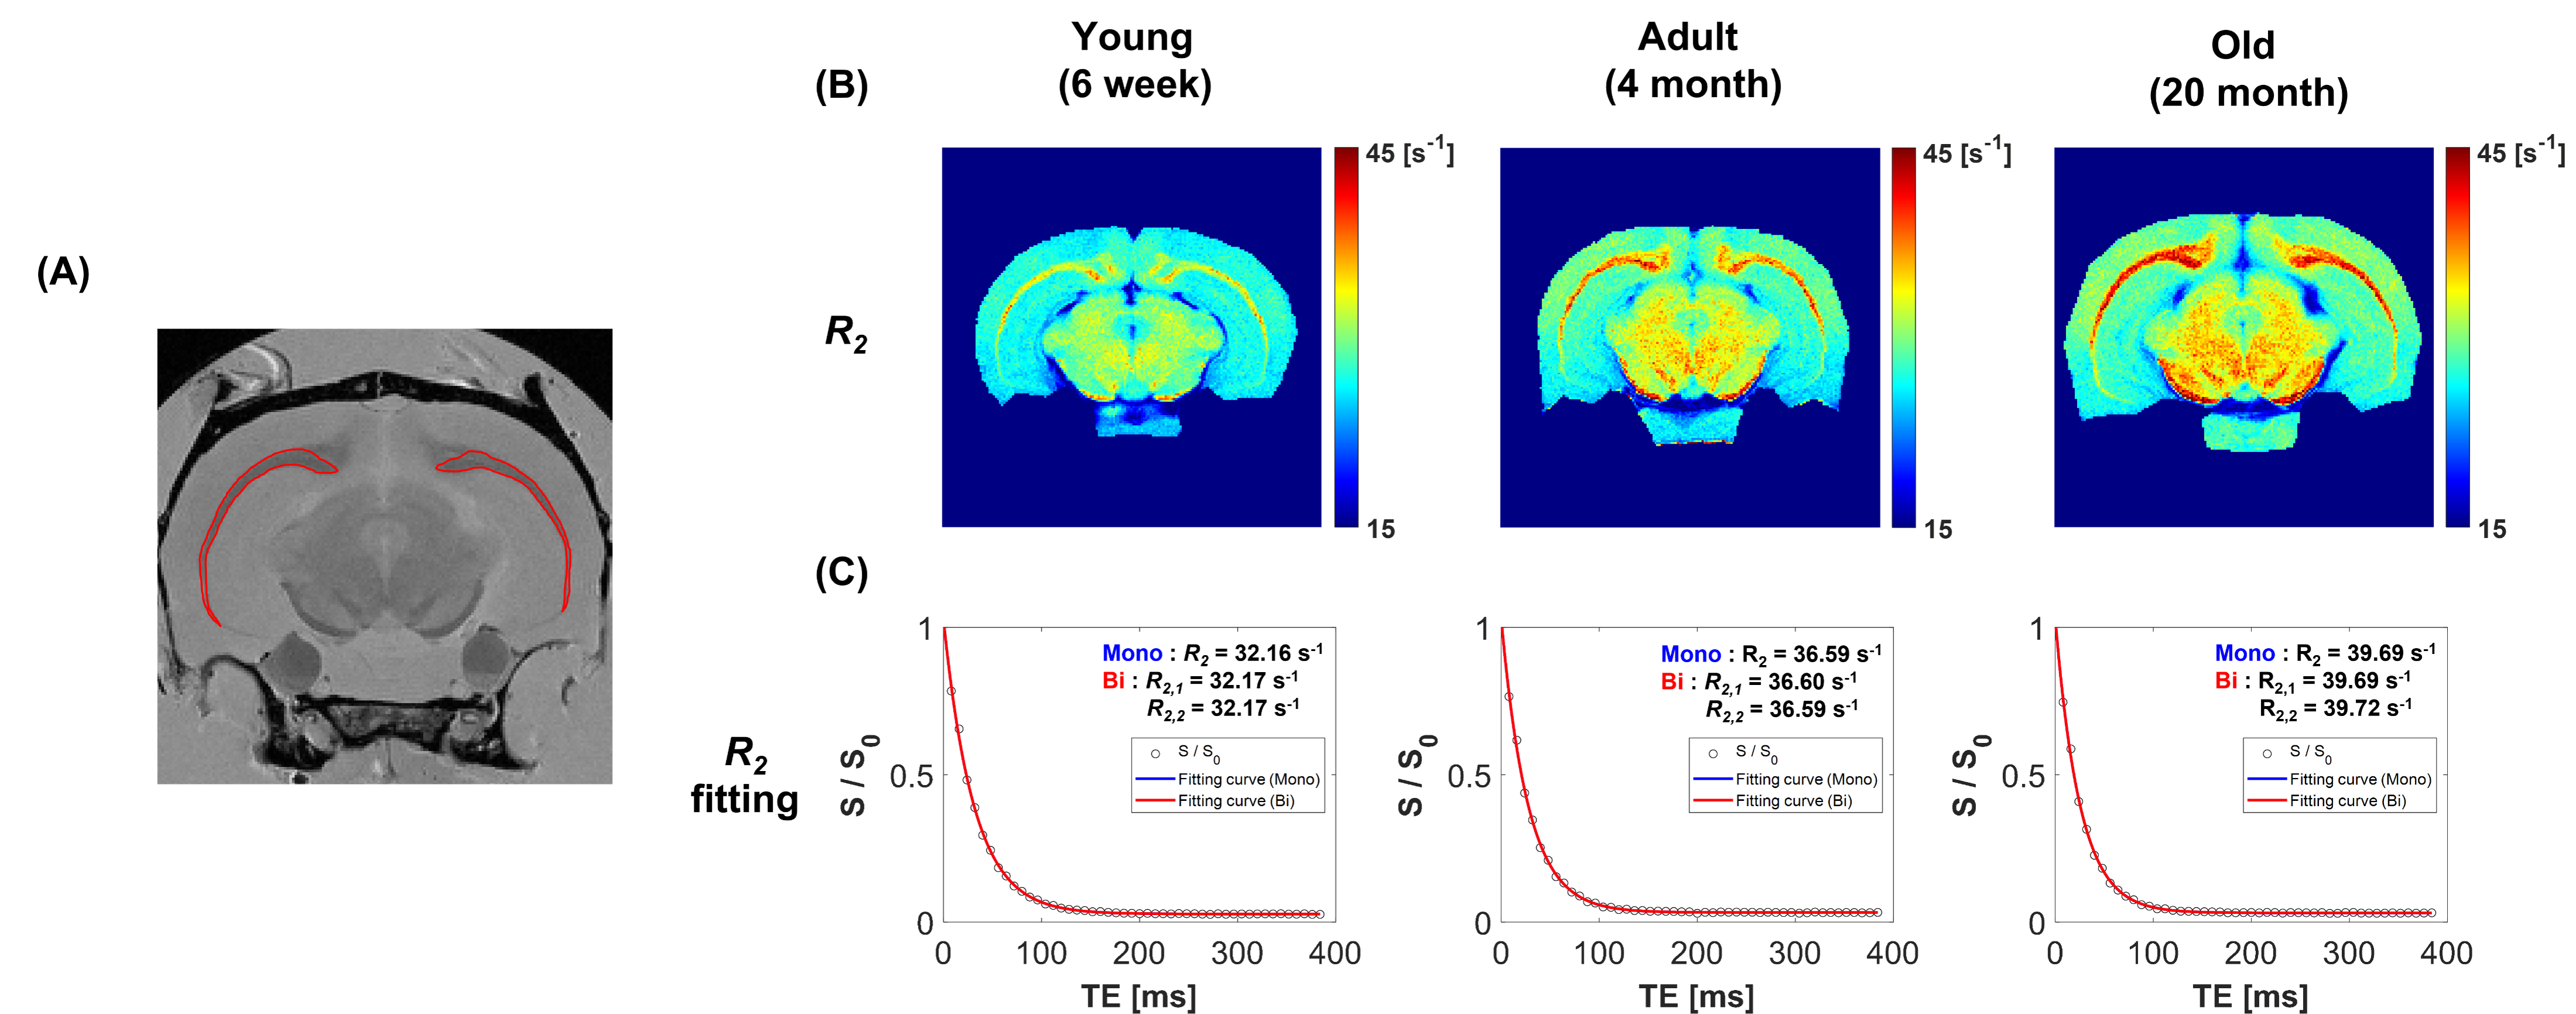
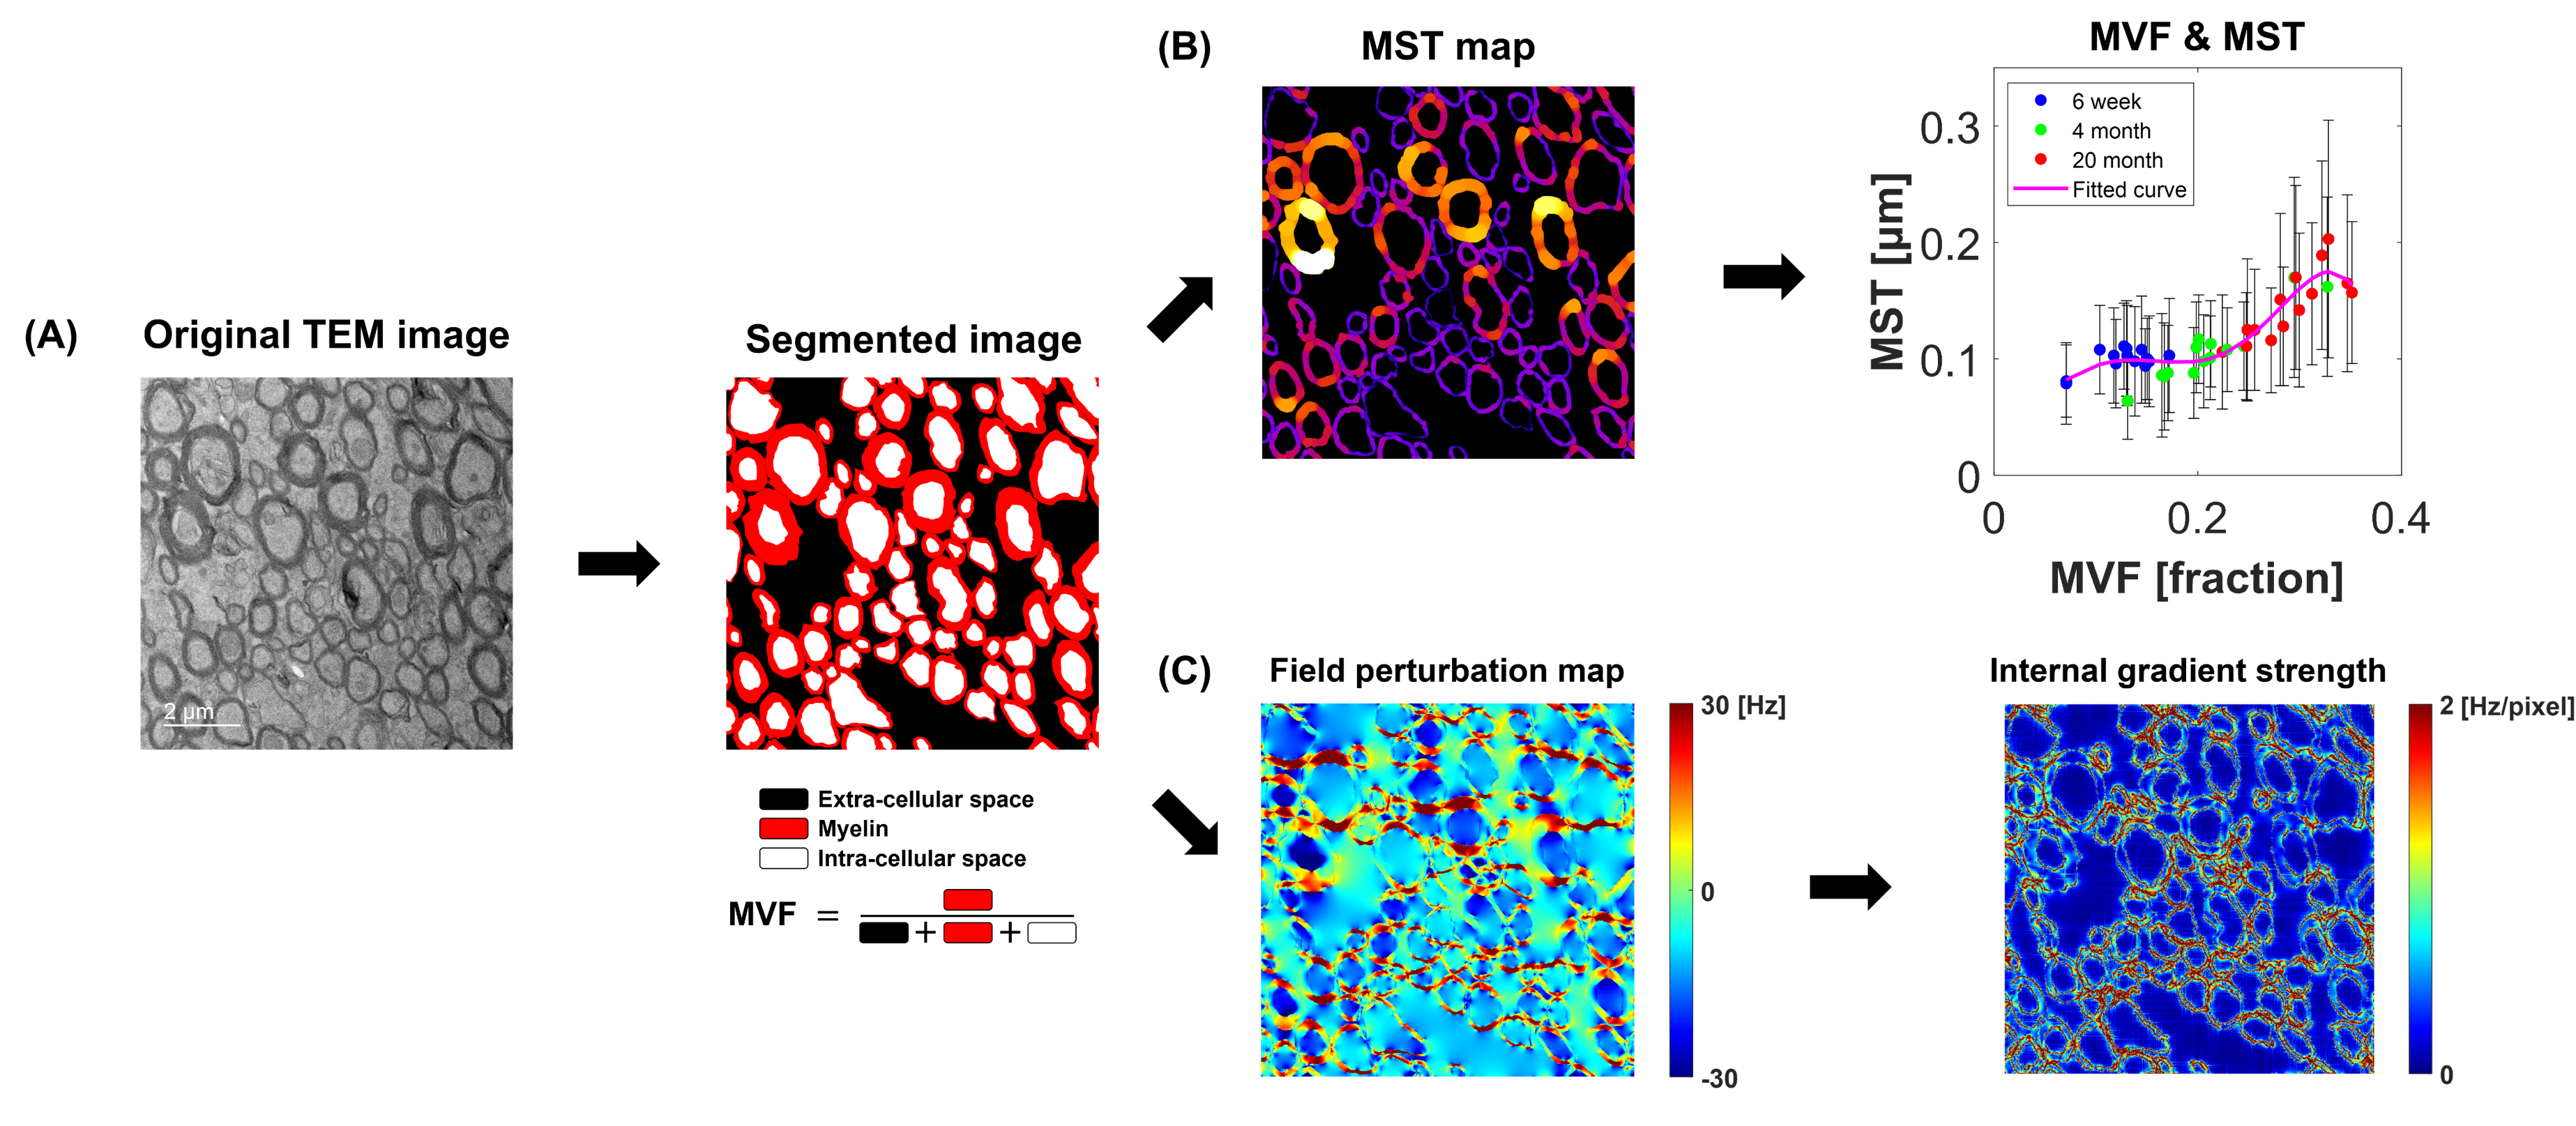
Three age groups of female Sprague Dawley rats were used : young (6-week-old, n = 3), adult (4-month-old, n = 3), and old (20-month-old, n = 3). The brains were extracted and fixed in formalin. MRI data were acquired on a 7T MRI scanner using multi-slice multi-echo sequence with matrix size = 256×256, field of view = 25×25 mm2, repetition time (TR) = 4000 ms, and echo time (TE) = 8–384 ms (echo spacing = 8 ms). Voxel-wise R2 values were estimated in two ways, mono- and bi-exponential functions, to ensure whether myelin water signals were detected (mono-exponential fitting result : R2, bi-exponential fitting results : R2,1 and R2,2). The corpus callosum (CC) was selected as the region of interest in this study.After MRI experiments, CC regions from each brain were extracted and imaged on a transmission electron microscopy (TEM). 3–7 TEM images were collected per sample, and a total of 42 TEM images were used for analysis. TEM images were manually segmented and the MVF value of each segmented image was calculated as the ratio of myelin area to total area. Mean MST value of each segmented image was calculated by the sphere fitting method using ImageJ.6,7
The internal gradient produced by field perturbation is known to affect the calculated R2 using CPMG sequence.8,9 Thus, TEM-based field perturbation simulations were performed to examine the effects of intra/extracellular water signal on myelin structures. Field perturbation maps were simulated for each TEM image, considering the isotropic and anisotropic magnetic susceptibilities of myelin (isotropic component χi = - 0.13 ppm, anisotropic component χa = - 0.15 ppm).10–12 Then, the internal gradient strength g of each field perturbation map was calculated as "g = sqrt(Gx2 + Gy2)" by Gx and Gy, the differences between adjacent pixels in each x and y direction. When calculating the mean internal gradient strength values in each TEM image, only pixels in the intra/extracellular space were counted.
Results
A summary of MRI and fitting results for each age group is shown in Figure 1. In the mono-exponential fitted R2 maps, it was confirmed that the age-related change was clear in CC region (Figures 1A and 1B). In addition, it was confirmed that short-T2 components caused by myelin water signal were not detected because R2,1 and R2,2 were equal to R2 (Figure 1C). Therefore, in this experiment, R2 values were affected by intra/extracellular water signals.A schematic diagram of the analyzes using TEM is shown in Figure 2. First, the TEM images for each sample are segmented and used for MVF and MST calculations (Figure 2A). In the early developmental stage (6-week to 4-month), MVF increased with age, while MST showed little change (Figure 2B). For verification, field perturbation simulation was performed on each segmented image, and the effects of myelin are confirmed by measuring the internal gradient strength of the field perturbation map (Figure 2C).
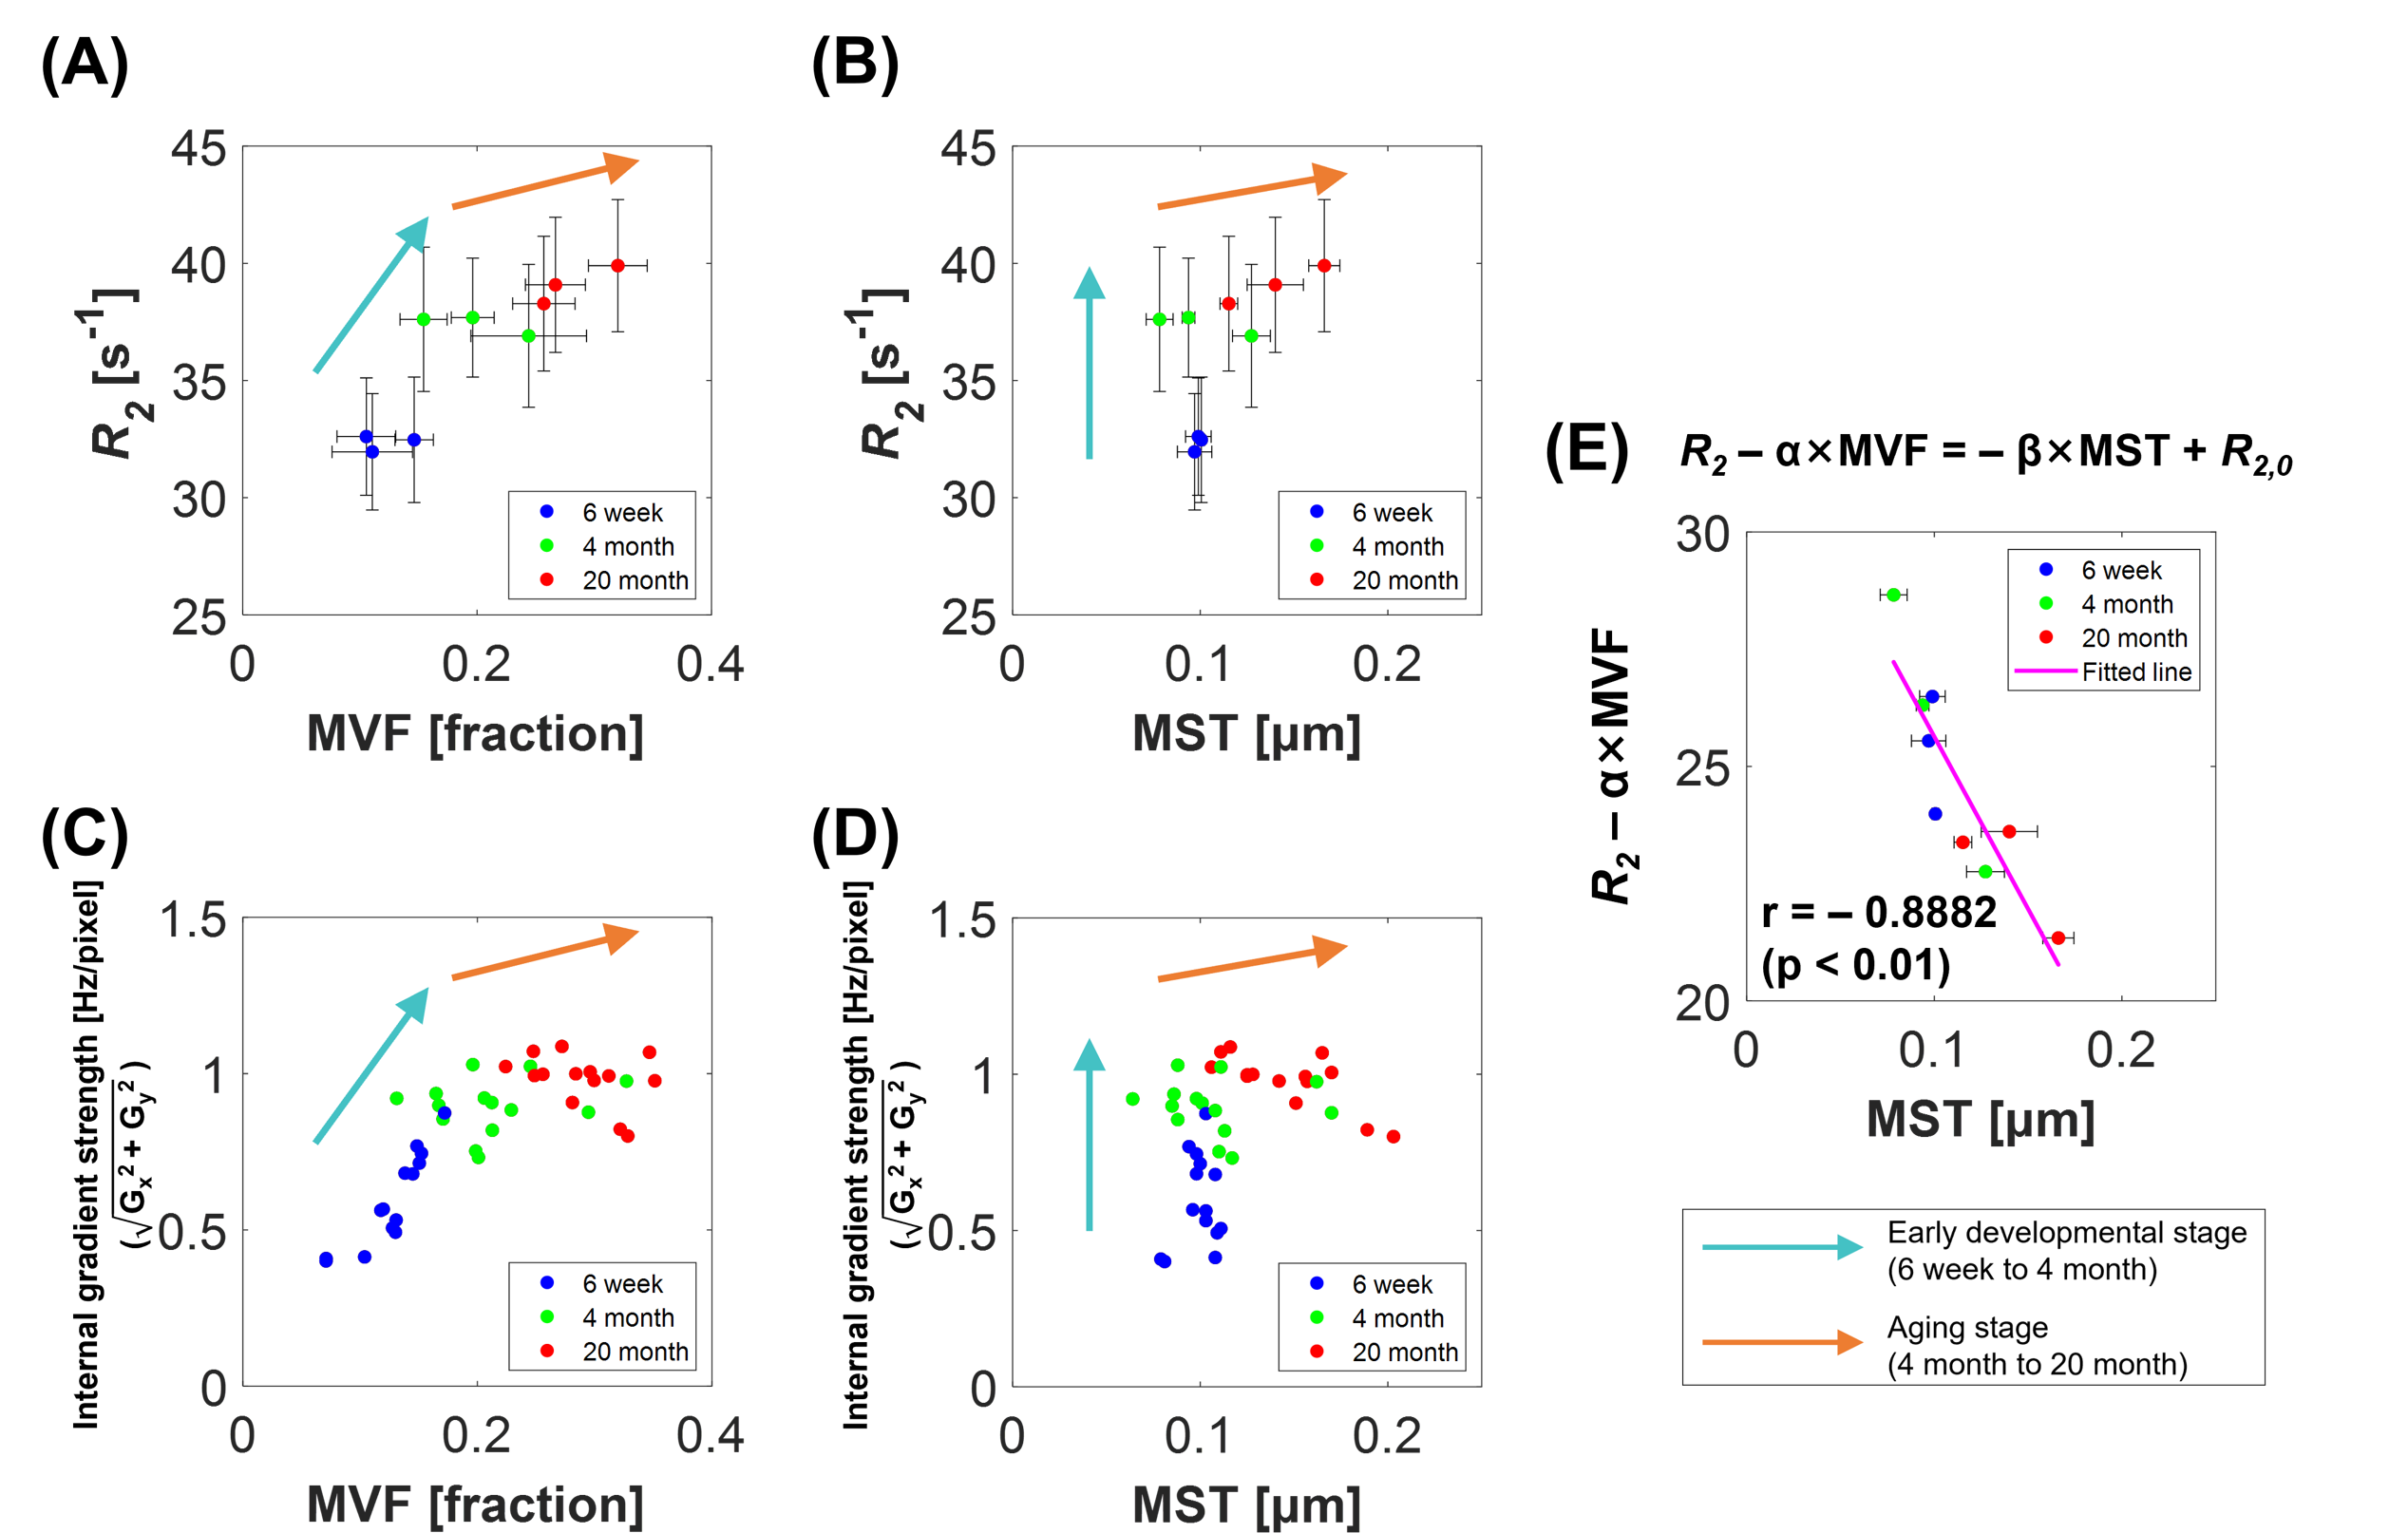
Summarized MRI, TEM and simulation results are shown in Figure 3. In the early developmental stage, R2 and internal gradient strength values increased with increasing MVF (Figures 3A and 3C), whereas MST remained almost unchanged (Figures 3B and 3D). In the aging stage (4-month to 20-month), the rates of change in R2 and internal gradient strength values appear to become slower, most likely due to increasing MST during the corresponding period (Figures 3A–3D). Based on the assumptions that increasing MVF affects R2 increase and increasing MST affects R2 decrease, the R2 values for the MVF and MST were empirically modeled as “R2 = α×MVF - β×MST + R2,0”, where α, β, and R2,0 are constants. Consequently, a strong correlation (Pearson’s correlation coefficient r = - 0.8882) between “R2 - α×MVF” (α = 57.9771) and “- β×MST + R2,0” (β = 73.4970, R2,0 = 32.9837 [s-1]) was observed as shown in Figure 3E.
Discussion and conclusion
We confirmed that the changes in MVF and MST according to age were different through TEM analysis, and we wanted to investigate how these changes affect CPMG-based R2 (Figure 2). Both MRI and simulation results showed that the effects of MVF and MST on R2 were opposite to each other (Figure 3). Through these trends, we hypothesized that R2 can be expressed as a relational expression for MVF and MST, and confirmed that there is a significant correlation between these relations (Figure 3E). Although it is a simple relational expression that does not consider parts that may affect R2 such as chemical fixation and iron concentration,13,14 it empirically suggests that the effect of myelin structures can be seen through CPMG-based intra/extracellular water signals.Acknowledgements
This work was partially supported by grants from the National Research Foundation of Korea of the Korean government (Nos. 2018M3C7A1056887 and 2022R1A2C2011191). This research was supported by the 2021 Joint Research Project of the Institute of Science and Technology and was also supported by a grant from the Korea Healthcare Technology R&D Project through the Korea Health Industry Development Institute (KHIDI) funded by the Ministry of Health & Welfare, Republic of Korea (grant No: HI14C1135).References
1. Carr HY, Purcell EM. Effects of diffusion on free precession in nuclear magnetic resonance experiments. Physical review. 1954;94(3):630.
2. Meiboom S, Gill D. Modified spin‐echo method for measuring nuclear relaxation times. Review of scientific instruments. 1958;29(8):688-691.
3. Mackay A, Whittall K, Adler J, Li D, Paty D, Graeb D. In vivo visualization of myelin water in brain by magnetic resonance. Magnetic resonance in medicine. 1994;31(6):673-677.
4. Heath F, Hurley SA, Johansen‐Berg H, Sampaio‐Baptista C. Advances in noninvasive myelin imaging. Developmental neurobiology. 2018;78(2):136-151.
5. MacKay AL, Laule C. Magnetic resonance of myelin water: an in vivo marker for myelin. Brain Plasticity. 2016;2(1):71-91.
6. Abràmoff MD, Magalhães PJ, Ram SJ. Image processing with ImageJ. Biophotonics international. 2004;11(7):36-42.
7. Dougherty R, Kunzelmann K-H. Computing local thickness of 3D structures with ImageJ. Microscopy and Microanalysis. 2007;13(S02):1678-1679.
8. Kleinberg RL, Horsfield MA. Transverse relaxation processes in porous sedimentary rock. Journal of Magnetic Resonance (1969). 1990;88(1):9-19.
9. Ronczka M, Müller-Petke M. Optimization of CPMG sequences to measure NMR transverse relaxation time T2 in borehole applications. Geoscientific Instrumentation, Methods and Data Systems. 2012;1(2):197-208.
10. Wharton S, Bowtell R. Fiber orientation-dependent white matter contrast in gradient echo MRI. Proceedings of the National Academy of Sciences. 2012;109(45):18559-18564.
11. Sati P, van Gelderen P, Silva AC, et al. Micro-compartment specific T2⁎ relaxation in the brain. Neuroimage. 2013;77:268-278.
12. Li W, Liu C, Duong TQ, van Zijl PC, Li X. Susceptibility tensor imaging (STI) of the brain. NMR in Biomedicine. 2017;30(4):e3540.
13. Birkl C, Langkammer C, Golob‐Schwarzl N, et al. Effects of formalin fixation and temperature on MR relaxation times in the human brain. NMR in Biomedicine. 2016;29(4):458-465.
14. Langkammer
C, Krebs N, Goessler W, et al. Quantitative MR imaging of brain iron: a postmortem
validation study. Radiology. 2010;257(2):455-462.
Figures