0360
Temperature Mapping Based on Chemical Exchange Saturation Transfer of Creatine1Shenzhen Institute of Advanced Technology, Chinese Academy of Sciences, Shenzhen, China, 2University of Chinese Academy of Science, Beijing, China, 3The Instrumental Analysis Center of Shenzhen University, Shenzhen University, Shenzhen, China
Synopsis
Keywords: Data Analysis, CEST & MT
Chemical exchange between endogenous labile guanidinium (Guan) protons of creatine and free water and its thermal dependency were investigated with CEST imaging. The apparent offsets of Cr-CEST were linearly correlated to the experiment temperatures and was relatively insensitive to Cr concentration and pH variations at a range corresponding to physiological and pathological conditions, suggesting a potential utility of Cr-CEST for in vivo thermometry based on endogeneous creatine of the biological tissue.Introduction
Temperature homeostasis is necessary to infer brain physiology and pathology1. Noninvasive thermometry would promote the in vivo investigation of cerebral thermoregulation under normal or pathological conditions. Chemical exchange between endogenous labile hydrogens and its thermal dependence provides a mechanism promising for thermometry through CEST imaging2, alternative to the existing approaches of proton resonance frequency-based thermometry3. In this study, we aim to investigate the utility of creatine CEST (Cr-CEST) imaging for in vivo temperature mapping.Materials and Methods
Cr-CEST was conducted on 400MHz NMR system (Bruker 400 MHz Avance III HD spectrometer) for phantoms with various pH (5.8, 7.2, 7.4) and creatine monohydrate concentrations (20, 40 and 80 mM) at temperatures of 21, 24, 28, 32, 35, 37 and 43 °C, respectively. 1% D2O was added in the samples for field lock. The CEST sequence consisted of a continuous wave presaturation pulse (duration = 4s, saturation power B1 = 0.23μT, prepulse delay = 10s). The Z-spectrum was obtained at the saturation offsets of -3 to 3 ppm (increment 0.03 ppm) and ± 5 to ± 3ppm (increment 0.2 ppm), and normalized to the signal obtained at the saturation offset of + 200 ppm (S0). Z-spectrum was flipped to be Z(ω) = 1-S(ω)/S0, followed by a two-pool Lorentzian fitting corresponding to bulk water and Cr-CEST peaks round 0 and +2 ppm, respectively2.The relationships between temperature and the apparent offsets, amplitude, linewidth as well as the integral of the Cr-CEST peak were estimated using regression analysis (SPSS 19.0). Temperature mapping was created based on the Cr-CEST phantom data acquired on 3.0T scanner with a 32-channel phased-array head coil (United Imaging Healthcare, uMR790). The CEST sequence consisted of a train of rectangular wave presaturation pulse (saturation time = 1s, B1 = 0.15μT), followed by single-shot spin echo echo-planar imaging sequence for acquisition (TR/TE 4000/38.6ms, FA 160°). The Z-spectrum was obtained from -3 to +3 ppm with intervals of 0.06 ppm. The experiment temperature was maintained by a warm water circulation system (Thermo Fisher Scientific, ARCTIC PC200-A25), and measured using a MR-compatible fluorescent optic-fiber thermometer (FOTS-DINA-1000, INDIGO, Suzhou, China).
Results
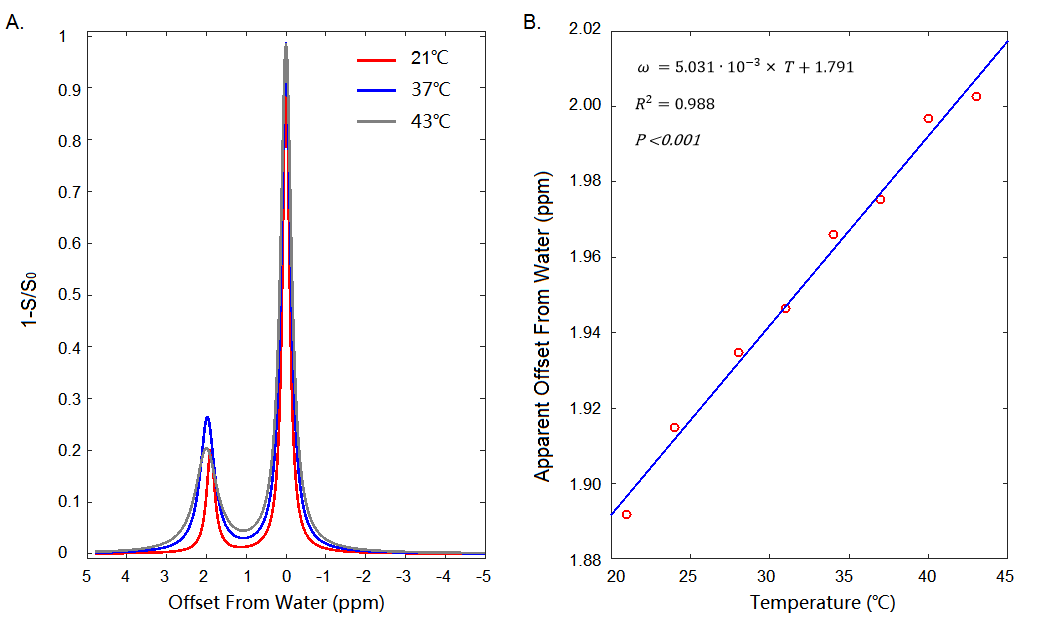
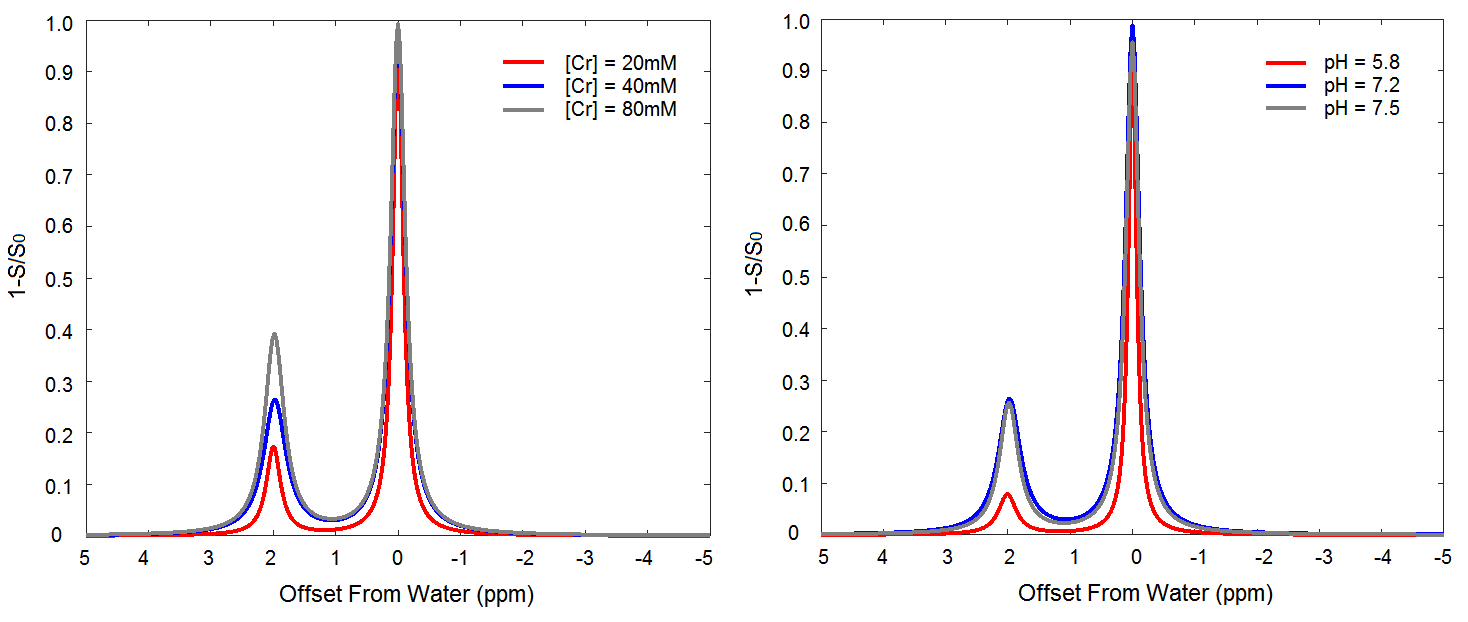
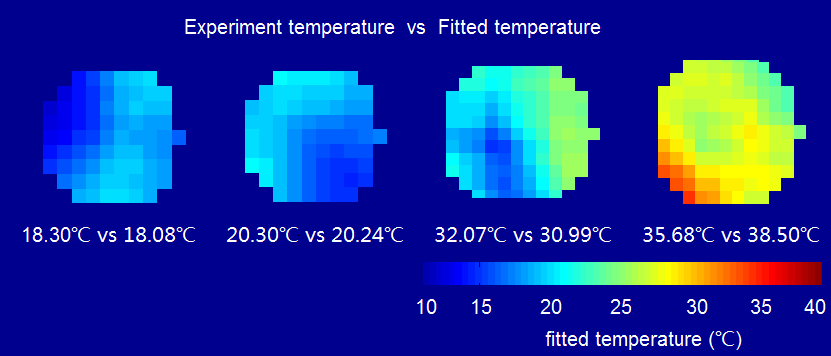
The relationship between experiment temperature and the apparent position of Cr-CEST signal was shown in Figure 1. Temperature regressed linearly with the apparent offsets of Cr-CEST peak (ω) (ω = 5.031 × 10⁻³ × T + 1.791, R2 = 0.988, P < 0.001). The amplitude, linewidth and integral but not the apparent shift of Cr-CEST peak varied significantly with Cr concentration and pH values (Figure 2). Temperature mapping of the phantom at 3.0T MR system was shown in Figure 3.Discussion
The water chemical shift has been known to be sensitive to temperature 4. A 10°C increase will shift the water peak by about -0.1 ppm. Here we observed an increase of Cr-CEST offset (at pH of 7.2) from water by about +0.05 ppm with an increase of 10°C (Figure 1), suggesting temperature effects on water cannot fully explain data. The temperature effect on guanidinium (Guan) proton exchange rates and chemical shifts might also play a role in shifting the apparent offset of CrCEST as referred to water position.A recent study suggests that it is challenging to detect Cr-CEST signal in vivo at 3.0T due to an intermediate to fast exchange 5, but the current method might be useful at an ultra-high field where the exchange rate of Cr becomes slow in NMR timescale.Conclusions
The apparent offsets of Cr-CEST were linearly correlated to the experiment temperatures, and relatively insensitive to Cr concentration and pH variations at a range corresponding to physiological and pathological conditions, suggesting a potential utility of Cr-CEST for in vivo thermometry based on endogeneous creatine of the biological tissue.Acknowledgements
This work was supported in part by NSFC (92159101, 82171904), Shenzhen Municipal Scientific Program (JCYJ20200109110612375) and the Key Laboratory for Magnetic Resonance and Multimodality Imaging of Guangdong Province (2020B1212060051).
References
1. Dehkharghani S, Qiu D. MR Thermometry in Cerebrovascular Disease: Physiologic Basis, Hemodynamic Dependence, and a New Frontier in Stroke Imaging. AJNR American journal of neuroradiology. 2020;41:555-565.
2. Cai K, Singh A, Poptani H, et al. CEST signal at 2 ppm (CEST@2ppm) from Z-spectral fitting correlates with creatine distribution in brain tumor. NMR in Biomedicine. 2015;28:1-8.
3. Blackwell J, Krasny M, O'Brien A, et al. Proton resonance frequency shift thermometry: A review of modern clinical practices. JMRI. 2020; 55: 389-403.
4. Ishihara Y, Calderon A, Watanabe H, et al. A precise and fast temperature mapping using water proton chemical shift. Magnetic resonance in medicine. 1995;34:814-823.
5. Chen L, Schär M, Chan KWY, et al. In vivo imaging of phosphocreatine with artificial neural networks. Nature Communications. 2020;11:1072.
Figures