0358
J-difference Editing of Lactate and Threonine in the Human Brain at 3T
Ryan K Robison1,2,3, Justin R Haynes2,3, Sandeep Ganji4,5, Wellington Pham2,3, Seth A Smith2,3, Victoria L Morgan2,3, Reid C Thompson6, Reed A Omary3, John C Gore2,3, and Changho Choi2,3
1Philips, Nashville, TN, United States, 2Vanderbilt University Institute of Imaging Science, Vanderbilt University Medical Center, Nashville, TN, United States, 3Radiology and Radiological Sciences, Vanderbilt University Medical Center, Nashville, TN, United States, 4Philips, Rochester, MN, United States, 5Mayo Clinic, Rochester, MN, United States, 6Neurological Surgery, Vanderbilt University Medical Center, Nashville, TN, United States
1Philips, Nashville, TN, United States, 2Vanderbilt University Institute of Imaging Science, Vanderbilt University Medical Center, Nashville, TN, United States, 3Radiology and Radiological Sciences, Vanderbilt University Medical Center, Nashville, TN, United States, 4Philips, Rochester, MN, United States, 5Mayo Clinic, Rochester, MN, United States, 6Neurological Surgery, Vanderbilt University Medical Center, Nashville, TN, United States
Synopsis
Keywords: Data Acquisition, Spectroscopy
Lactate is important as a source of energy and a product of metabolism, so the capability to measure lactate accurately and noninvasively by MRS is of high value. We report a new lactate editing approach that enables detection of the lactate 1.3 ppm resonance with minimal contaminations from threonine and other compounds. Narrow-band editing 180° RF pulses were implemented in 1H MR MEGA-PRESS and the sequence was optimized with numerical and phantom analyses. With data from six healthy adult subjects, the lactate and threonine concentrations in healthy brain were estimated to be 0.5±0.1 and 1.0±0.1 mM, respectively.Introduction
Several studies have suggested that brain lactate plays important roles in several functions including energy supply, metabolism, and signaling for neuronal activities1. The capability to measure lactate noninvasively without contamination from other compounds is therefore of high significance. J-difference editing (MEGA) is often used to overcome the spectral overlaps of the lactate 1.3 ppm resonance with neighboring large signals. Threonine also has a CH3 proton resonance at 1.3 ppm, J coupled to the CH proton resonance at 4.25 ppm, only 0.15 ppm distant from the Lac CH proton resonance (Figure 1A). Thus, threonine can be coedited but contaminates lactate editing to a degree that depends on the effect of the editing 180ᵒ RF pulse on the threonine 4.25 ppm resonance. Here we report a new MEGA approach that enables discrimination of the lactate and threonine 1.3 ppm resonances.Methods
Two 45.3 ms long rectangular editing 180° RF pulses (E180) were implemented within TE 139 ms MEGA-PRESS on a Philips 3T scanner (Figure 1B). The E180 (bandwidth 17.6 Hz) had negligible effect on resonances 0.15 ppm (19 Hz) away from the carrier frequency at 3T. Following validation of the editing efficacy of the E180 pulses with numerical and phantom analyses, the MEGA was tested in 6 healthy adult subjects (30x27x27 mm3 voxel in parietal brain). Three sets of spectra were obtained with the E180 tuned at 4.1, 4.25, and 999 ppm (subspectra A, B, and C, respectively) (Figure 1C). LCModel was used for spectral fitting. The lactate and threonine concentrations were estimated from difference spectra, (A–C)/2 and (B–C)/2, respectively, with reference to water.Results
Numerical simulations indicated that, when the 45.3 ms E180 pulses are tuned to 4.1 ppm (subscan A), a positive signal from lactate is induced at 1.3 ppm (Figure 1C). A difference spectrum, (A‒C)/2, showed an edited lactate signal with amplitude 54% of the unedited signal for a singlet FWHM of 6 Hz, ignoring T2 relaxation effects. The E180 had negligible effects on 4.25 ppm in the subscan, and consequently the threonine spins gave an inverted peak at 1.3 ppm. A small coedited threonine signal was present at 1.3 ppm in the difference spectrum. When the E180 was tuned to 4.25 ppm (subscan B), the polarities of lactate and threonine signals were negative and positive, thereby leading to small lactate and fully-edited threonine signals in the (B‒C)/2 spectrum.The calculated lactate and threonine signals agreed well with short-TE STEAM spectra from phantoms (Figure 2A,B). The strengths and polarities of the lactate and threonine MEGA signals from the phantoms were as predicted in simulations (Figure 2C,D). For a lactate and NAA phantom, when the signals were broadened to NAA FWHM of 6 Hz, the lactate signal amplitudes were 28% and 7% with respect to the NAA singlet amplitude in (A‒C)/2 and (B‒C)/2 spectra, respectively. For a threonine and NAA phantom, the threonine peak amplitude was 6% and 30% the NAA singlet amplitude in (A‒C)/2 and (B‒C)/2 spectra, respectively.
Figure 3 presents in vivo MEGA editing results in a healthy subject. A doublet signal was clearly discernible at 1.3 ppm in the (A‒C)/2 spectrum. Spectral fitting of the signal with a lactate basis resulted in 0.6 mM lactate. The (B‒C)/2 spectrum showed somewhat broad signals between 1.1 and 1.5 ppm. Threonine was estimated as 1.0 mM.
The MEGA was tested in 6 healthy volunteers. In each of the (A‒C)/2 difference spectra, a signal was clearly discernible at 1.3 ppm (Figure 4). From spectral fitting of the signals with a lactate basis, the lactate concentration was estimated to be 0.5±0.1 mM (N=6). All (B‒C)/2 spectra showed broad signals at ~1.3 ppm. Threonine level was estimated as 1.0±0.1 mM, ~2 fold higher than the lactate estimation.
Discussion
Our data indicate that selective inversion of the lactate 4.1 ppm and threonine 4.25 ppm resonances can be achieved with 45.3 ms rectangular editing pulses within the commonly used lactate editing echo-time frame (e.g., 144ms), thereby enabling discrimination of lactate and threonine signals. The capability to generate a high-purity lactate signal would outweigh potential reduction of the editing yield arising from use of narrow-band editing pulses, making it possible to detect modest changes in lactate level reliably.The lactate estimation in the current study is in good agreement with the result in an early study of lactate measurement by a non-MEGA difference editing at 3T (narrow-band-pulse triple-refocusing)2. Many prior studies used MEGA for measuring brain lactate and reported lactate levels with reference to creatine (tCr). The lactate/tCr ratio in our data was 0.07±0.01, 2 - 3 fold smaller compared to the prior studies, in which the bandwidths of the editing 180ᵒ pulses were larger than 50 Hz and consequently these previous MEGA measures of lactate may contain considerable contamination of threonine3,4.
Conclusion
We have demonstrated separation of the lactate and threonine 1.3 ppm resonances by MEGA-PRESS at 3T in vivo. Brain lactate and threonine levels were estimated to be approximately 0.5 and 1.0 mM, respectively. The proposed MEGA editing scheme may provide a noninvasive tool for identifying modest alterations in brain lactate level reliably.Acknowledgements
This research was supported by institutional funds provided by VICC, VUIIS, and the Departments of Radiology and Radiological Sciences and Neurological Surgery.References
1. Magistretti PJ, Allaman I. Lactate in the brain: from metabolic end-product to signalling molecule. Nat Rev Neurosci. 19;235:2018.
2. Choi C, Coupland NJ, Kalra S, et al. Proton Spectral Editing for Discrimination of Lactate and Threonine 1.31 ppm Resonances in Human Brain In Vivo. Magn Reson Med. 2006;56:660.
3. Chan KL, Snoussi K, Edden RAE, et al. Simultaneous detection of glutathione and lactate using spectral editing at 3 T. NMR Biomed. 2017;30:e3800.
4. Dacko M, Lange T. Improved detection of lactate and β‐hydroxybutyrate using MEGA‐sLASER at 3 T. NMR Biomed. 2019;32:e4100.
Figures
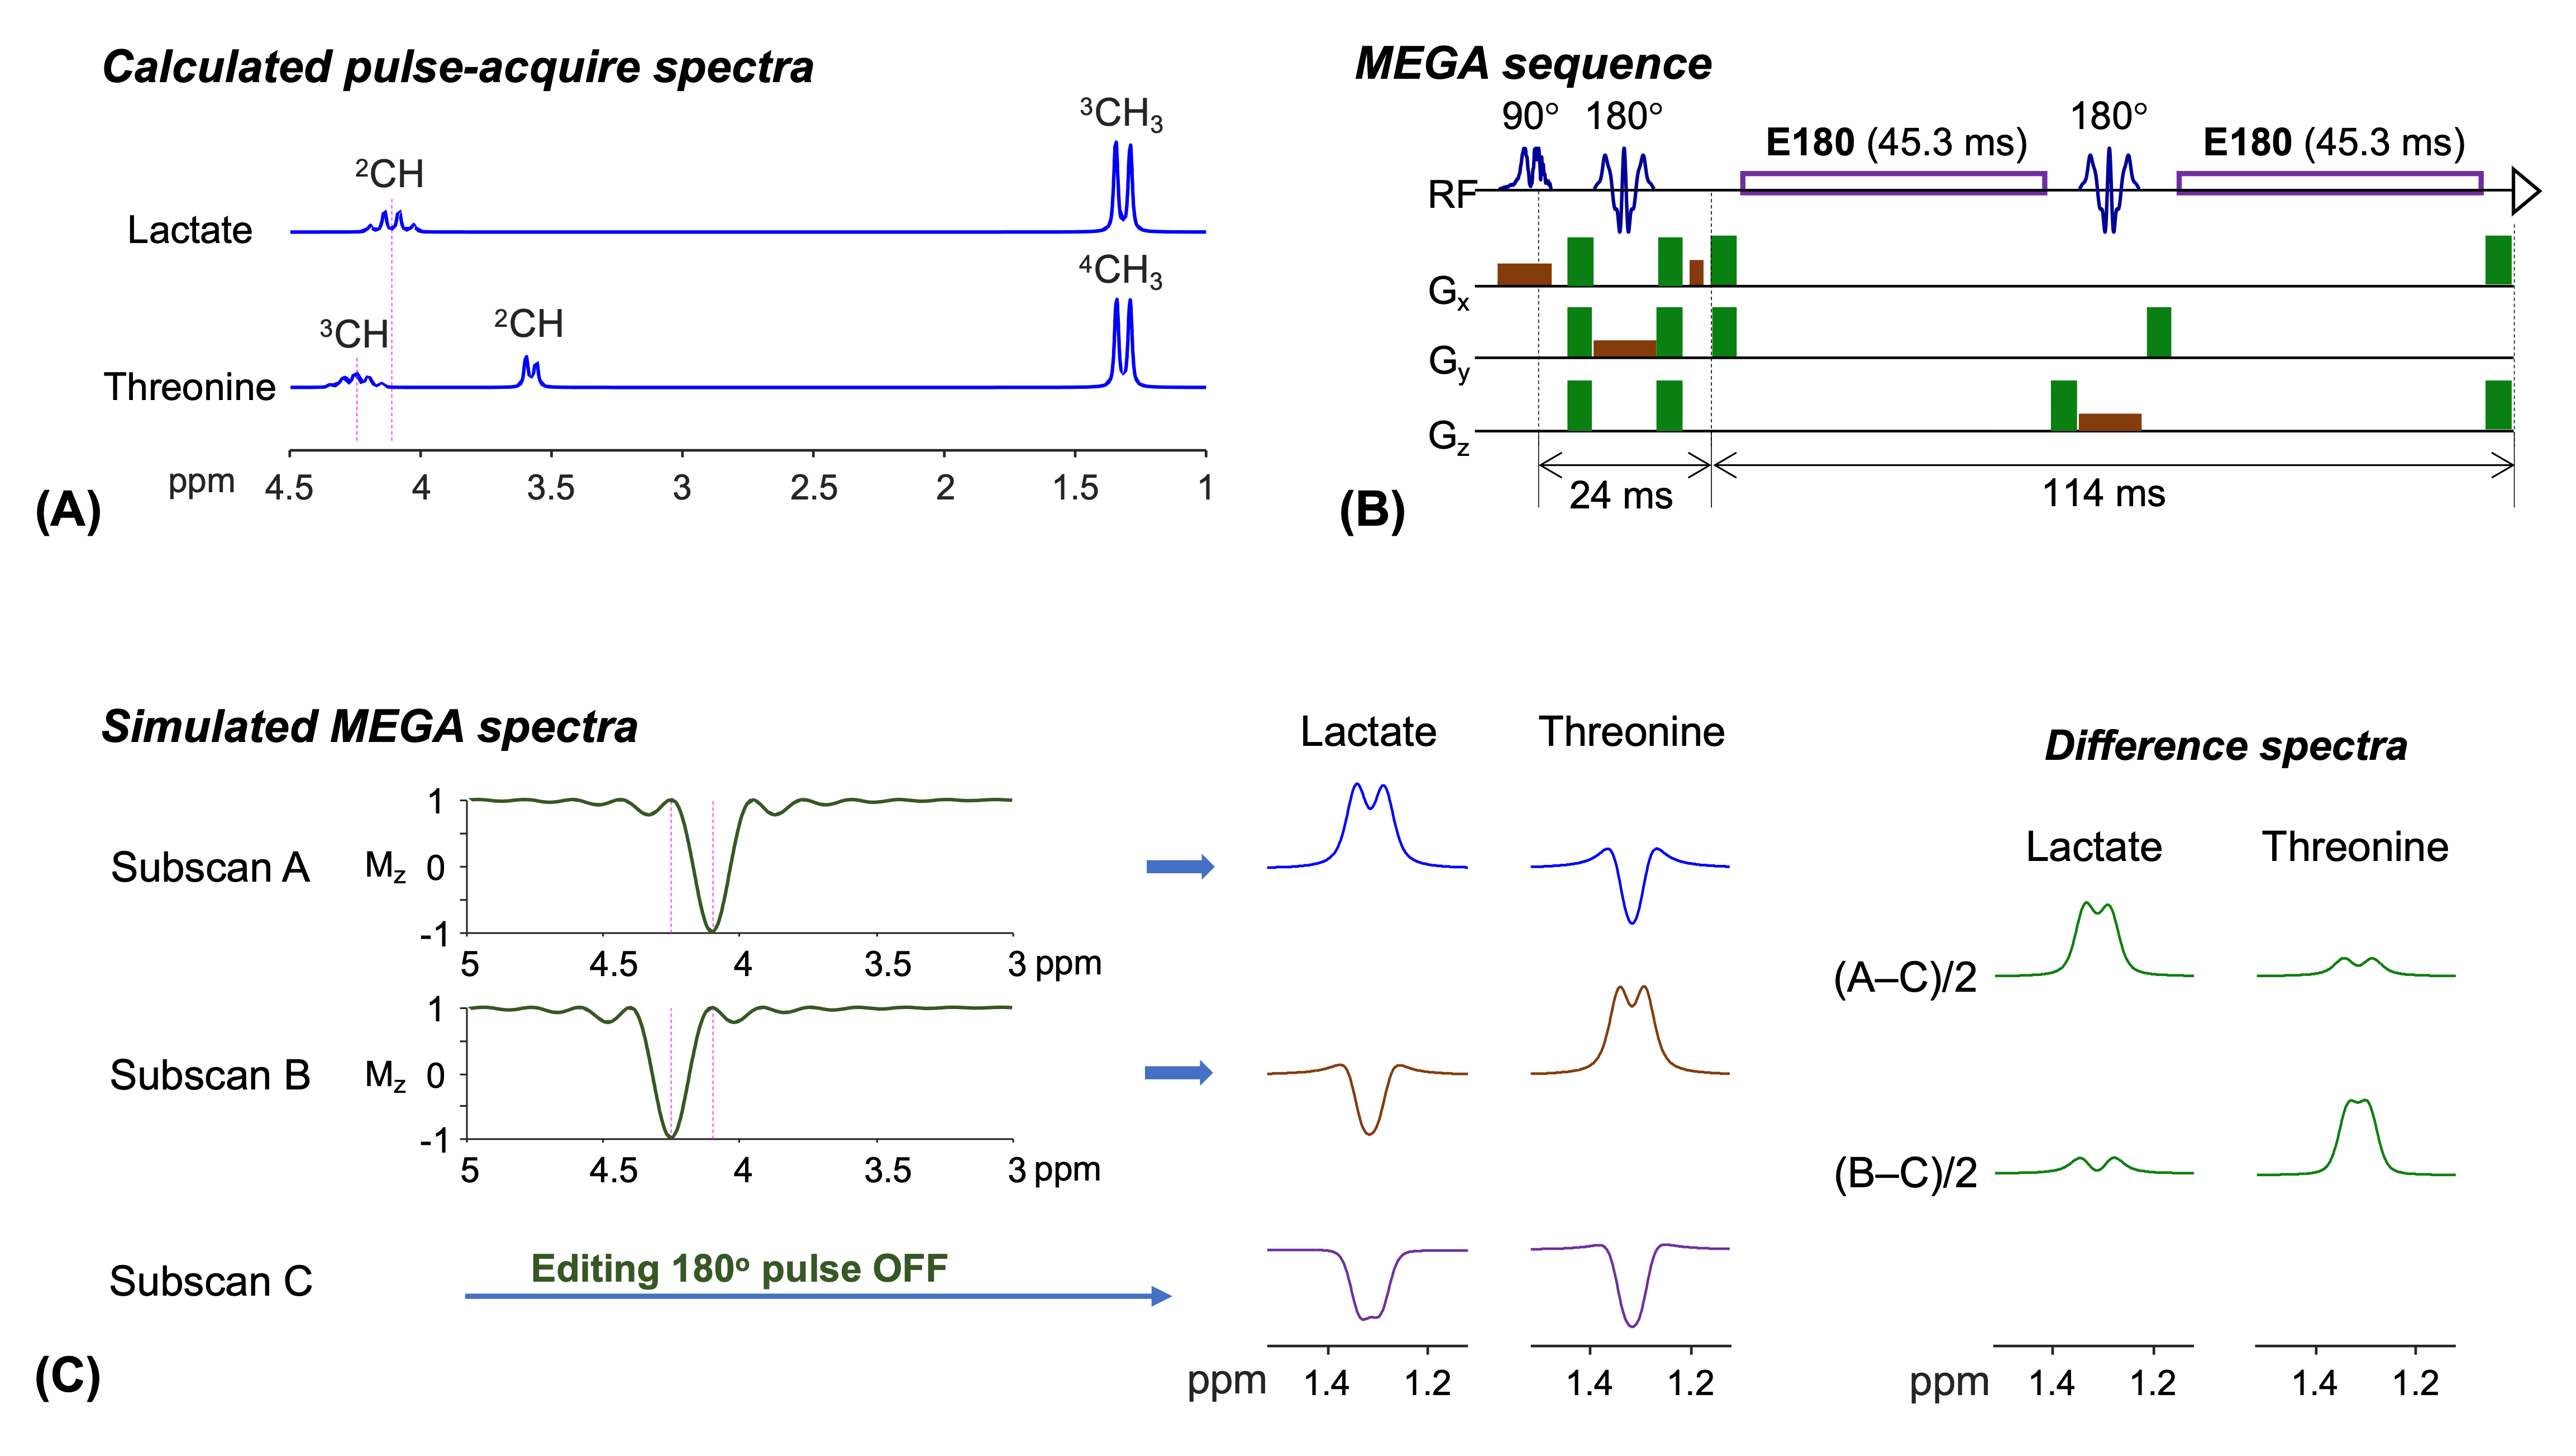
FIGURE 1. (A) Numerically calculated
pulse-acquire spectra of lactate (Lac) and threonine (Thr) at equal
concentrations. (B) Schematic diagram of 45.3 ms rectangular editing 180° pulse (E180) MEGA PRESS. (C) Bloch simulated inversion profile
of the E180 and density matrix simulated MEGA spectra. For each of Lac and Thr,
three subspectra were calculated for E180 carrier frequency at 4.1 ppm (subscan
A), 4.25 ppm (subscan B), and a far-off value (subscan C), from which
difference spectra, (A–C)/2 and (B–C)/2, were obtained. Spectra were broadened to singlet FWHM of 2 Hz in
(A) and 6 Hz (B).
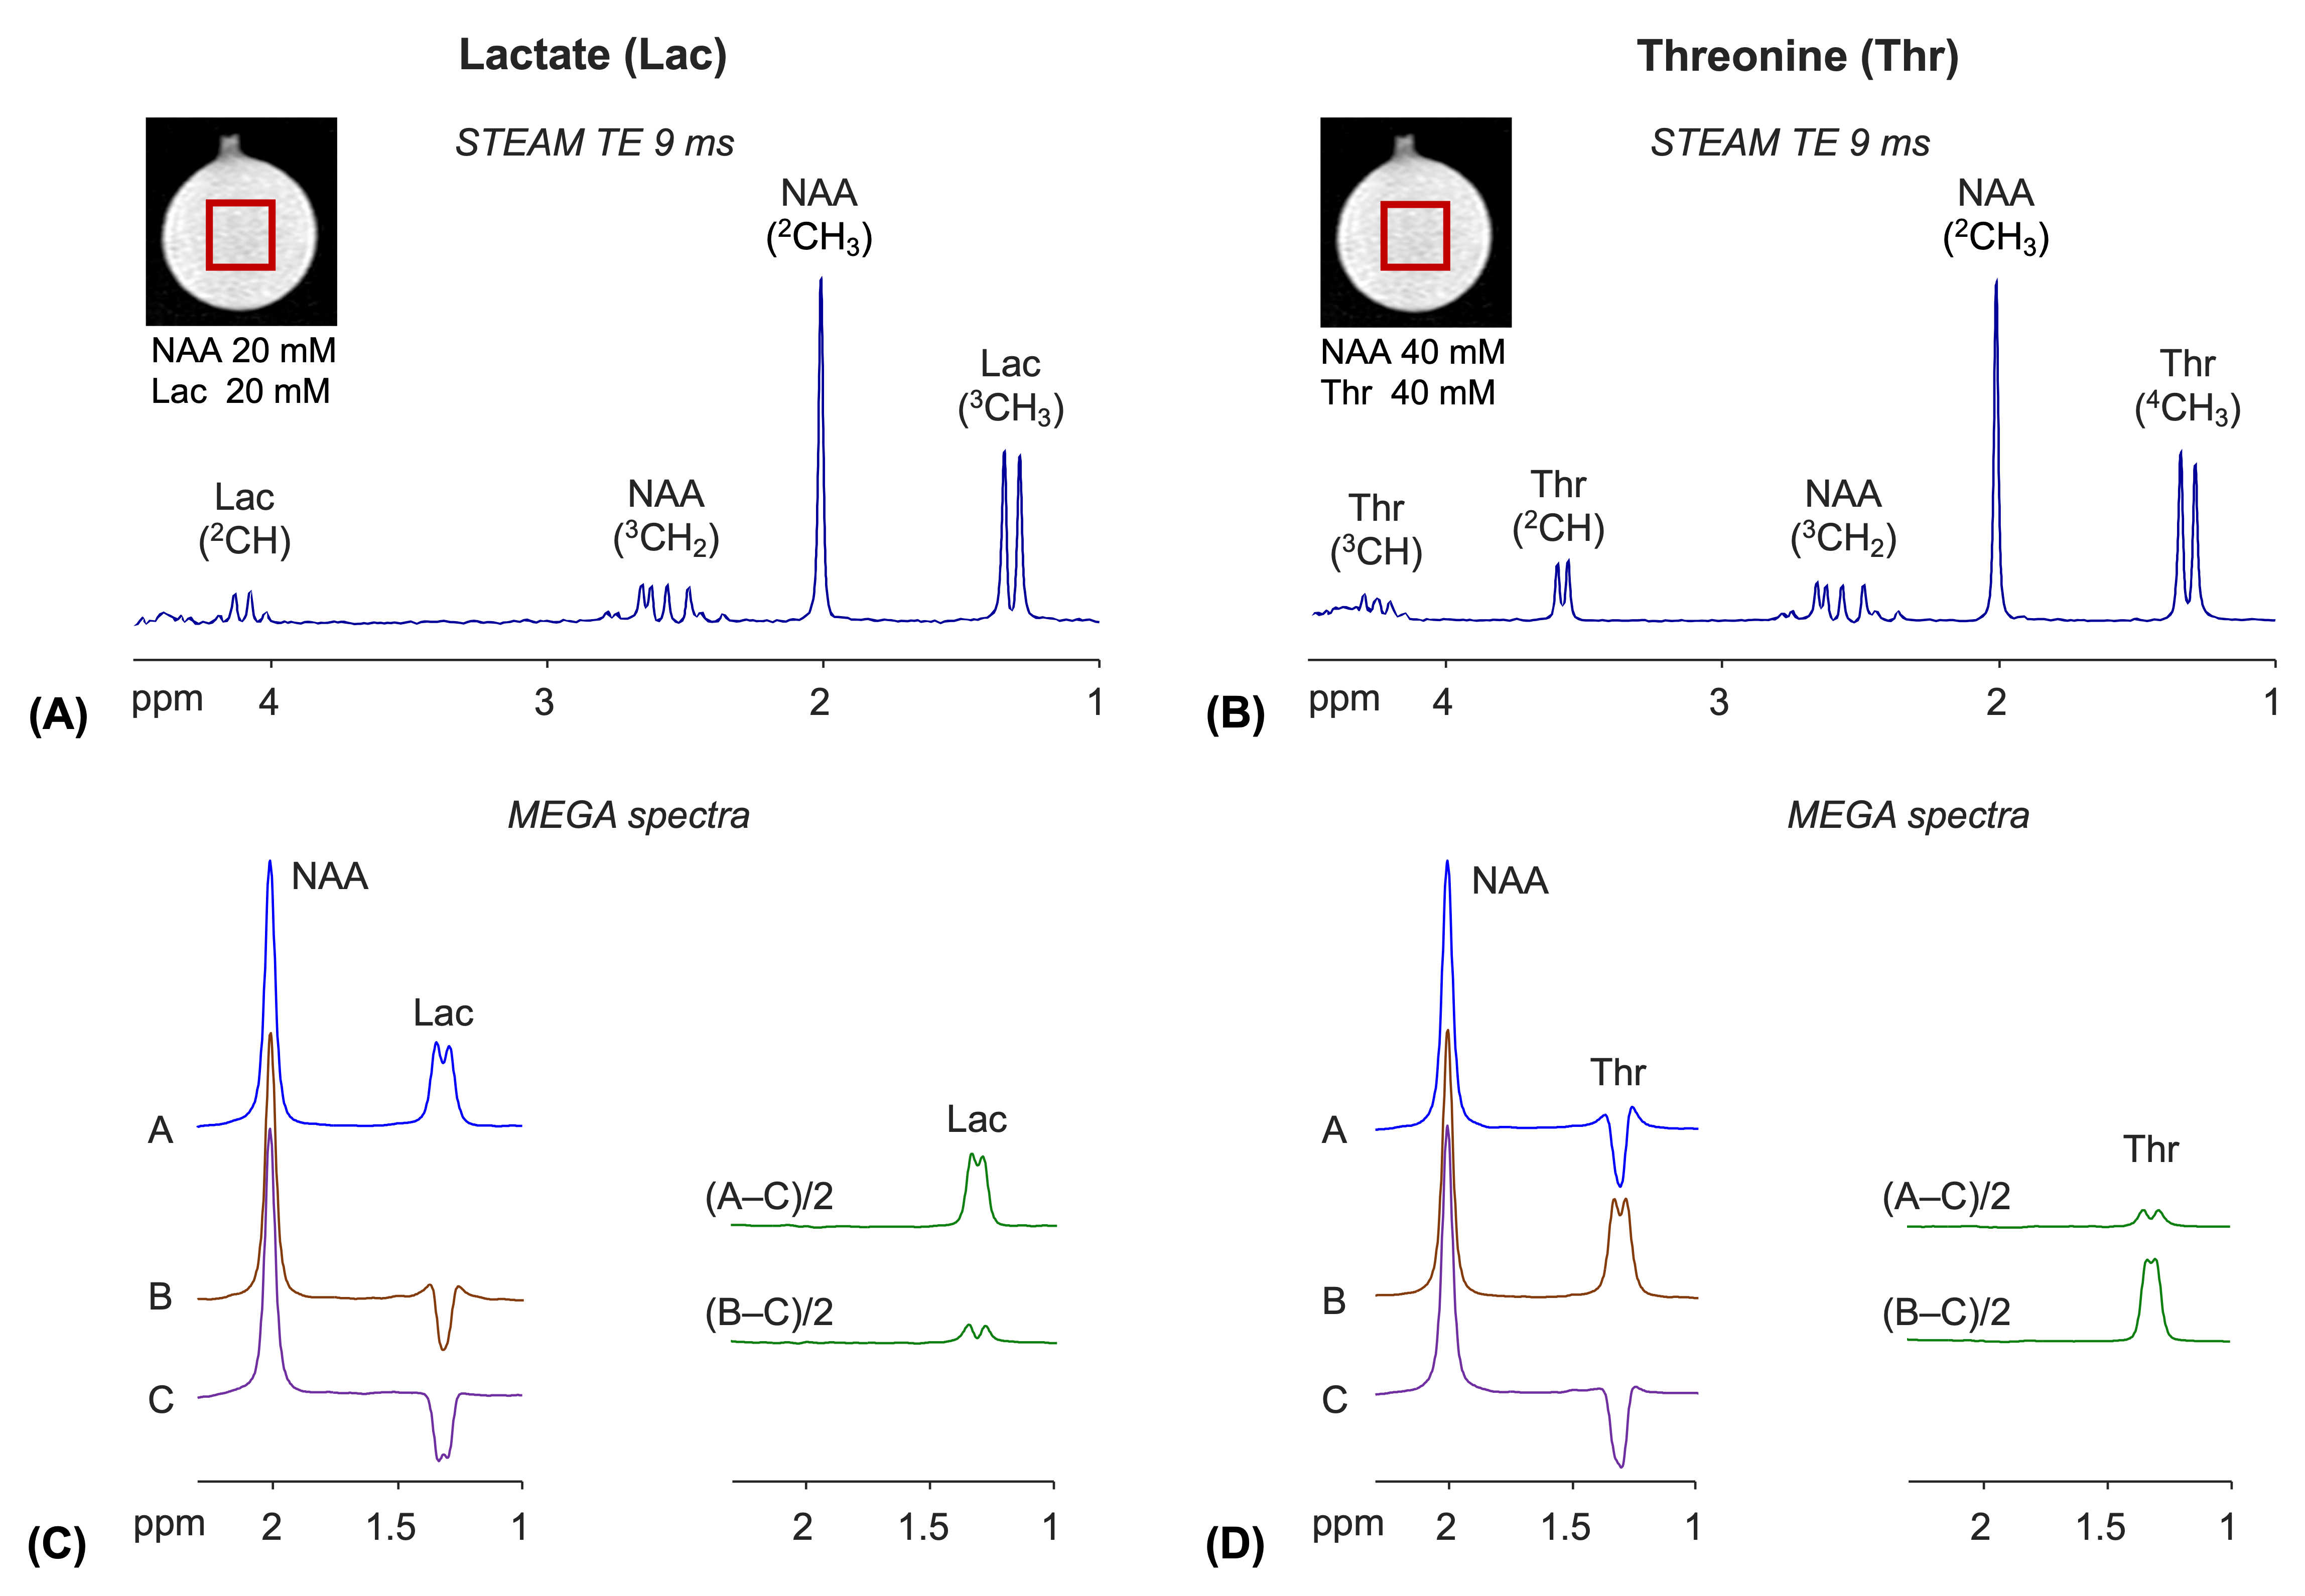
FIGURE 2. Phantom illustration of MEGA editing of
lactate (Lac) and threonine (Thr). (A,B) TE 9 ms STEAM spectra from Lac
and Thr phantoms (TR 12s). The spectra were broadened to 2Hz NAA singlet FWHM and
normalized to the NAA singlet amplitude in each spectrum. (C) MEGA
spectra from the Lac phantom. (D) MEGA spectra from the Thr
phantom. The sub-/difference spectra
were all broadened to 6Hz NAA singlet FWHM and normalized to the NAA singlet
amplitude for each phantom. The notations of MEGA sub-/difference spectra are
identical to those in Figure 1.
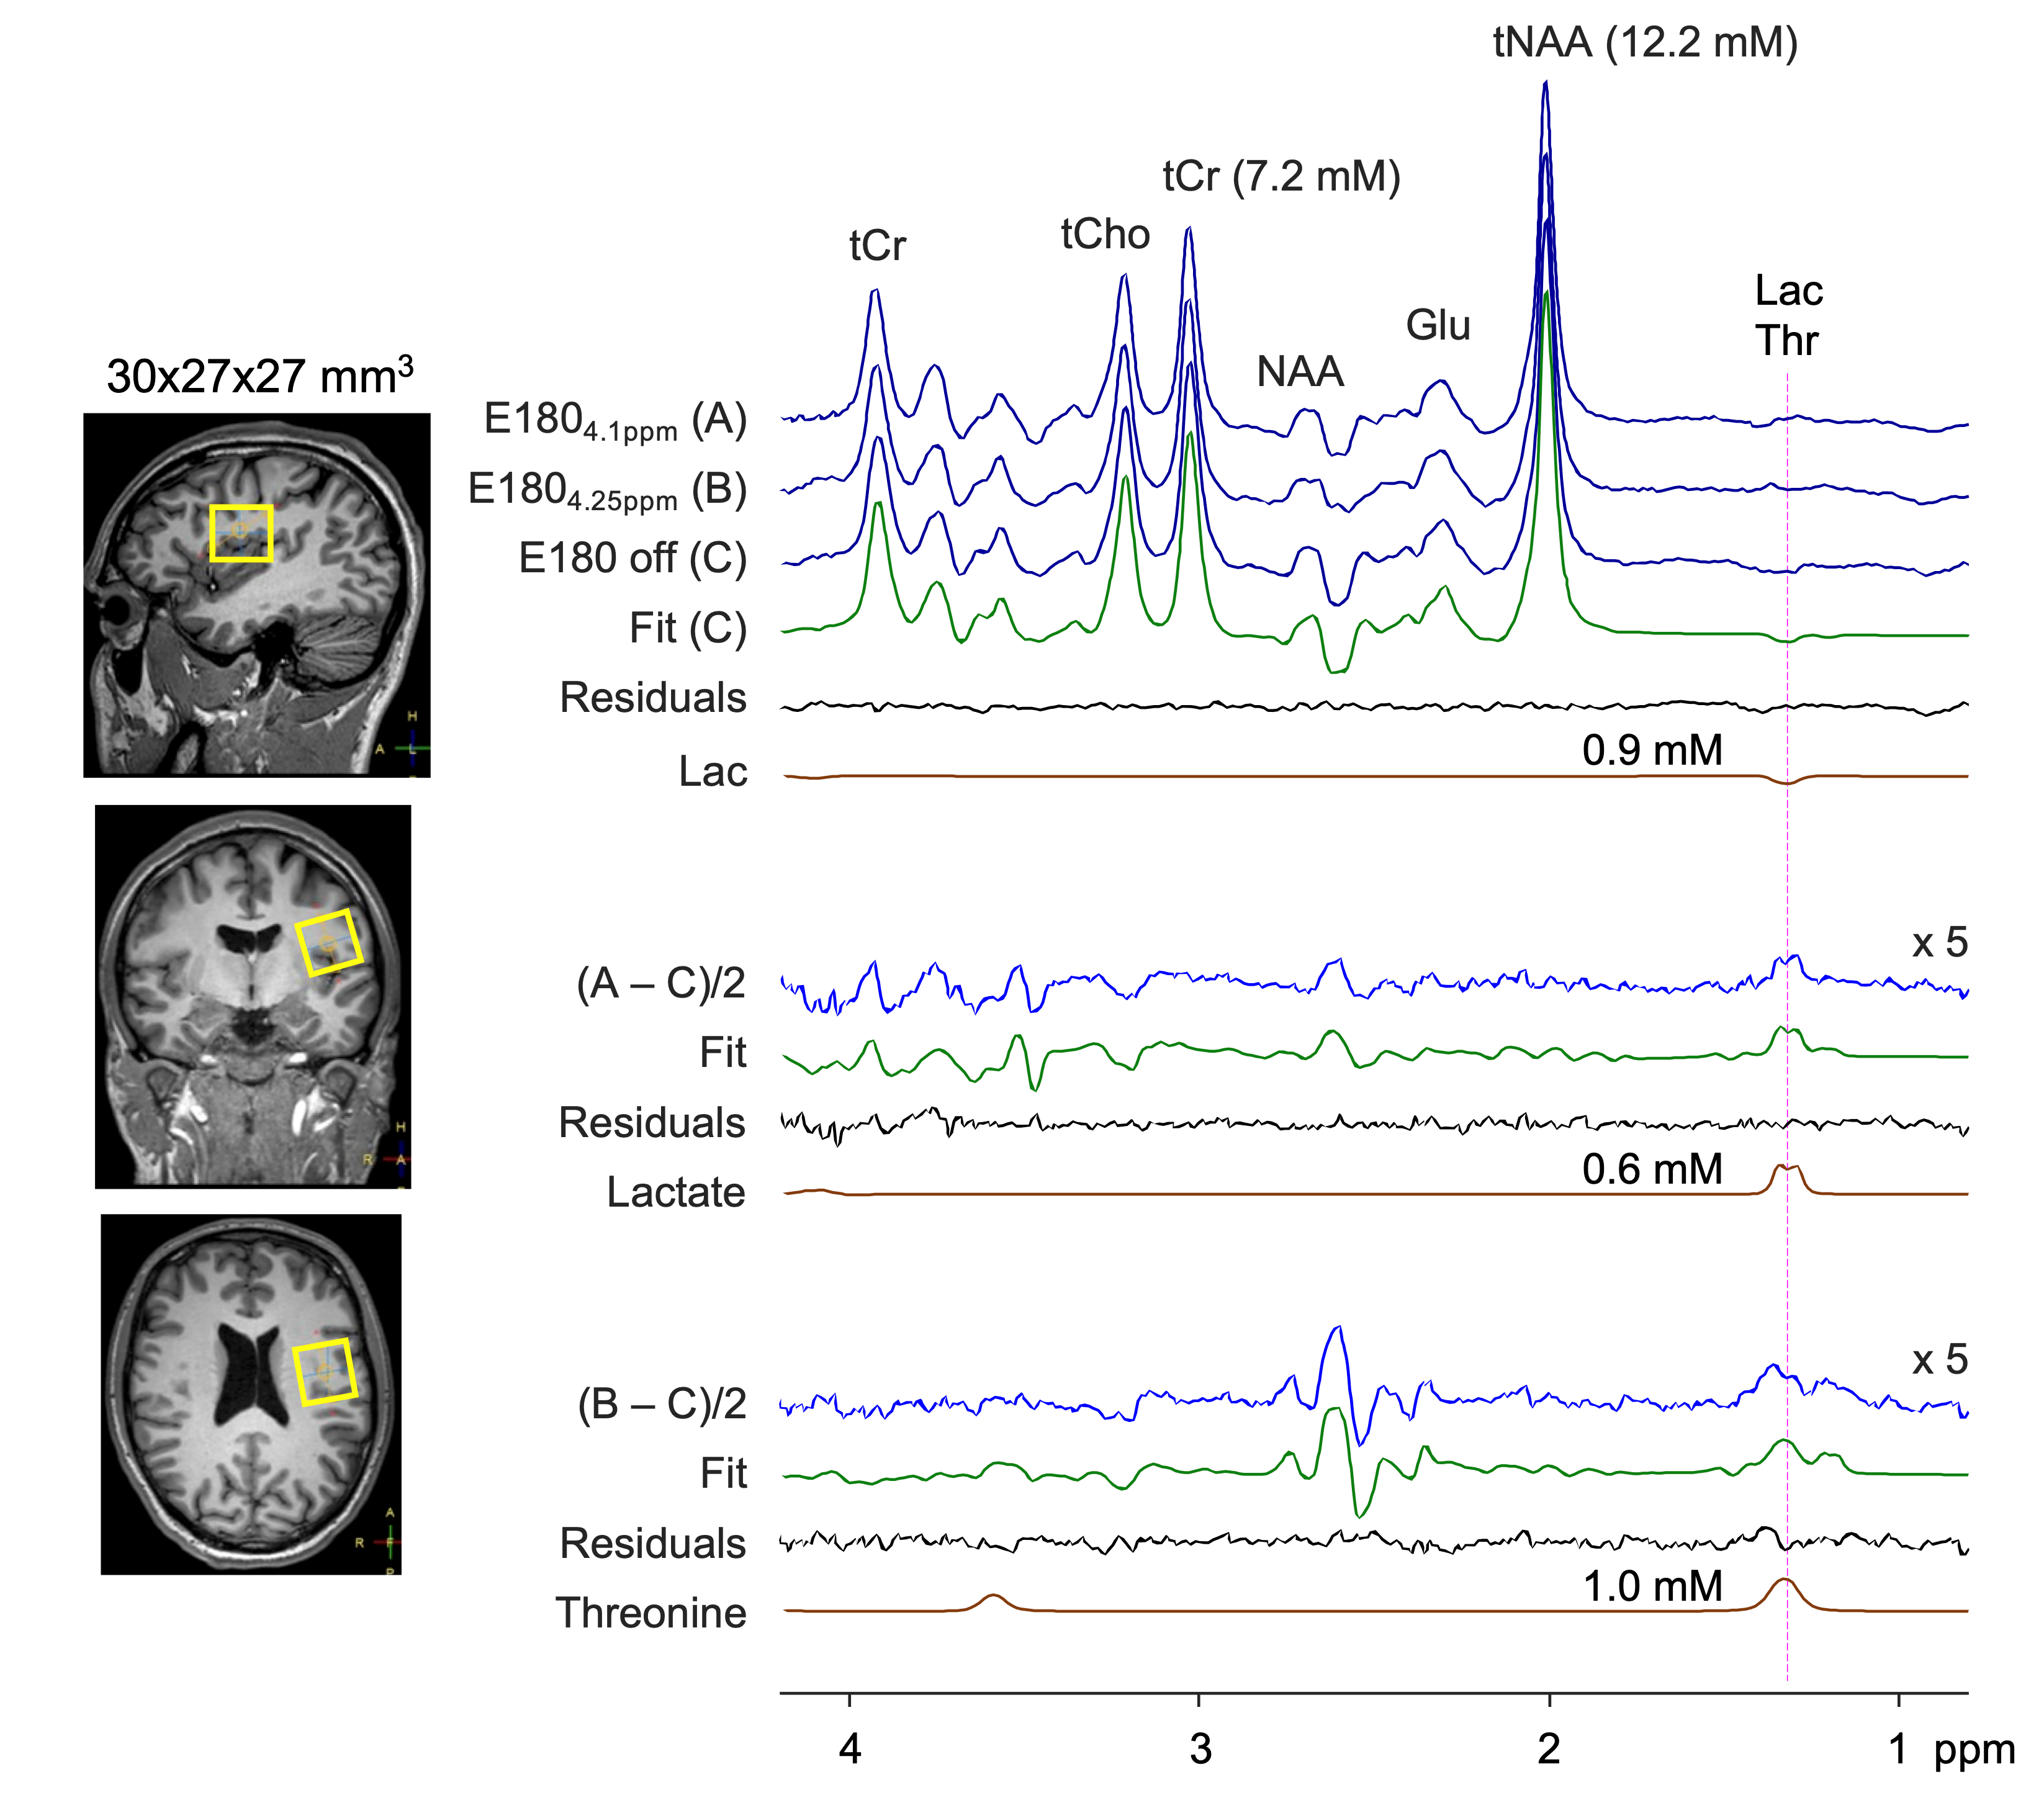
FIGURE 3. In vivo MEGA edited spectra from the
parietal brain in a healthy subject. Subspectra A, B, and C are stacked
together with LCModel fitting results of the edit-off and difference spectra.
The LCModel-returned signals of lactate and threonine are shown together with
their concentration estimates. Note that lactate was excluded in the fitting of
the (B–C)/2 spectrum while threonine was excluded in other fittings. Difference spectra are
5-fold magnified.
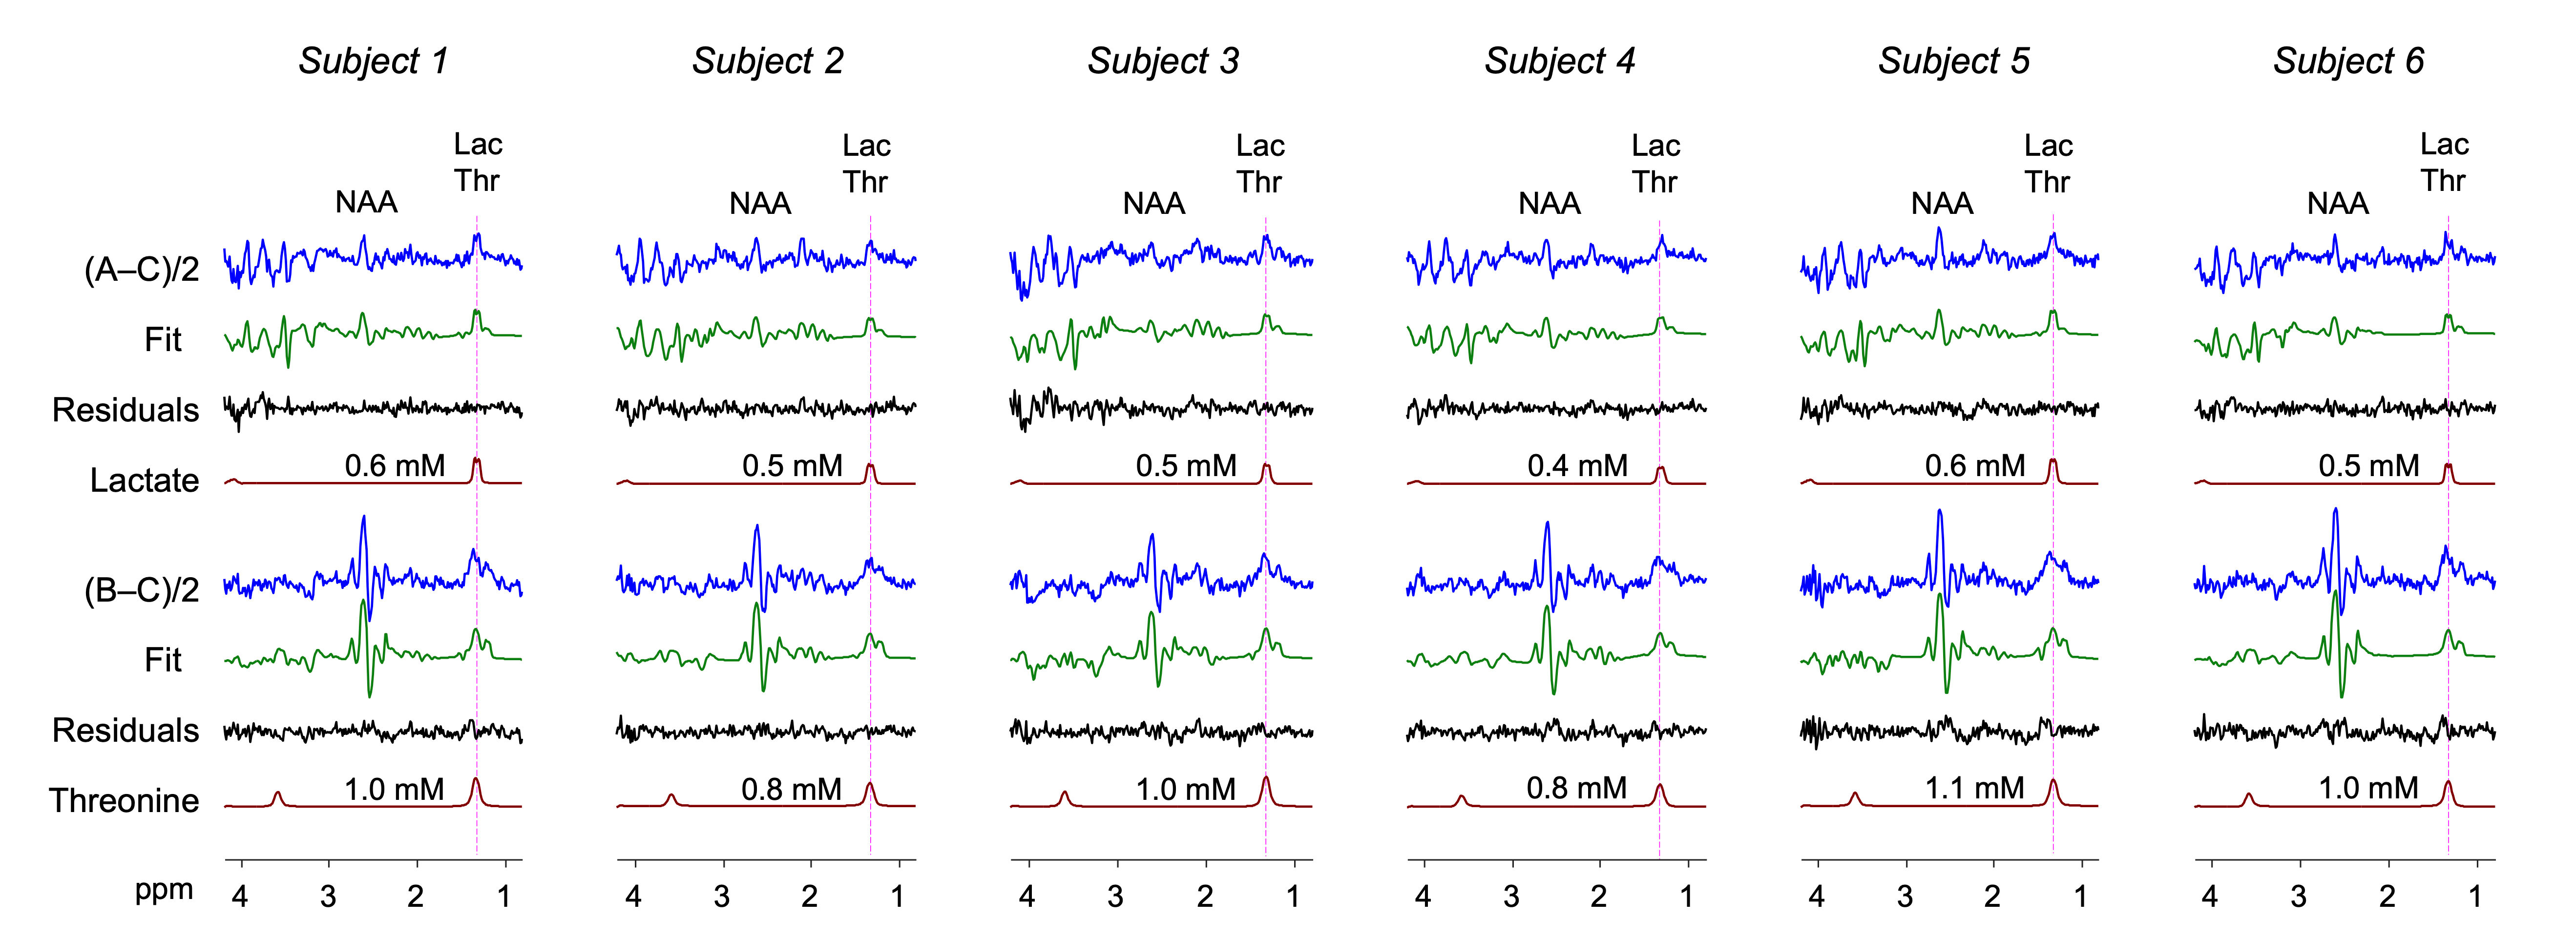
FIGURE 4. In vivo MEGA difference spectra from 6
healthy subjects are presented together with their spectral fitting outputs. LCModel-return
signals of lactate and threonine are shown with their millimolar concentration
estimates. Lactate was excluded in the fitting of the (B–C)/2 spectrum while threonine was excluded in the fittings of the (A–C)/2 data. Spectra
were normalized to the unsuppressed water signal amplitude in each subject.
DOI: https://doi.org/10.58530/2023/0358