0357
In vivo Whole-brain Downfield Metabolites Mapping using 2π-CASP-EPSI at 7T1Support Center for Advanced Neuroimaging (SCAN), University of Bern, Bern, Switzerland, 2Translational Imaging Center, sitem-insel, Bern, Switzerland
Synopsis
Keywords: Pulse Sequence Design, Spectroscopy, Downfield MRSI
Many interesting metabolites, for instance adenosine triphosphate (ATP), glutathione (GSH) and homocarnosine (hCs), have resonances in the downfield range (>4.7 ppm) in 1H-MRS. Previous studies have studied the downfield spectra of metabolites in human brain using single-voxel spectroscopy (SVS) and, most recently, 2D one-slice MRSI. The study presents a 3D whole brain mapping sequence suited for downfield metabolites which does not require water suppression pulses.INTRODUCTION
There are substantially less studies on downfield (DF) in vivo MR-spectroscopy of the brain than upfield studies. There are several reasons for this; for example low sensitivity due to low concentrations, overlapping resonances and, in many cases, fast proton exchange. Although not all down field resonances are assigned yet, most of the metabolites could be assigned, for instance important metabolites like adenosine triphosphate (ATP), glutathione (GSH), phosphor creatine (PCr), glutamine (Gln) homocarnosine (hCs) [1], [2] and also alpha-glucose. Often, large volumes were studied using single voxel spectroscopy at low and midfield [3]. At (X)UHF, voxel sizes comparable to those of upfield MRS performed at low to midfield can be applied [1], [2]. Utilizing the fast exchange of many downfield protons, highly spatial resolved maps can be obtained indirectly by CEST-imaging [4]. Very recently, the very first 2D-MRSI method was proposed to map the downfield metabolites at 3T [5]. Here we report on an UHF EPSI-based [6] method for 3D whole brain metabolite mapping of the downfield spectrum in the human brain.METHODS
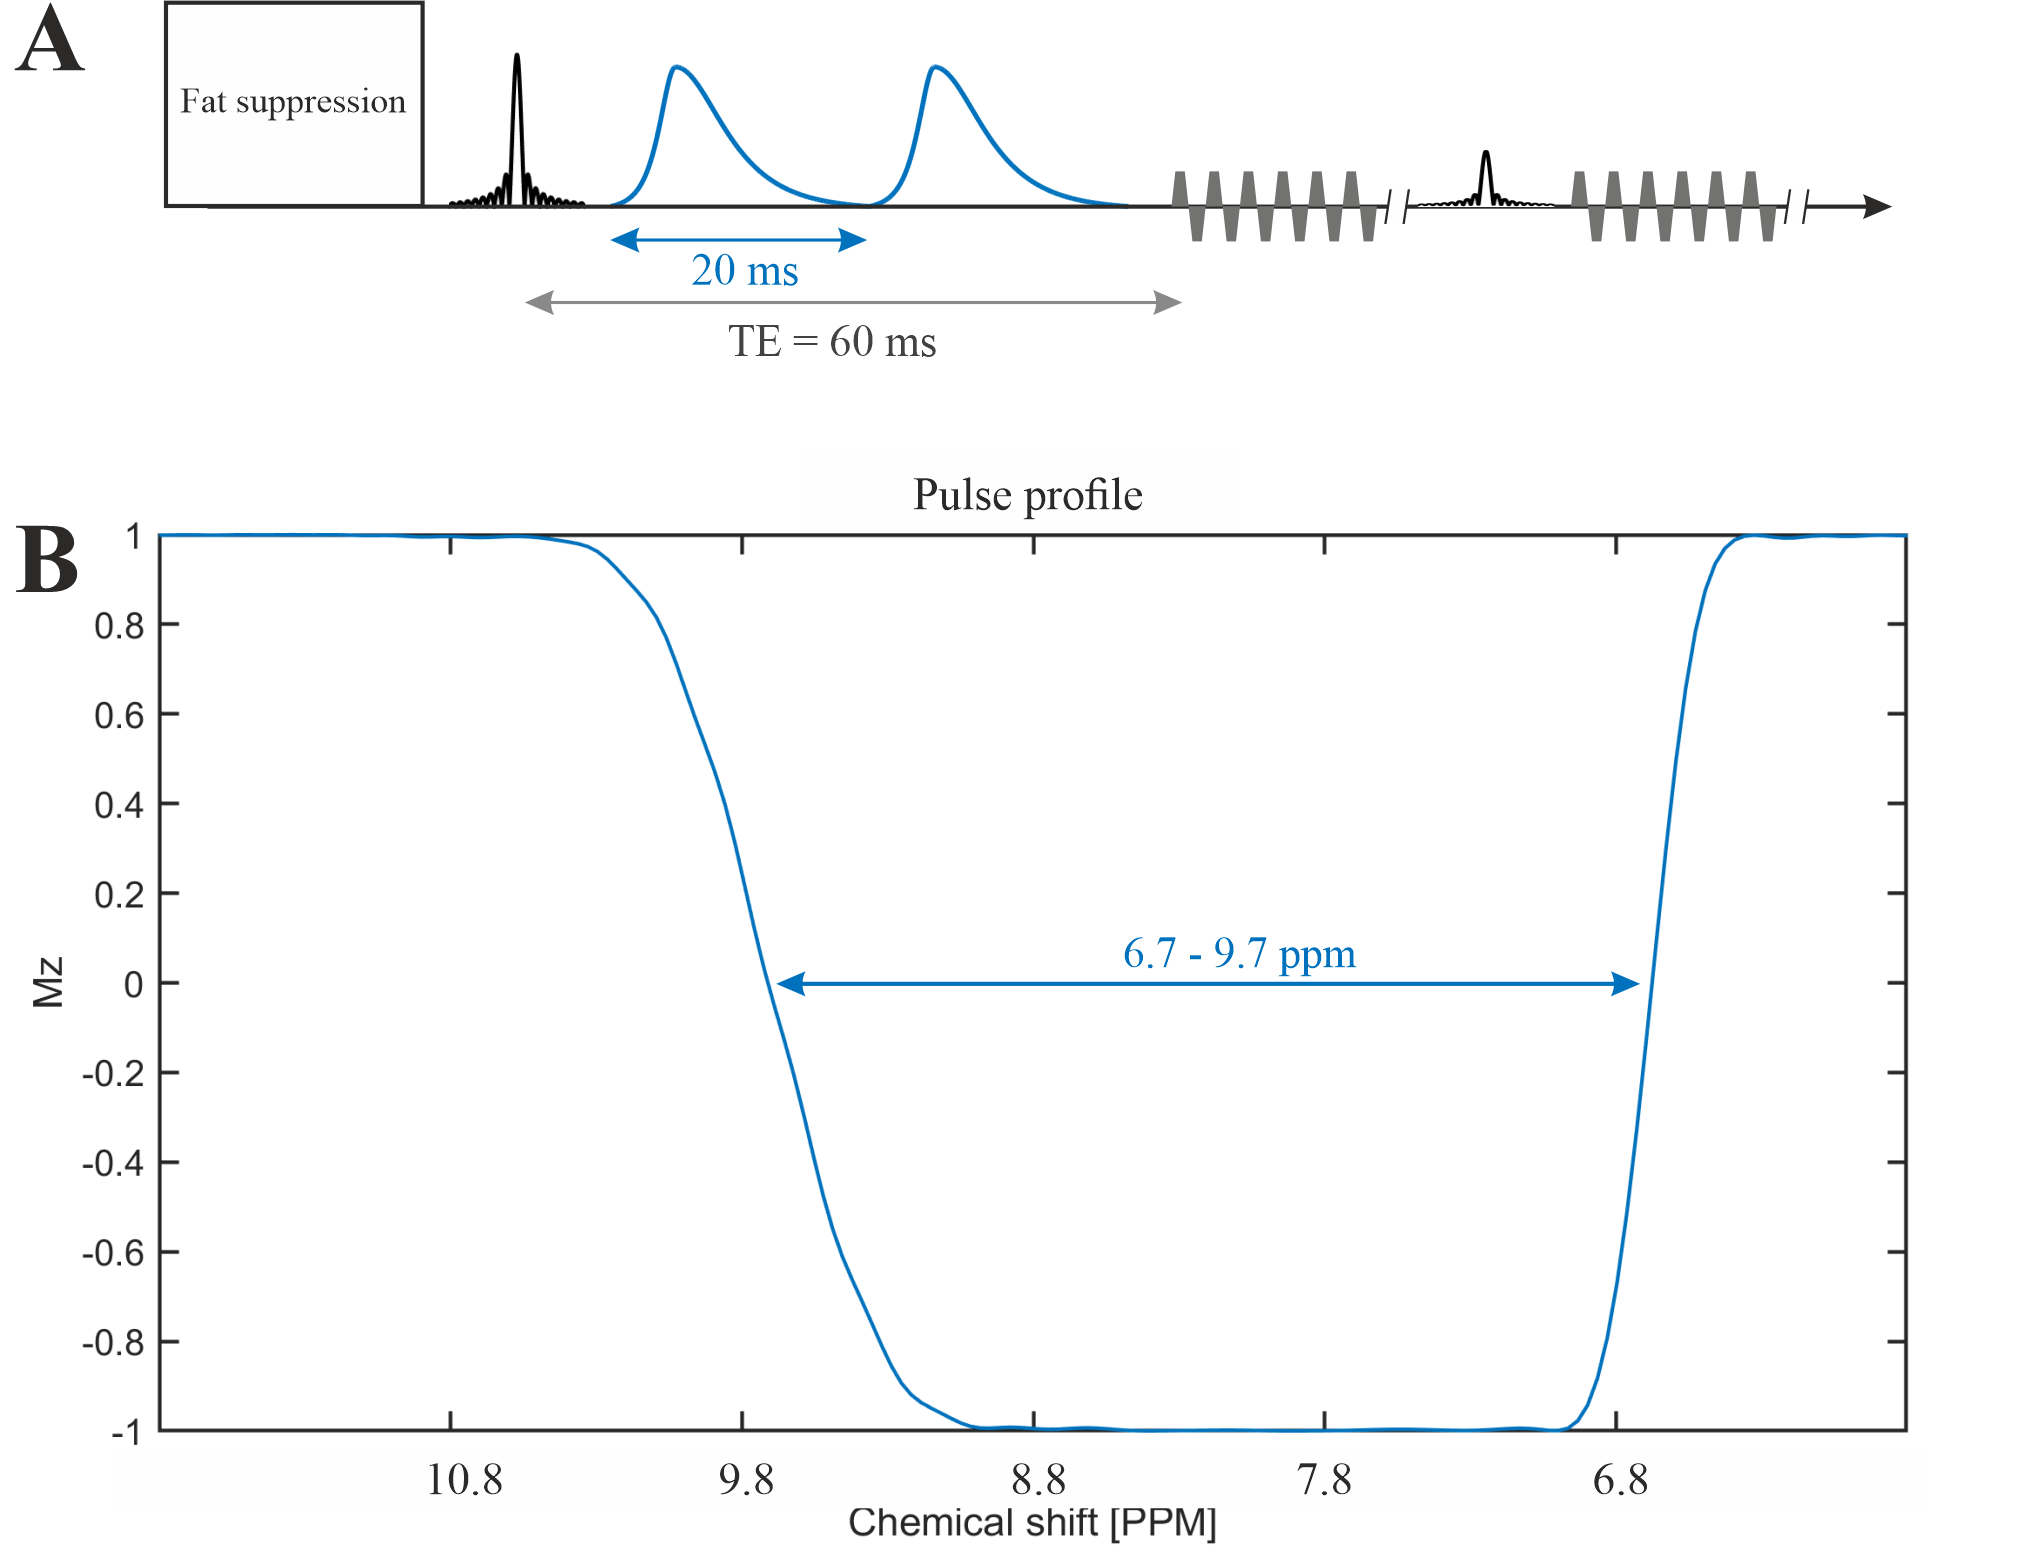
The MRSI was performed on a Siemens 7T scanner (MAGNETOM Terra, Germany) using the Nova 1Tx32Rx head coil (USA). One healthy subject (male, 35 years old) was measured.The 2π-CSAP-EPSI sequence [6], [7] (see Figure 1) with asymmetric 2π-CSAP [8] was applied with the following parameters:
TE = 60 ms, TR = 1300 ms, nominal matrix = 65 × 23 × 7 (4.3 × 7.8 × 10 mm), zero filling matrix = 65 × 42 × 8 (4.3 × 4.3 × 8.8 mm), FOV = 280 × 180 × 70 mm, averages = 14, and TA = 42 min. The refocusing/editing chemical-selective adiabatic pulse (2π-CSAP) is 20 ms duration. The bandwidth (full width at 50% maximum) ranges from 6.7 – 9.7 ppm (Figure 1B). An adiabatic inversion recovery pulse was used to suppressed lipid at around 5.5 ppm. However, no water suppression needs to be applied due to the implicit water suppression of the 2π-CSAP.
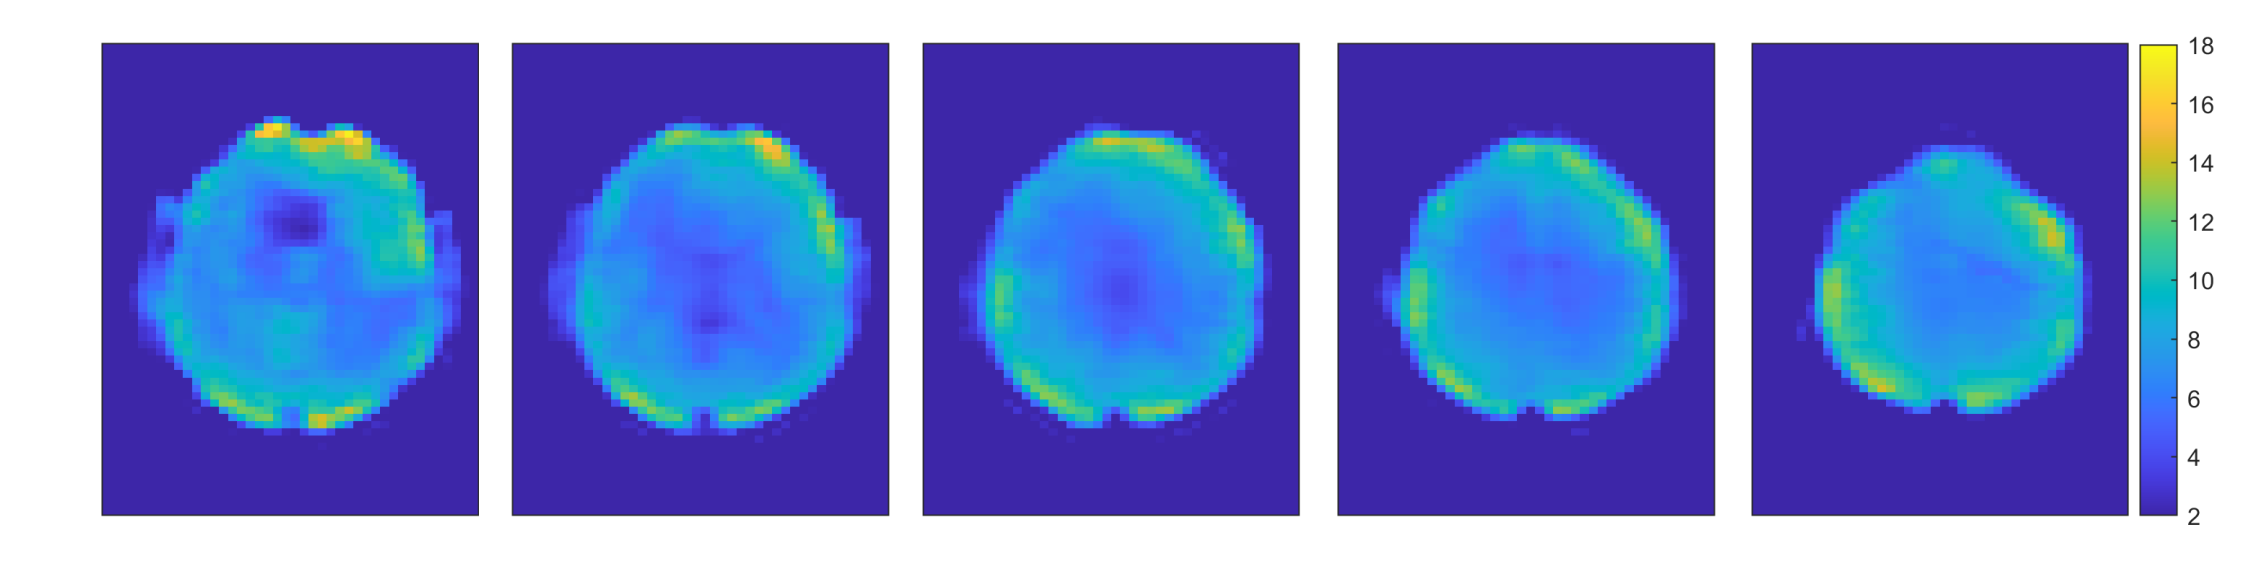
The DF (DownField) 7.02 (6.9-7.15 ppm; hCs/GSH), DF 7.82 (7.6-8.05 ppm; NAA), and DF 8.16 (8.05-8.35 ppm; ATP/GSH) maps were generated by absorption peak integration. The metabolites signal was voxel wise divided by the water reference signal to correct B1+-inhomogeneities of the non-adiabatic excitation pulse and B1--inhomogeneities due to received coils.
RESULTS and DISCUSSION
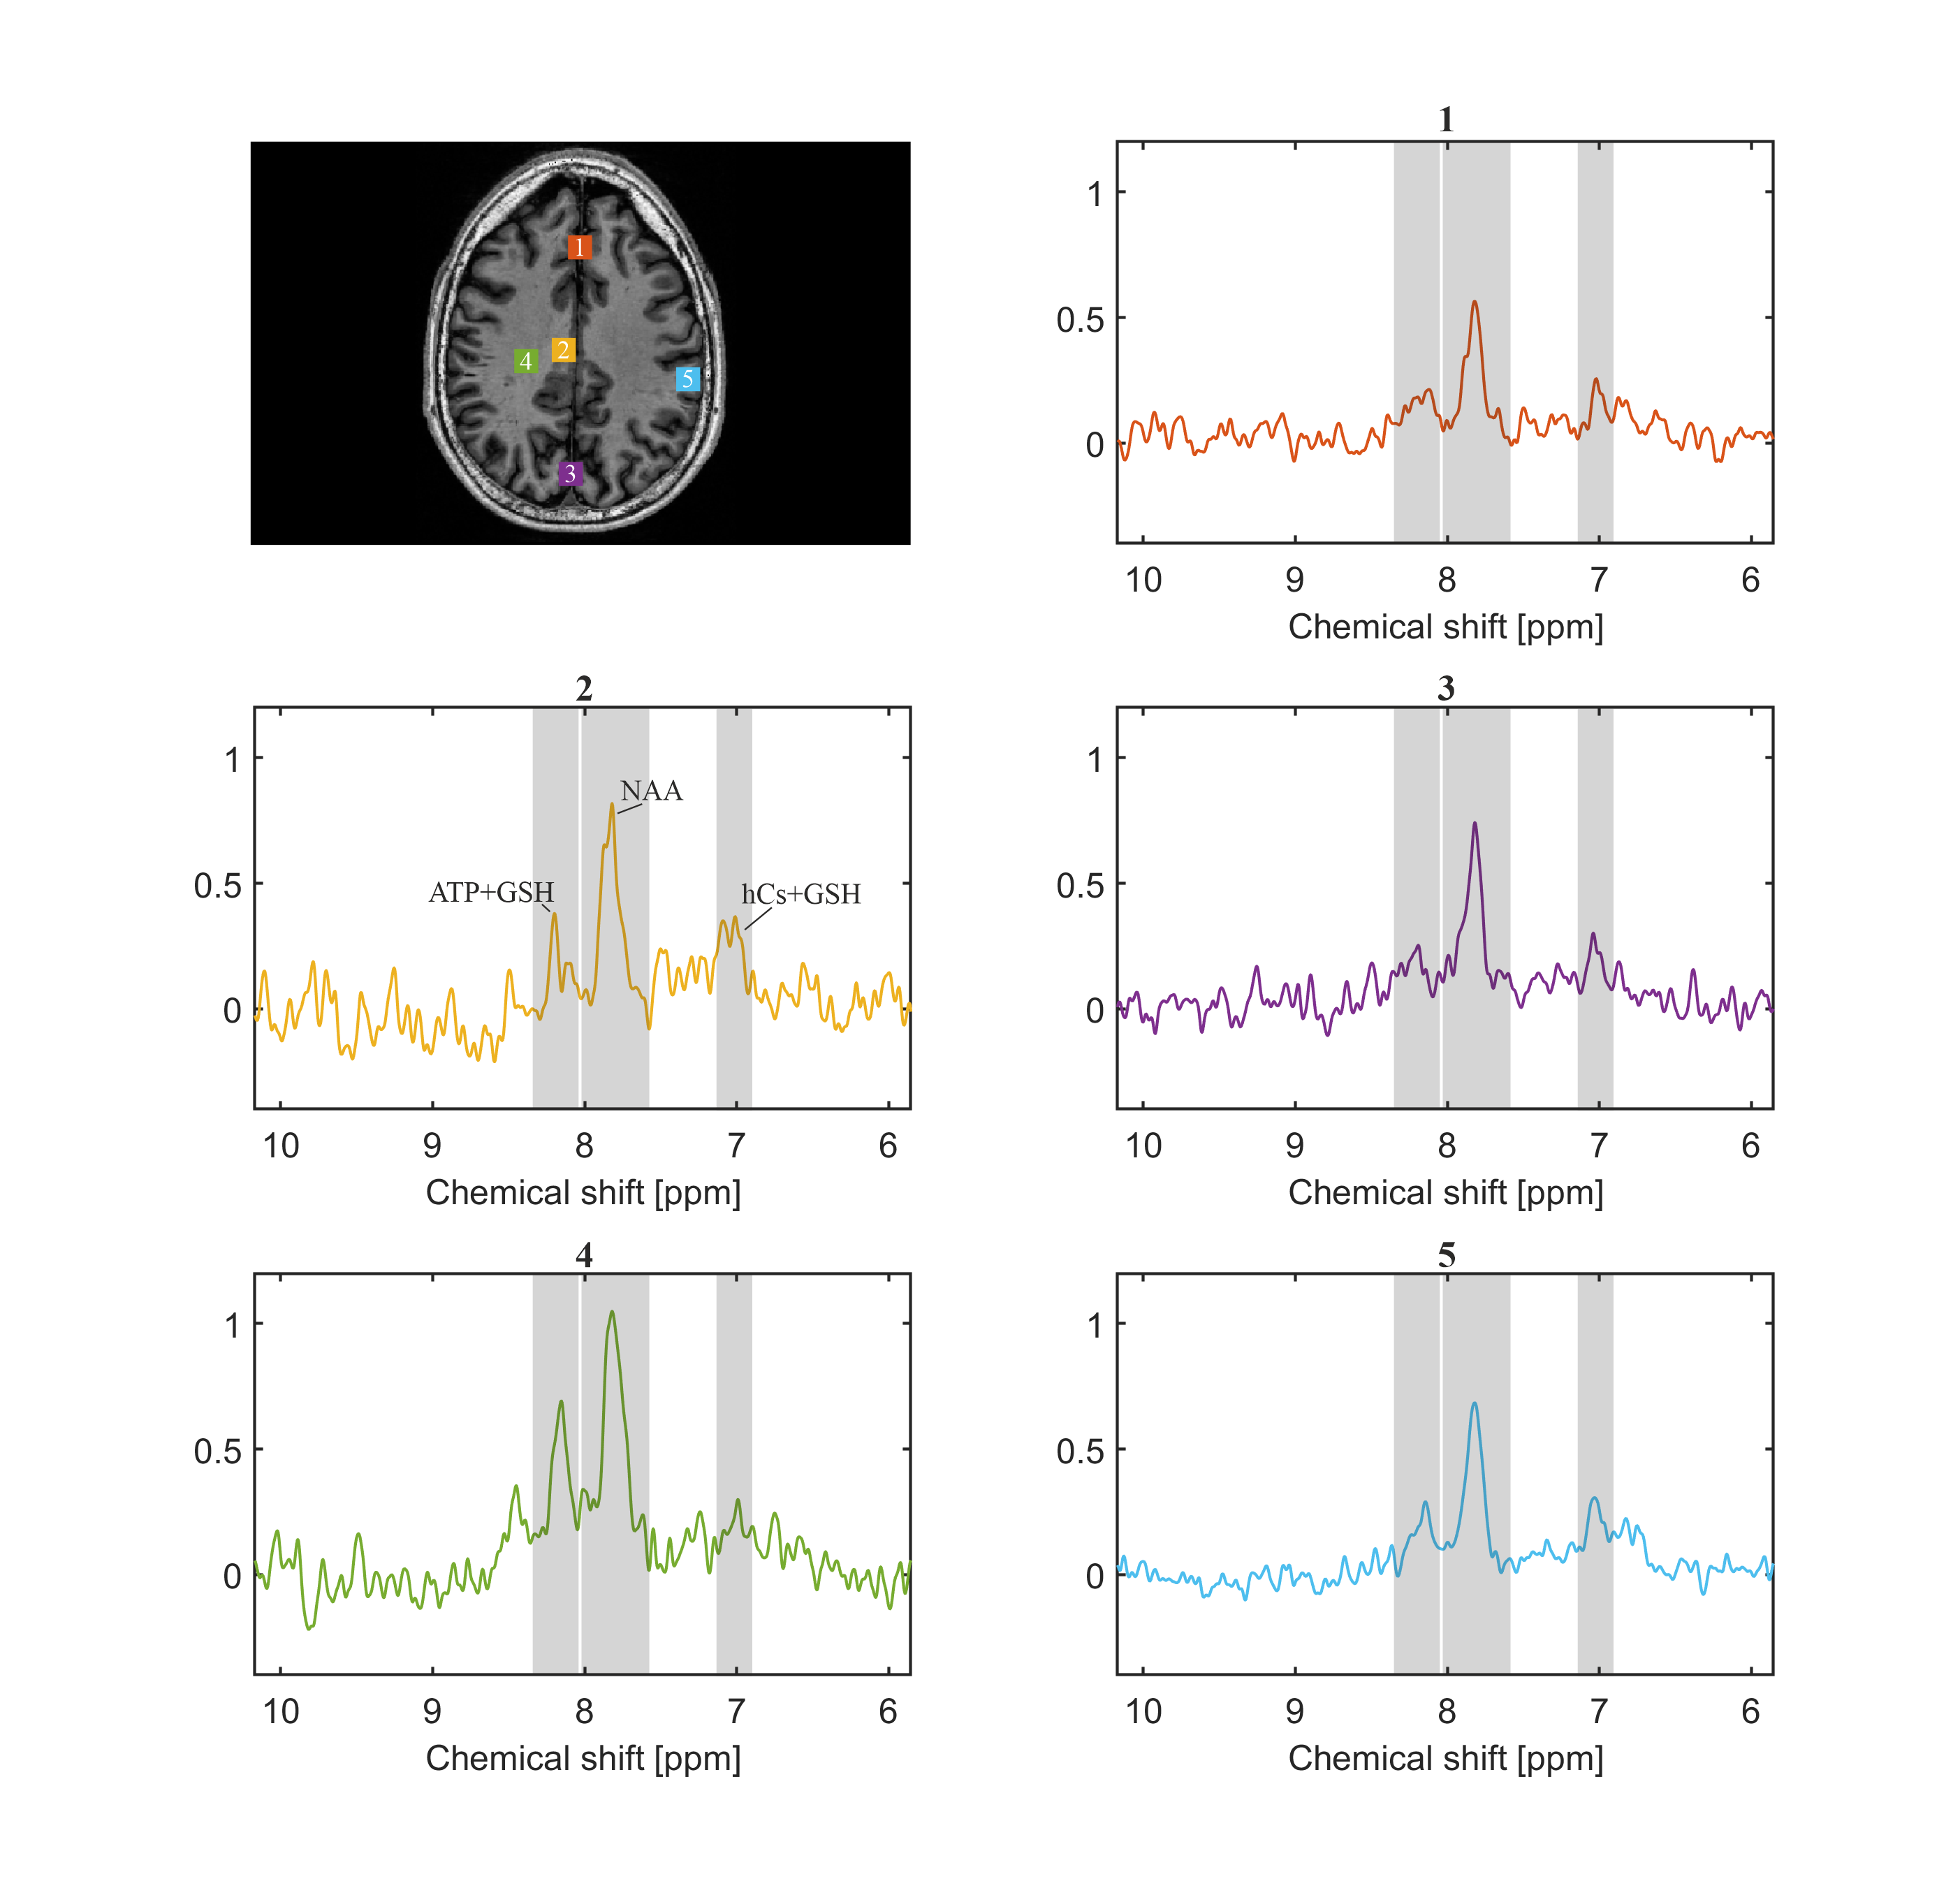
Figure 2 shows the spectra of the sum of 9 voxels (12.9 × 12.9 × 8.8 mm, 1.46 ml) at different locations. The peak DF 7.02 is likely attributable to homocarnosine (hCs) and glutathione (GSH), the peak DF 7.82 is mainly attributable to NAA, and the peak DF 8.16 is most likely representing GSH and adenosine triphosphate (ATP) [1], [2], [5].The water reference maps were generated by absorption peak integration and are shown in Figure 3.
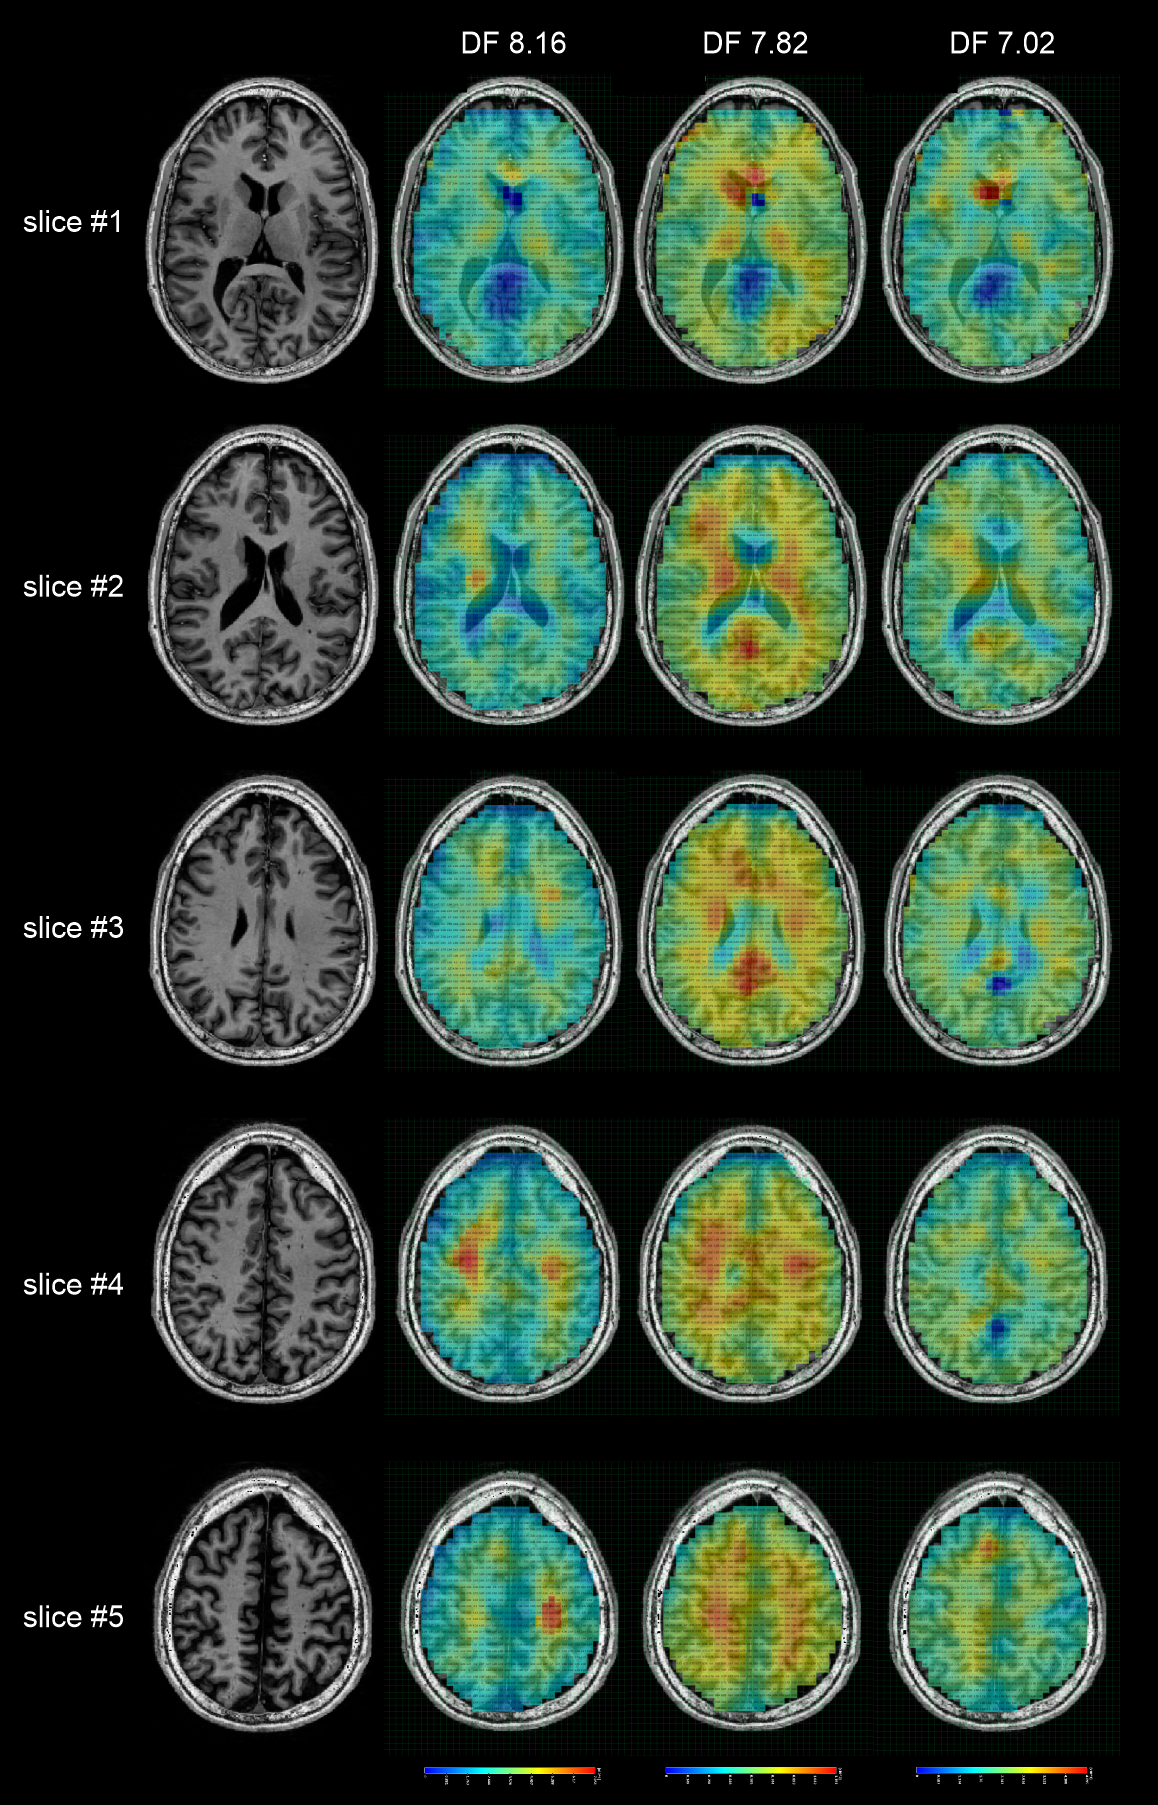
The peak integration maps of DF 7.02, DF 7.82, and DF 8.16 are shown in Figure 4, and integration intervals are listed in the legend. The DF 7.82 level, which is mainly due to NAA, shows a trend towards a general WM/GM difference, higher in grey matter, and lower in white matter. This is consistent with the upfield NAA maps reported in the literature [9]. The result indicates that the DF 7.02 and the DF 8.16 levels are also not uniformly distributed over the entire brain. The left-right asymmetric hot spot for DF 8.16 on slice #5 may be caused by baseline fluctuation related to EPSI-readout and is less likely to be of physiologic nature.
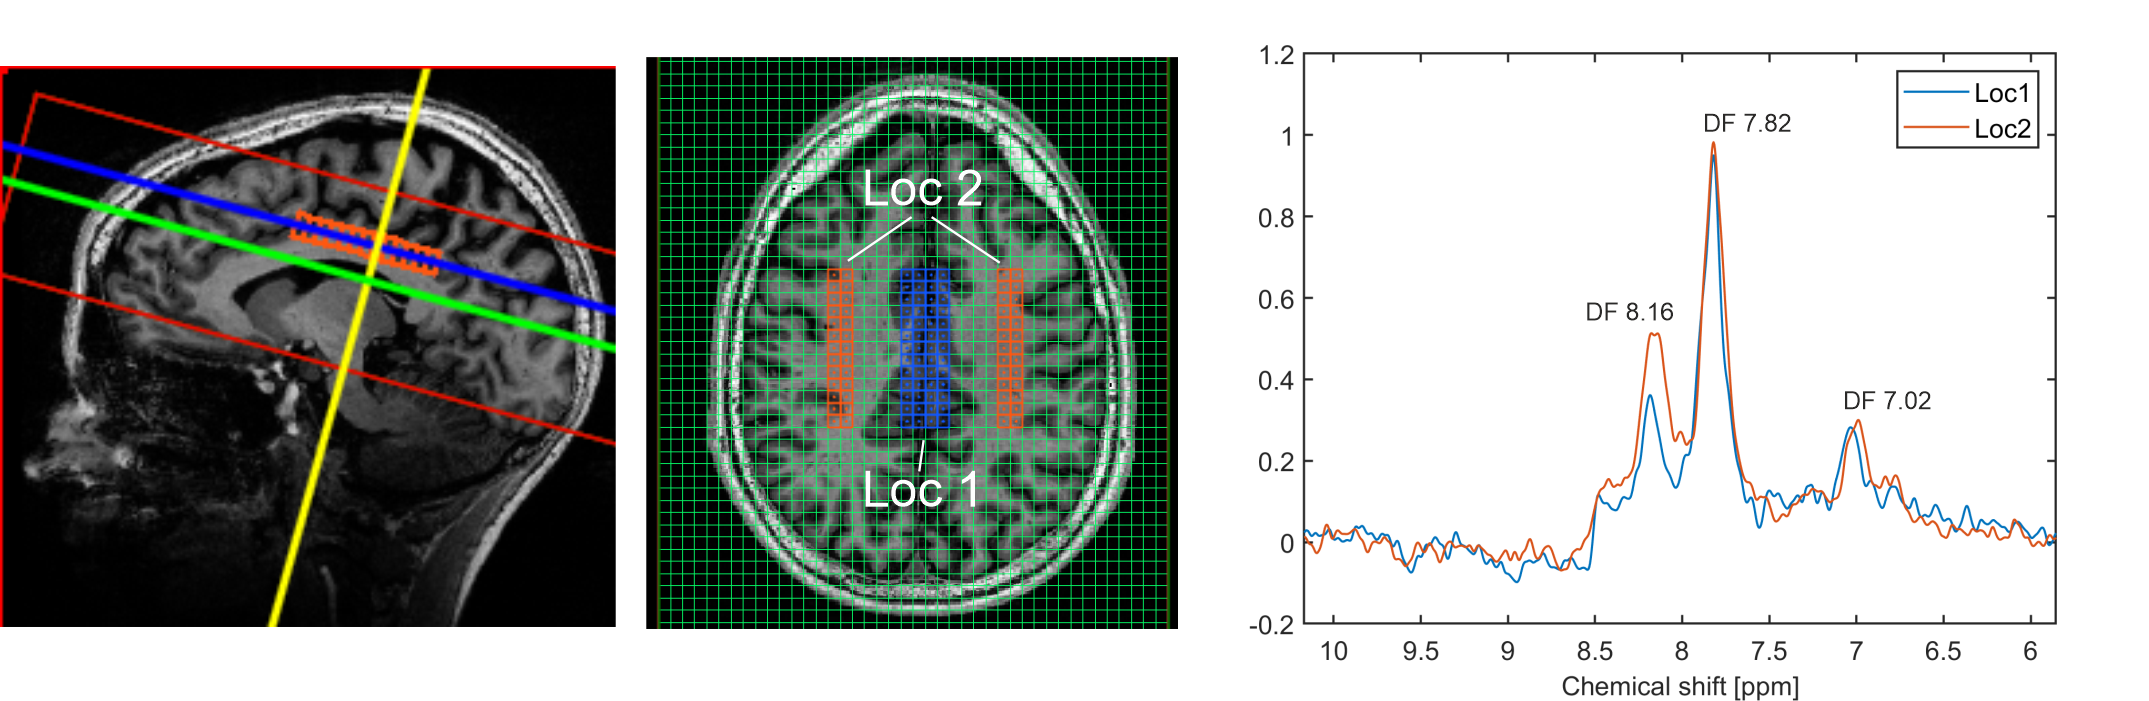
Figure 5 illustrates two spectra stemming from larger volumes (52 voxels, 8.46 ml) located in the grey matter (GM), and the white matter (WM). The signal difference between GM and WM at DF 8.16 is very clearly observable.
CONCLUSION
To our best knowledge, this is the first work to show the feasibility of 1H-MRSI based whole brain downfield metabolites mapping in humans. Due to the superior frequency-selective properties of the 2π-CSAP a close-to-perfect water and lipid suppression can be obtained, enabling simple peak integration for mapping, which is on its own an astonishing feature for UHF 2π-CSAP-based MRSI. The results of downfield NAA-maps are consistent with upfield NAA-maps. The quality of the metabolic maps could be further improved by applying model fitting which includes a baseline as well. Measurement time could be reduced by accelerated readout schemes as well as noise removal algorithms to shorten the measurement time such that it becomes clinically applicable.Acknowledgements
The research is supported by the Swiss National Science Foundation (SNSF-182569).References
[1] N. D. Fichtner et al., “In vivo characterization of the downfield part of 1H MR spectra of human brain at 9.4 T: Magnetization exchange with water and relation to conventionally determined metabolite content,” Magn Reson Med, vol. 79, no. 6, pp. 2863–2873, Jun. 2018, doi: 10.1002/MRM.26968.
[2] T. Borbath, S. Murali-Manohar, A. M. Wright, and A. Henning, “In vivo characterization of downfield peaks at 9.4 T: T2 relaxation times, quantification, pH estimation, and assignments,” Magn Reson Med, vol. 85, no. 2, pp. 587–600, Feb. 2021, doi: 10.1002/MRM.28442.
[3] M. Dziadosz, M. Hoefemann, A. Döring, M. Marjańska, E. J. Auerbach, and R. Kreis, “Quantification of NAD+ in human brain with 1H MR spectroscopy at 3 T: Comparison of three localization techniques with different handling of water magnetization,” Magn Reson Med, vol. 88, no. 3, pp. 1027–1038, Sep. 2022, doi: 10.1002/MRM.29267.
[4] K. M. Ward, A. H. Aletras, and R. S. Balaban, “A new class of contrast agents for MRI based on proton chemical exchange dependent saturation transfer (CEST),” J Magn Reson, vol. 143, no. 1, pp. 79–87, 2000, doi: 10.1006/JMRE.1999.1956.
[5] M. Považan, M. Schär, J. Gillen, and P. B. Barker, “Magnetic resonance spectroscopic imaging of downfield proton resonances in the human brain at 3 T,” Magn Reson Med, vol. 87, no. 4, pp. 1661–1672, Apr. 2022, doi: 10.1002/MRM.29142.
[6] A. Ebel and A. A. Maudsley, “Improved spectral quality for 3D MR spectroscopic imaging using a high spatial resolution acquisition strategy,” Magn Reson Imaging, vol. 21, no. 2, pp. 113–120, 2003, doi: 10.1016/S0730-725X(02)00645-8.
[7] G. Weng et al., “SLOW: A novel spectral editing method for whole‐brain MRSI at ultra high magnetic field,” Magn Reson Med, vol. 88, no. 1, pp. 53–70, Jul. 2022, doi: 10.1002/mrm.29220.
[8] J. Slotboom et al., “Proton Resonance Spectroscopy Study of the Effects of L-Ornithine-L-Aspartate on the Development of Encephalopathy, Using Localization Pulses with Reduced Specific Absorption Rate,” J Magn Reson B, vol. 105, no. 2, Oct. 1994, doi: 10.1006/jmrb.1994.1114.
[9] A. Klauser, P. Klauser, F. Grouiller, S. Courvoisier, and F. Lazeyras, “Whole-brain high-resolution metabolite mapping with 3D compressed-sensing SENSE low-rank 1H FID-MRSI,” NMR Biomed, vol. 35, no. 1, p. e4615, Jan. 2022, doi: 10.1002/NBM.4615.
[10] J. Slotboom, A. Nirkko, C. Brekenfeld, and D. van Ormondt, “Reliability testing of in vivo magnetic resonance spectroscopy (MRS) signals and signal artifact reduction by order statistic filtering,” Meas Sci Technol, vol. 20, no. 10, p. 104030, Sep. 2009, doi: 10.1088/0957-0233/20/10/104030.
Figures