0356
Multi-echo functional MRS Glutamate measurements in visual cortex at 3T1Division of psychology, communication and human neuroscience, Faculty of biology, medicine and health, University of Manchester, Manchester, United Kingdom, 2Geoffrey Jefferson Brain Research Centre, Manchester Academic Health Science Centre, Manchester, United Kingdom, 3Division of Informatics, Imaging and Data Science, University of Manchester, Manchester, United Kingdom
Synopsis
Keywords: Data Acquisition, Spectroscopy, Functional MRS, multi-echo MRS, 3T, glutamate, creatine (Cr), N-Asetyl-Aspartate (NAA)
fMRS studies have shown dynamic change in glutamate (Glu) concentrations during visual stimulation. Here, we examine the effect of TE from 9.3-280ms on the signal during fMRS acquisition and whether T2 relaxation parameters change during a visual task compared to rest. We observed a short Glu T2-compartment between 2.5-4.5ms arising from 48% (rest) and 16% (active) of the total signal with significant increase in Glu signal at TE =140ms during stimulation. These preliminary results indicate bi-exponential decay of Glu in the visual cortex at 3T encouraging future work with more robust fMRS paradigms.
Introduction
Functional MRS allows measurement of dynamic change in metabolite concentration in response to neural stimulation. The biophysical basis of these changes remains unclear. In vitro studies have indicated that glutamate (Glu) within the vesicles may be invisible to 1H-MRS due to very short T2 relaxation times1–3. One hypothesis suggests that increase or decrease in glutamate signal detected by fMRS, could be due to neurotransmitter movements from one cellular compartment (short-T2, largely invisible presynaptic vesicles) to another (long-T2, largely visible extracellular and cytosolic neurotransmitter compartments) where it is more detectable by functional MRS4,5. Most studies reporting Glu T2 values only sample echo times (TE) within the range of 30 - 450ms6–8 which is not adequate to observe a compartment with short T2 (< 20ms). Here, we acquire Glu at a range of TE values between 9.3 - 280ms to examine whether there is a short-echo compartment of Glu in vivo and whether we can detect Glu shift between compartments at longer TE.Methods
Experimental design and fMRS/MRS acquisition: Data were acquired in 17 healthy participants (4 males; mean age 26.3 ± 2.7 years) on 3T Philips Achieva MR system using an fMRS paradigm taken from9. A 2 x 2 x 2 voxel was positioned in the occipital cortex (OCC), centred along the midline. The metabolite spectra were acquired during an 80 minute visual paradigm using SV STEAM over 7 TEs (TE = 9.3/13/20/35/70/100 or 140/280ms), TR = 2000ms, TM = 16ms, 1024 spectral points, and 2000Hz spectral width, while participants performed a flashing checkerboard task consisted of 4 blocks with 8 trials of interleaved rest (REST 64s-OFF) and visual stimulation (ACTIVE 64s-ON) over 7 conditions, one for each TE (Fig. 1 & 2). To account for macromolecular (MM) resonances present at 3T, a nulled metabolite spectrum with water reference was acquired using inversion recovery (IR) STEAM sequence over 5 TEs (TE = 9.3 – 70/TR = 2000/TM = 16/TI = 600ms) 10. The MM acquisition block preceded the fMRS acquisition block with overall scan time being 120 minutes (Fig 2). The order of TEs was randomised for each participant.Analysis: REST and ACTIVE metabolite spectra were fitted and quantified with a standard processing pipeline in time-domain JMRUI QuasarY algorithm (Fig 3C, 3D). TE70ms was excluded from the analysis due to poor quality. NMR-Scope-B was used to generate TE-appropriate basis sets employing Philips pulse shapes, which consisted of 6 metabolites and measured spectrum of macromolecules (Fig. 3A, 3B). The statistical significance of changes in metabolite signal intensities during activation was assessed by paired t-test.
Results
The signal was adjusted for T1 effects6 and the data for each participant was normalised to the first data point and then averaged across participants. We fitted the T2 relaxation ACTIVE and REST curve for Glu, Cr and NAA with monoexponential and biexponential fits across 7 averaged data points using the MATLAB function “fitnlm”. The best fit was assessed using Akaike information criterion (AIC). We found evidence of biexponential decay for Glu, Cr and NAA (Fig. 4). Glu, Cr and NAA fit parameters indicate the existence of 2 compartments that contribute to the total signal as follows: Glu-REST short-T2 compartment (T2 = 4.5ms) contributes 48% of the signal, long-T2 compartment (T2 = 148 ms) contributes 52% of the signal. Glu-Active short-T2 compartment (T2 = 2.5ms) contributes 16% of the signal, long-T2 compartment (T2 = 148ms) contributes 84% of the signal. Cr REST short-T2 compartment (T2 = 0.71ms) contributes < 1% of the signal, long-T2 compartment (T2 = 108ms) contributes to over 99% of the signal. NAA-REST short-T2 compartment (T2 = 7ms) contributes 39% of the signal, long-T2 compartment (T2 = 174ms) contributes 61% of the signal. NAA-ACTIVE short-T2 compartment (T2 = 9ms) contributes 34% of the signal, long-T2 compartment (T2 = 186ms) contributes 66% of the signal. Significant increase in Glu signal following stimulation was observed at TE 140ms during first REST-ACTIVE block, t(3) = -3.18, p = 0.02 (Table 1, Table 2).Discussion
We found evidence of biexponential decay for glutamate with components putatively corresponding to cytosolic (long-T2) and vesicular (short-T2) compartments, with the significant increase in Glu signal in long-T2 compartment (TE=140ms) during activation. While the biexponential model fits the Cr data better, the parameters it gives are not physiologically plausible and require further investigation. Biexponential decay for NAA was unexpected and could suggest short-T2 myelinic NAA compartment in oligodendrocytes11. Most studies investigating glutamate T2 decay have used minimum TE ≥ 30ms which is not appropriate to observe a compartment with a T2 much shorter than 30ms. In our exploratory study, we implemented the minimum TE 9.3ms which should be more sensitive to compartments with rapid T2-decay. Our findings for the long-T2 compartment for Glu and NAA are in agreement with empirical literature using monoexponential fits and the minimum TE ≥ 30ms.Conclusion
These results provide preliminary evidence of bi-exponential decay for Glu, Cr and NAA in the visual cortex at 3T. The bi-exponential fits suggest that there is short and long T2 compartment for Glu with a compartmental shift occurring from short to long T2 compartment during increase in Glu signal at long TE during stimulation.Acknowledgements
The authors sincerely appreciate the support of the CRF MRI Research Centre radiographers, the volunteers who participated in this study and the research assistant Amy Stephen who helped with the data acquisition. This project is supported by the medical research council grant (MRC) and the MCRF imaging grant.
References
1. Kauppinen RA, Pirttila T-RM, Auriolat S 0 K, Williamst SR. Compartmentation of Cerebral Glutamate in Situ as Detected by 1H/13C n.m.R. Vol 298.; 1994. doi:https://doi.org/10.1042/bj2980121
2. Kauppinen RA, Williams SR. Nondestructive Detection of Glutamate by 1H Nuclear Magnetic Resonance Spectroscopy in Cortical Brain Slices from the Guinea Pig: Evidence for Changes in Detectability During Severe Anoxic Insults. J Neurochem. 1991;57(4):1136-1144. doi:10.1111/j.1471-4159.1991.tb08271.x
3. Lea-carnall CA, El-deredy W, Williams SR, Stagg CJ, Trujillo-barreto NJ. A mean-field model of glutamate and GABA synaptic dynamics for functional MRS.
4. Jelen LA, King S, Mullins PG, Stone JM. Beyond static measures: A review of functional magnetic resonance spectroscopy and its potential to investigate dynamic glutamatergic abnormalities in schizophrenia. J Psychopharmacol. 2018;32(5):497-508. doi:10.1177/0269881117747579
5. Mullins PG. Towards a theory of functional magnetic resonance spectroscopy (fMRS): A meta-analysis and discussion of using MRS to measure changes in neurotransmitters in real time. Scand J Psychol. 2018;59(1):91-103. doi:10.1111/sjop.12411
6. Träber F, Block W, Lamerichs R, Gieseke J, Schild HH. 1H Metabolite Relaxation Times at 3.0 Tesla: Measurements of T1 and T2 Values in Normal Brain and Determination of Regional Differences in Transverse Relaxation. J Magn Reson Imaging. 2004;19(5):537-545. doi:10.1002/JMRI.20053
7. Wyss PO, Bianchini C, Scheidegger M, et al. In vivo estimation of transverse relaxation time constant (T2) of 17 human brain metabolites at 3T. Magn Reson Med. 2018;80(2):452-461. doi:10.1002/MRM.27067
8. Ganji SK, Banerjee A, Patel AM, et al. T2 measurement of J-coupled metabolites in the human brain at 3T. NMR Biomed. 2012;25(4):523-529. doi:10.1002/NBM.1767
9. Ip BI, Berrington A, Hess AT, Parker AJ, Emir UE, Bridge H. Combined fMRI-MRS acquires simultaneous glutamate and BOLD-fMRI signals in the human brain. Neuroimage. 2017;155:113-119. doi:10.1016/j.neuroimage.2017.04.030
10. Hui SCN, Gong T, Zöllner HJ, et al. The Macromolecular MR Spectrum in Healthy Aging. bioRxiv. 2021;(September):1-9. doi:10.1101/2021.08.27.457961
11. Nordengen K, Heuser C, Rinholm JE, Matalon R, Gundersen V. Localisation of N-acetylaspartate in oligodendrocytes/myelin. Brain Struct Funct. 2015;220(2):899-917. doi:10.1007/S00429-013-0691-7/FIGURES/10
Figures
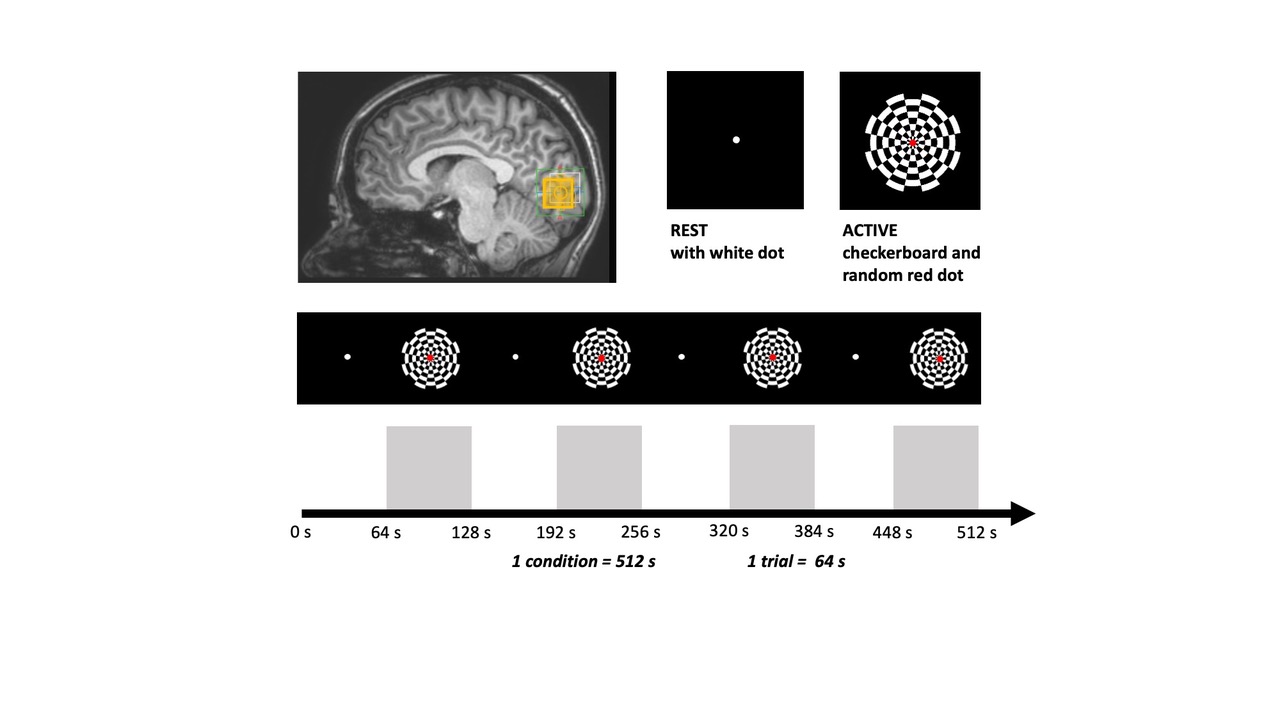
Figure 1. Experimental design was directly adapted from9 and showing stimulus conditions, consisting of 4 rest trials (black screen, REST-64 s) and 4 flashing checkerboard trials (ACTIVE-64 s) per condition. One REST-ACTIVE trial represents a single block. Data was collected over 7 conditions (4 REST-ACTIVE blocks), one for each TE in a 2 x 2 x 2 MRS voxel positioned in occipital cortex (yellow square). The experimental task lasted 80 minutes.
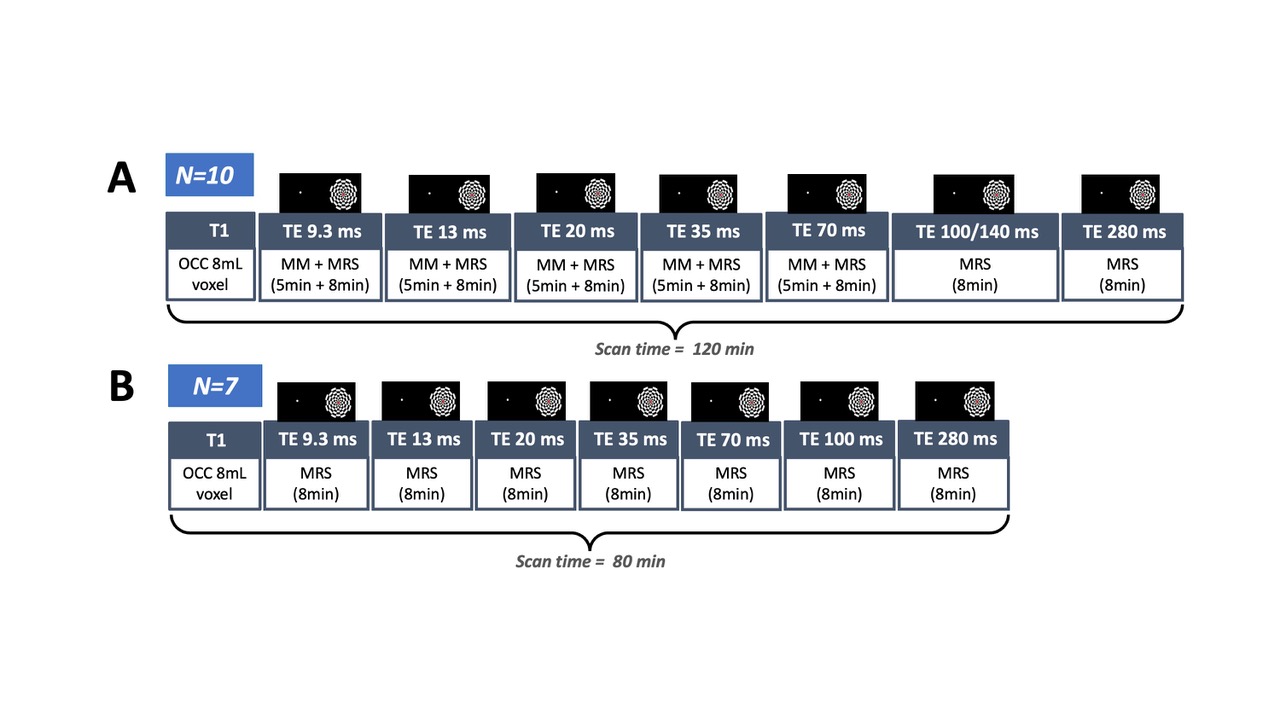
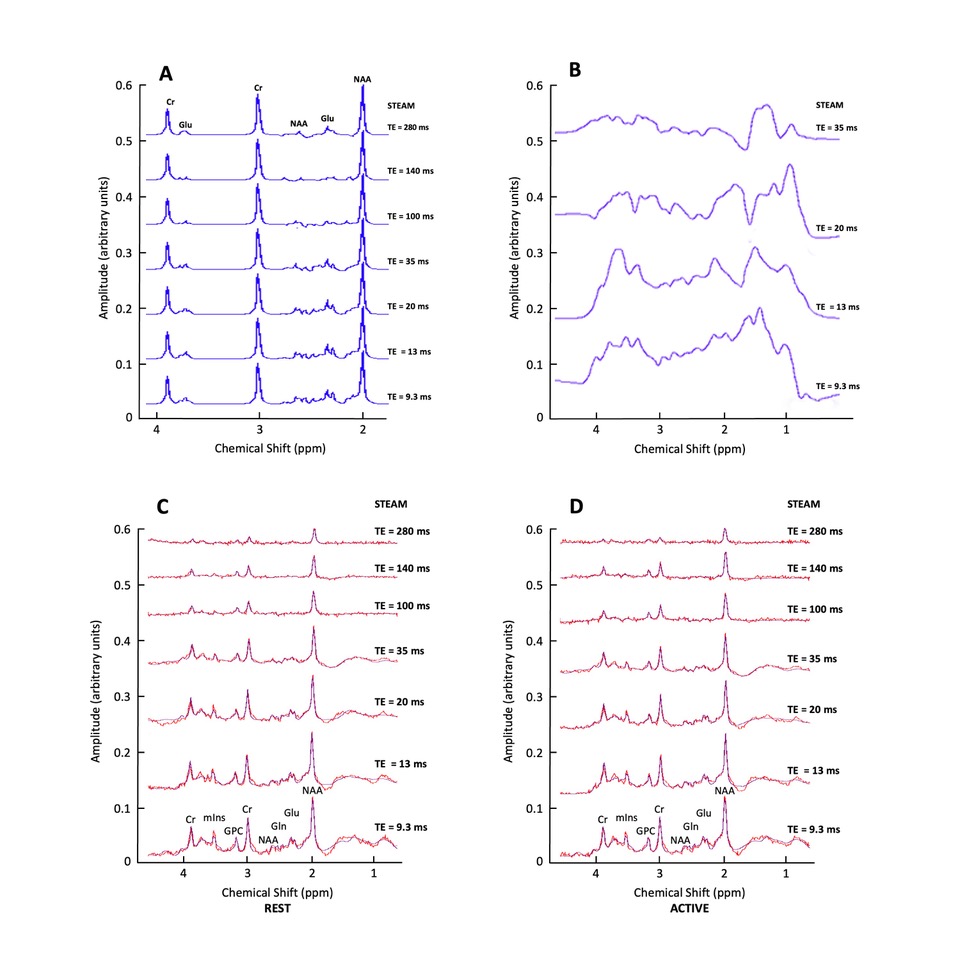
Figure 3. Simulated signals of Glu, Cr and NAA over 7 TE = 9.3-280ms; (B) Measured macromolecular spectrum collected over 4 TE = 9.3-35 ms; (C) Example of in vivo spectrum (in red) collected over 7 TE = 9.3-280 ms (participant 3 TE = 9.3/13/20/35/140/280; participant 11 TE =100 ms), shown together with JMRUI model fits (in blue) during Rest period and (D) visual stimulation.
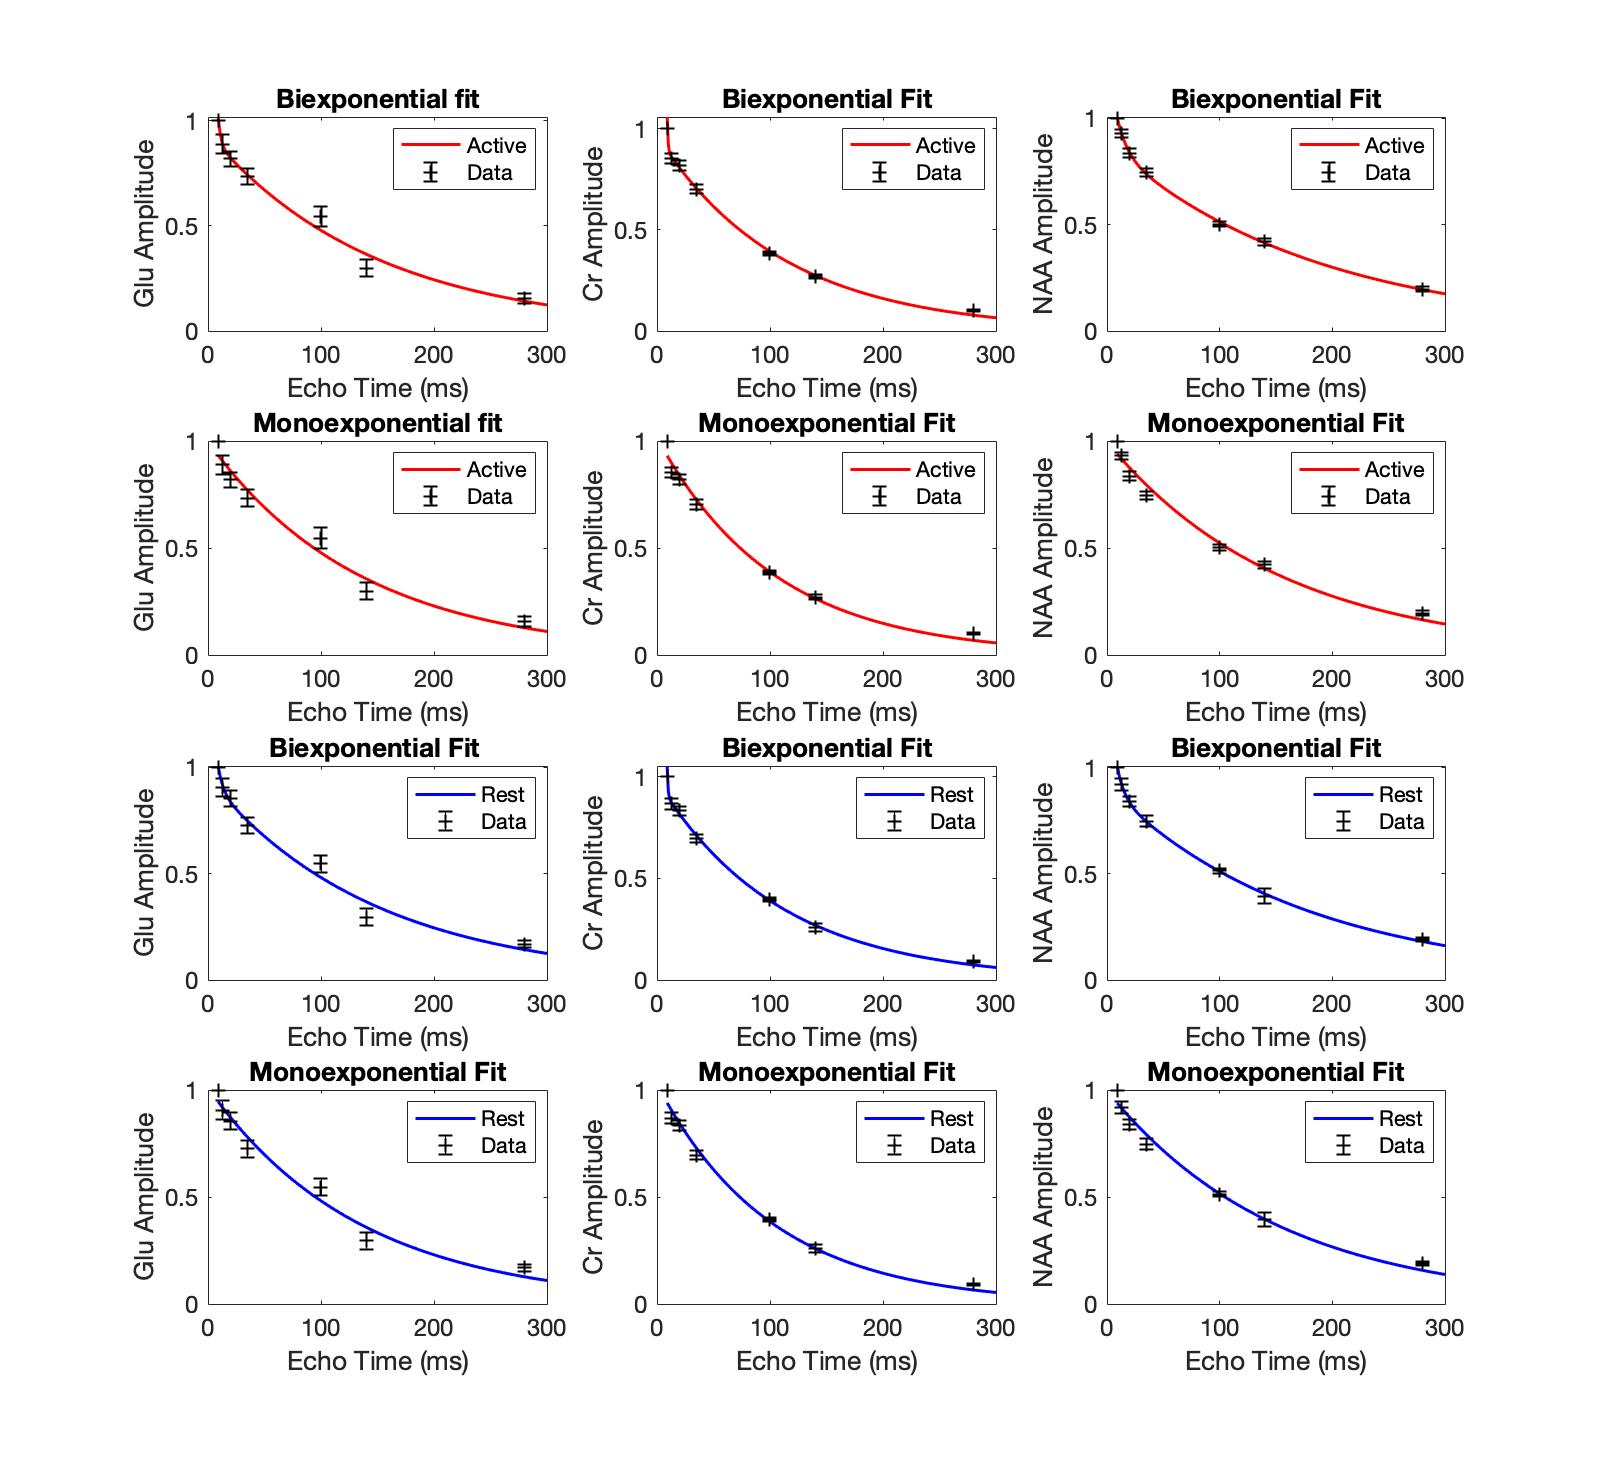
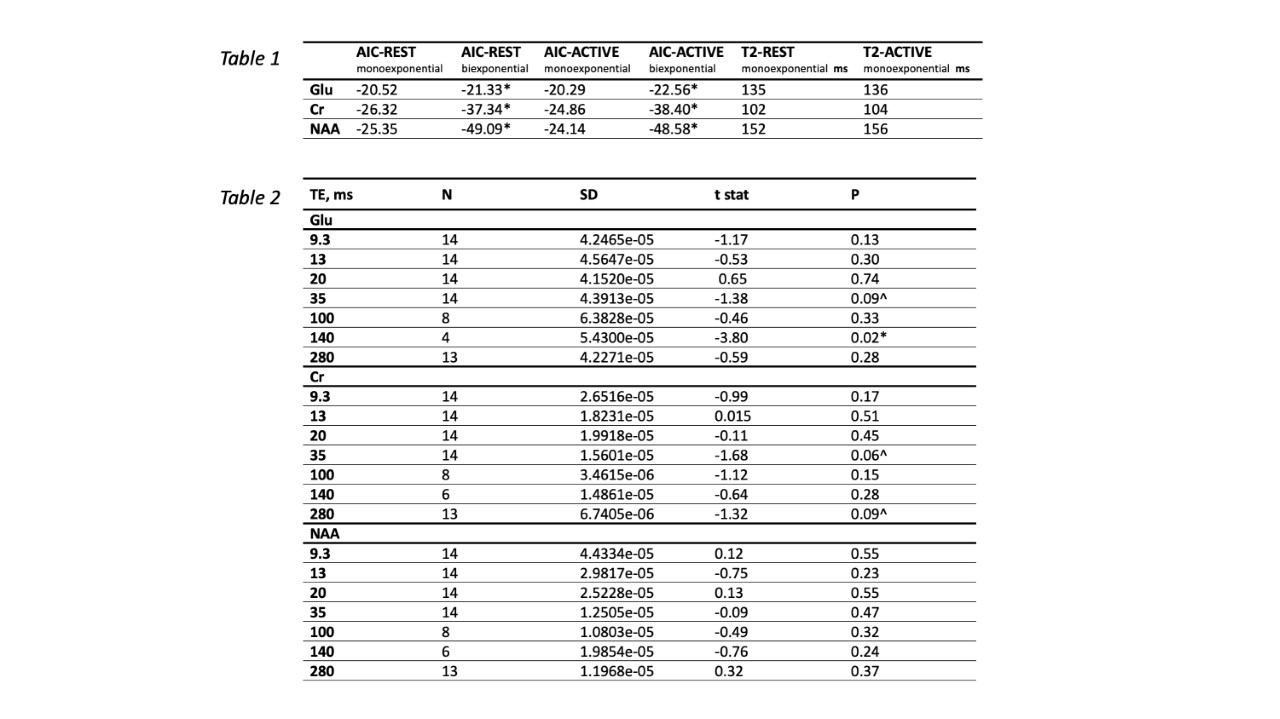
Table 1. Akaike criterion values for monoexponential and biexponential models, including T2 values for monoexponential fits. * Lower values indicate a winning model. Table 2. statistical results for paired t-tests for each echo time (TE) including standard deviation (SD), t statistic, significance level (p) and a number of participants in the sample per TE (N). p < 0.05*; ^ p < 0.1.