0349
Super-resolution algorithms for simultaneous 1H MRF/23Na MRI: Comparison between U-Net, PLS-regression, and hybrid methods
1Center for Biomedical Imaging, Radiology Department, NYU School of Medicine, New York, NY, United States, 2Vilcek Institute of Graduate Biomedical Sciences, NYU Langone Health, New York, NY, United States
Synopsis
Keywords: Data Processing, Non-Proton, Super-Resolution
We compared three algorithms to generate a high-resolution (HR) 23Na image from simultaneously-acquired low-resolution (HR) 23Na density-weighted MRI and HR 1H density, T1 and T2 maps from MRF in brain at 7 T: U-net, PLS-regression, and hybrid. The multi-scale structural similarity index between generated HR 23Na images and HR ground truth was higher than 0.95 for the three methods. Overall, the hybrid method showed better results, generating the sharpest HR image while keeping the highest similarity between the acquired and generated LR images.
Introduction
Sodium (23Na) MRI can reveal valuable metabolic information1. However, its low natural abundance in the human body and low gyromagnetic ratio practically prohibits the acquisition of high-resolution (HR) 23Na images. Therefore, developing post-processing methods to increase sodium resolution is critical for translating sodium MRI into clinical practice. In this work, we evaluate the performance of three super-resolution methods developed in-house: U-net, PLS-regression, and hybrid methods.Methods
DatasetThe methods were compared on simultaneously-acquired low-resolution (LR) sodium and HR proton density (PD), T1 and T2 maps2, 3. The images were acquired at 7T (MAGNETOM, Siemens) using an in-house developed 16-channel-Tx/Rx dual-tuned head coil4. Six volunteers were scanned (2 females, 32±12 years old) after informed consent, in accordance with the relevant institutional and national guidelines. The data from 5 volunteers was used for training the network and the other one for testing.
The 3D simultaneous 1H MRF/23Na MRI sequence parameters were: FOV 240×240×280 mm3,1H 160×160×56/23Na 84×84×56 matrix, 1H 1.5×1.5×5/23Na 2.85×2.85×5 mm3 resolution, 1H 7.5ms/23Na 15ms TR, 30º constant FA for 23Na, pulse train of 500 FAs for 1H, 1 slab, 6 shots per slab, 1H full radial/23Na center-out radial trajectories, total scan time 21 min. A ground truth HR 23Na image was acquired using a 3D radial GRE sequence, with the acquisition parameters adjusted to match the LR 23Na image contrast (2 averages, and total scan time 42 min). The resolution ratio between the HR and LR is 1.9 in both in-plane directions.
Super-resolution methods
1- U-Net method: The U-Net is a deep convolutional neural network architecture frequently used for super-resolution algorithms5,6. It is composed of a contracting path, an expanding path, and skip connections that allow the network to retain low-level features. The network was trained using 80×80 images as input and 160×160 targets. Each slice of the LR 23Na images was resized to 80×80 and additional proton data obtained from a repository7-9 was used to increase the number of total images. The network was trained using Stochastic Gradient Descent with a learning rate of 0.1, decreasing by 20% every 50 epochs for a total of 250 epochs. The loss function used was the Structural Similarity (SSIM)10. Fig. 1 shows a schematic diagram of the network.
2- PLS-regression method: This iterative method is built around a partial least squares regression (PLS) between HR images (generated from 1H data) and LR resolution images (generated from 23Na data). The method involves layers of deconvolution and convolution with the pre-calculated point spread functions (PSF). The number of inputs to the PLS regression increase iteration by iteration. Fig. 2 shows a schematic diagram of the algorithm and a detailed description is available in Rodriguez et al 11. The method does not need to be trained prior to its implementation.
3- Hybrid method: This is a combination of the U-net method with the PLS method. The HR sodium image generated from the U-Net method is deconvolved by the PSF of the HR sodium image and introduced in the PLS algorithm as the first intermediate result (red rectangle in Fig. 2).
Methods evaluation
To evaluate the methods, eight statistical parameters were calculated: the mean value, the standard deviation, and the spatial autocorrelation score (SAC)12 of the difference between the acquired and generated LR and HR 23Na images, the structural similarity index10 (SSIM), the multi-scale-SSIM13, the pattern-reconstruction-score14 (PRS), the root-mean-square error (RMSE), and the peak-signal-to-noise-ratio PSNR.
Results & Discussion
Fig. 3 shows the initial 1H and 23Na data acquired with 3D simultaneous 1H MRF/23Na MRI and the ground truth HR 23Na acquired with 3D radial GRE. Fig. 4 shows the acquired LR and ground truth 23Na images, the generated HR 23Na images, the LR 23Na generated from the 23Na HR image, and the differences between them for both LR and HR. Table 1 shows the statistical parameters calculated for each method.The three methods showed M-SSIM>0.95 between the generated HR image and the HR ground truth. The hybrid method showed better performance than the PLS method with fewer iterations. The hybrid method showed the highest similarity between generated and acquired LR images (i.e. the highest fidelity), while the U-Net method showed the highest similarity between the generated and the ground truth HR images. However, the generated HR image from U-net looks blurrier than the images generated from the other methods.
The fact that the highest similarity for the HR images is obtained with the U-Net method and the highest fidelity with the hybrid method suggests that further improvements can be obtained either by adding a fidelity term to the loss function of the U-Net or improving the hybrid method by alternating the PLS-regression iterations with the use of the U-Net. Another alternative to be investigated would be to introduce the HR proton images along with the LR sodium images in a multi-channel U-Net architecture.
Conclusion
We compared the performance of three super-resolution methods developed in-house to generate HR 23Na images. The final HR sodium image generated with each method showed high similarity to the HR sodium ground truth image (M-SSIM>0.95). The hybrid method showed better results, generating the sharpest HR image with the highest similarity between the acquired and generated LR images.Acknowledgements
The research reported in this publication was supported by the NIH/NIBIB grant R01 EB026456, and performed under the rubric of the Center for Advanced Imaging Innovation and Research, a NIBIB Biomedical Technology Resource Center (P41 EB017183).References
1. Madelin G, & Regatte R R. Biomedical applications of sodium MRI in vivo. J. Magn. Reson. Imag., 2013;38:511-529.
2. Yu, Z., Madelin, G., Sodickson, D. K., & Cloos, M. A. Simultaneous proton magnetic resonance fingerprinting and sodium MRI. Mag. Res. in Med. ,2020, 83(6), 2232-2242.
3. Yu, Z., Hodono, S., Dergachyova, O., Hilbert, T., Wang, B., Zhang B., Sodickson, D. K., Madelin, G., & Cloos, M. A. Simultaneous 3D acquisition of 1H MRF and 23Na MRI. Mag. Res. in Med., 2021, 83(6), 00:1-14.
4. Wang, B, Zhang, B., Yu, Z., Ianniello C., Lakshmanan K., Paska, J., Madelin, G., Cloos, M. & Brown, R.. A radially interleaved sodium and proton coil array for brain MRI at 7T. NMR Biomed. 2021, e4608.
5. Li, Z., Yu, J., Wang, W., Zhou, H., Yang, H., & Qiao, Z. DeepVolume: Brain Structure and Spatial Connection-Aware Network for Brain MRI Super-Resolution. IEEE Trans. Cybern. 2021, (7) 51.
6. Lu, Z., & Chen, Y. Single image super-resolution based on a modified U-net with mixed gradient loss. Signal Image Video Process. 2022, 16:1143–1151.
7. B. H. Menze, A. Jakab, S. Bauer, J. Kalpathy-Cramer, K. Farahani, J. Kirby, et al. "The Multimodal Brain Tumor Image Segmentation Benchmark (BRATS)", IEEE Trans. Med, Imag., 2015, 1993-2024.
8. S. Bakas, H. Akbari, A. Sotiras, M. Bilello, M. Rozycki, J.S. Kirby, et al., "Advancing The Cancer Genome Atlas glioma MRI collections with expert segmentation labels and radiomic features", Nature Scientific Data, 2017, 4:170117.
9. S. Bakas, M. Reyes, A. Jakab, S. Bauer, M. Rempfler, A. Crimi, et al., "Identifying the Best Machine Learning Algorithms for Brain Tumor Segmentation, Progression Assessment, and Overall Survival Prediction in the BRATS Challenge", arXiv, 2018, 1811.02629.
10. Wang, Z., Bovik, A.C., Sheikh, H.R.; Simoncelli, E.P. Image quality assessment: from error visibility to structural similarity. IEEE Trans. on Imag. Process. 2004;13(4),600–612
11. Rodriguez, G.G., Yu, Z., O'Donnell, L., Calderon, L., Shaykevich, S., Cloos, M. A., & Madelin, G., A method to increase the resolution of sodium images from simultaneous 1H MRF/23Na MRI. Proceedings of the ISMRM-ESMRMB 2022.
12. Moran P A.P. Notes on continuous stochastic phenomena, Biometrika, 1950, 37, 17-23.
13. Wang, Z., Simoncelli, E.P, Bovik, A.C.. Multiscale structural similarity for image quality assessment. IEEE Trans. on Imag. Process. The Thrity-Seventh Asilomar Conference on Signals, Systems & Computers, 2003,(2)1398-1402.
14. Van de Plas, R.,Yang J., Spraggins J.& Caprioli R. M.. Image fusion of mass spectrometry and microscopy: a multimodality paradigm for molecular tissue mapping. Nat. Methods. 2014;12(4)366-372.Figures
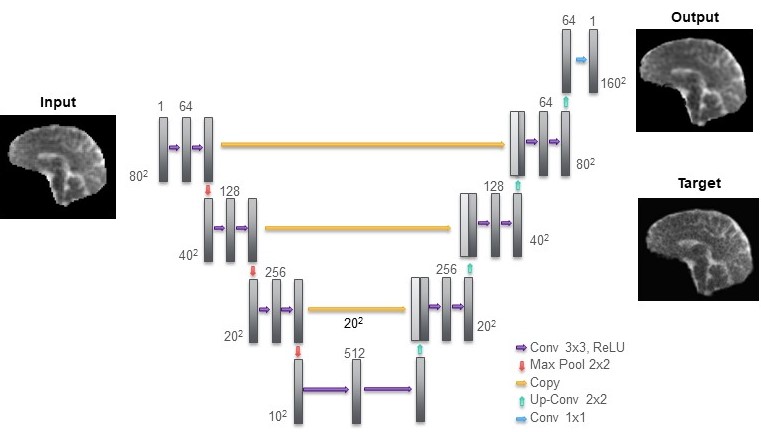
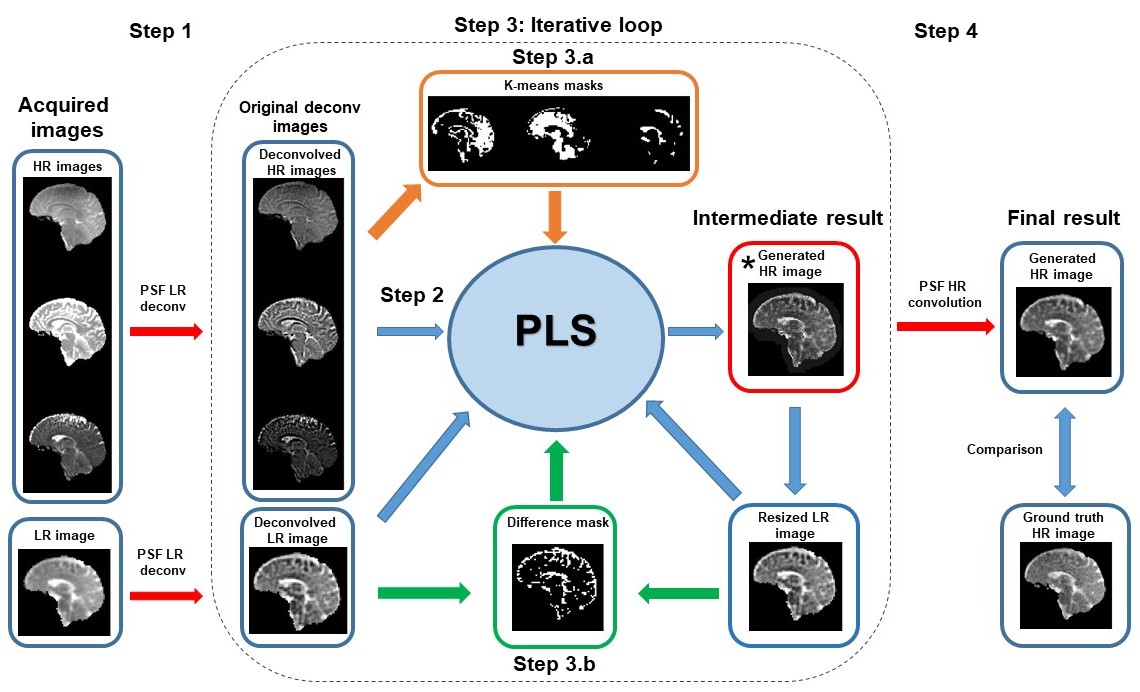
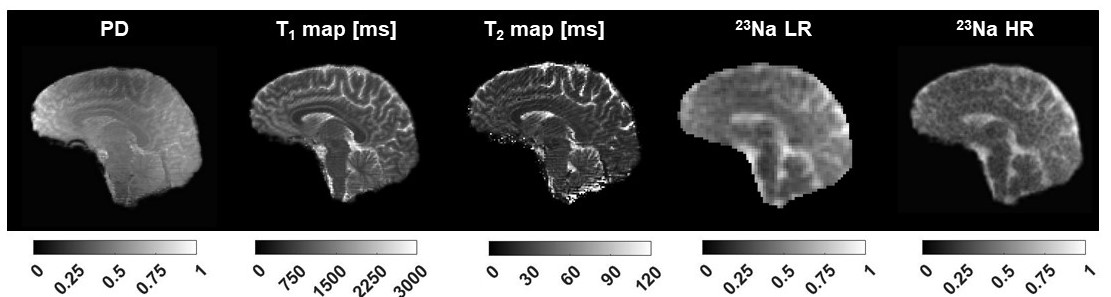
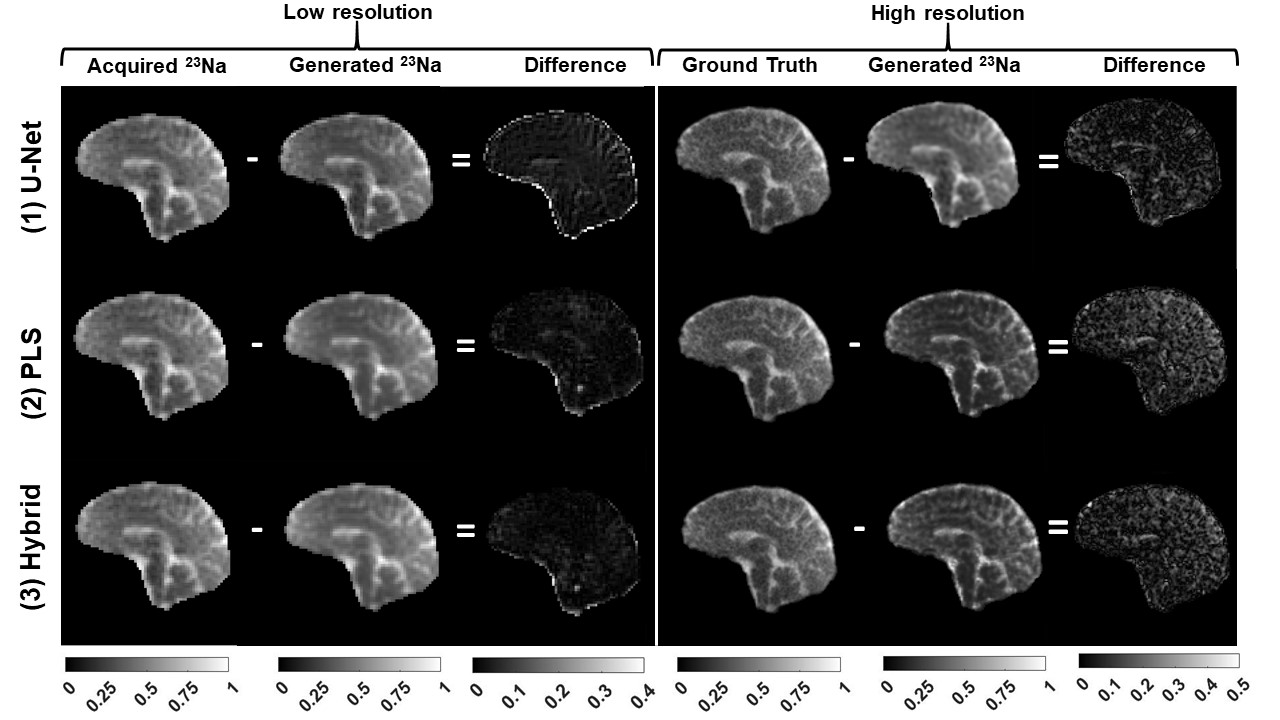
Figure 4: Results: comparison between acquired and generated 23Na images from each method. On the right side are shown the absolute value of the difference between LR and HR images, respectively.
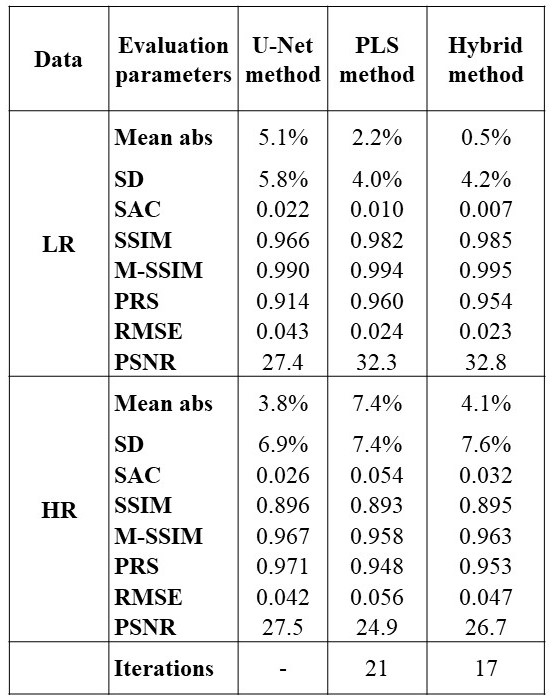
Table 1: Statistical values for each method. Mean abs represents the mean value of the difference between the acquired image and the image generated by the method (either LR or HR) and SD is the standard deviation. SAC is the spatial autocorrelation score. SSIM is the structural similarity index and the M-SSIM is the multi-scale SSIM. PRS is the pattern reconstruction score. RMSE is the root mean square error. PSNR is the peak signal-to-noise ratio.