0346
DeepFittingNet: a deep neural network-based approach for simplifying cardiac T1 and T2 estimation with improved robustness1School of Medical Technology, Beijing Institute of Technology, Beijing, China, 2Center for Biomedical Imaging Research, Department of Biomedical Engineering, School of Medicine, Tsinghua University, Beijing, China, 3Center for Community Health Service, Peking University Health Science Center, Beijing, China, 4School of Life Science, Beijing Institute of Technology, Beijing, China
Synopsis
Keywords: Myocardium, Machine Learning/Artificial Intelligence, Cardiac T1 and T2 mapping, myocardium tissue characterization
The most used curve-fitting method for map reconstruction of the cardiovascular magnetic resonance mapping is sensitive to the initial conditions, time-consuming, and prone to fitting error. In this study, we sought to develop a deep-learning approach (DeepFittingNet) to perform T1 and T2 calculations for the most clinically used cardiac parametric mappings, to simplify the clinical workflow of cardiac T1/T2 measurements and improve the robustness. In testing, DeepFittingNet could perform T1/T2 estimation tasks for MOLLI, SASHA, and T2-prep bSSFP. Compared to the curve-fitting algorithm, DeepFittingNet could improve the robustness for inversion-recovery T1 estimation and have comparable accuracy and precision.
Background
Cardiovascular magnetic resonance parametric mapping is routinely used for examining fibrosis and edema[1], where myocardial T1 is mostly measured by Modified-Look-Locker-Inversion-recovery (MOLLI) and saturation-recovery-single-shot-acquisition (SASHA), and T2 is assessed by T2-prepared balanced-Steady-State-Free-Precession (T2-prep bSSFP)[2-4]. The curve-fitting algorithm is used for reconstructing the pixel-wise map, which is sensitive to the initial conditions, time-consuming, and not robust[5].In this study, we hypothesize that a deep-learning approach could perform the fitting task for all these most used sequences and improve the robustness. We developed a 1D neural network (DeepFittingNet) and trained it using the simulations of MOLLI, SASHA, and T2-prep SSFP. DeepFittingNet was tested by in-vivo data and compared with the curve-fitting method.
Methods
DeepFittingNet is designed to predict the A, B, and Tx for inversion-/saturation-recovery T1 mapping and T2 mapping methods (Figure 1A). A, B, and Tx, and the measured signal time courses ($$$M(t)$$$ and $$$t$$$) of these sequences could be expressed as the following model:$$M(t)=A+B\cdot{e^{-\frac{t}{Tx}}}$$ [1]
Here, Tx represents T1 or T2. t is inversion-/saturation-recovery time or echo time of T2-prep pulse.
DeepFittingNet first adopts a bidirectional recurrent neural network (RNN) to allow inputting of different numbers of signals from various sequences and then uses a fully connected neural network (FCNN) to predict A, B and Tx. RNN includes eight hide layers. The hide size for each layer was 32. The neurons of each layer of FCNN were designed as 400, 400, 200, 200, 100, 50, 30, and 3. Each hider layer of both RNN and FCNN is followed by a leaky rectified linear unit activation function. Specifically, the last two layers of FCNN are repeated three times. For each iteration, the mean squared error between measured signals and ones generated using Equation 1 with predictions from the previous iteration are input.
Dataset: MOLLI3(3)3(3)5, MOLLI5(3)3, SASHA, and T2-prep bSSFP were simulated 5000000 times using the Bloch equation. For each simulation of each sequence, T1 (from 100ms to 2500ms), T2 (from 20ms to 250ms), heart rate (from 30bpm to 130bpm), off-resonance frequency (0Hz ±30Hz), flip angle (Normalized B1:1 ± 0.2), signal-to-noise ratio (from 20 to 120), inversion efficiency (80% ± 20%), and saturation efficiency (100% ± 20%) were randomly changed. Each signal time course of each sequence with and without noise was fitted to Equation 1 using the curve-fitting method with specified initial conditions for obtaining reference A, B, and Tx. For the T2, A was defined as the fitting residual [6].
Thirty-two subjects (20 male; 28±9 yrs) were imaged by MOLLI3(3)3(3)5, MOLLI5(3)3, SASHA, and T2-prep bSSFP on a Philips 3T scanner (Achieva TX) using typical imaging parameters, which was approved by the Institutional Review Board. All participants provided written informed consent. Fourteen (9 male; 28±10 yrs) of them were scanned twice in two separate scans. For each subject, only the mid-ventricular slice in the short-axis view was scanned. The curve-fitting method was used for building T1 and T2 maps for all scans.
Training, Validation, and Testing: DeepFittingNet was implemented using the Pytorch library and trained using all simulated signals with 500 epochs. The learning rate was 0.001 and an ADAM optimizer was used. In every iteration of training, each sequence fed 6400 signal time courses. The MAE calculated as the following equation was used to update DeepFittingNet.
$$$MAE=\frac{1}{M}\sum_{}^{}|A-\hat{A}|+|B-\hat{B}|+|T_{x}-\hat{T_{x}}|$$$ [2]
Where $$$A$$$, $$$B$$$, and $$$T_{x}$$$ are references, and $$$\hat{A}$$$, $$$\hat{B}$$$, and $$$\hat{T_{x}}$$$ are corresponding predictions. M is batch size.
Validation dataset included 10 MOLLI3(3)3(3)5 T1 maps, 7 MOLLI5(3)3 T1 maps, 10 SASHA T1 maps, and 10 T2 maps by T2-prep bSSFP from 14 subjects. Rest in-vivo images were used in the testing. Left-ventricle and septal myocardium, and blood were segmented. Mean and standard deviation (SD) were calculated for each region of interest. Analysis was performed using linear regression, Bland-Altman, and paired Student’s t-test method.
Results
The model with the lowest MAE for the left-ventricle myocardium and septum of the validation dataset was selected. Figure 2 indicates that the fitting tasks of these mapping sequences could be simplified by one neural network. Compared to curve-fitting, DeepFittingNet improved the robustness for inversion-recovery T1 (Figure 3). There was no difference in the either LV or septal T1 for MOLLI5(3)3 and SASHA between curve-fitting and DeepFittingNet (all P>0.05, Figure 4). The mean difference in LV and septal T1 between two methods were 3.58ms and 3.95ms for MOLLI3(3)3(3)5, and 0.42ms for T2-prep bSSFP (all P<0.05). Except for the difference of 19.86ms in MOLLI3(3)3(3)5 blood T1 between the two methods, for the rest three sequences, the mean blood T1/T2 difference was negligible (all p<0.05). In Table 1, DeepFittinNet had comparable T1 precision to the curve-fitting method.Discussion and Conclusion
Our study demonstrated that a single deep neural network could complete T1 and T2 calculations for the most clinically used MR relaxometry mapping sequences. Compared to the curve-fitting algorithm, the deep-learning approach had comparable performance while improving the robustness for inversion-recovery T1 estimation.Acknowledgements
This work is supported by the National Natural Science Foundation of China for Young Scholars (No. 82202138), the Fundamental Research Funds for the Young Investigator (No. XSQD-202213003), and the Fundamental Research Funds for the Central Universities (No. LY2022-22)
References
1. Messroghli DR, Moon JC, Ferreira VM, Grosse-Wortmann L, He T, Kellman P, Mascherbauer J, Nezafat R, Salerno M, Schelbert EB, Taylor AJ, Thompson R, Ugander M, van Heeswijk RB, Friedrich MG. Clinical recommendations for cardiovascular magnetic resonance mapping of T1, T2, T2* and extracellular volume: A consensus statement by the Society for Cardiovascular Magnetic Resonance (SCMR) endorsed by the European Association for Cardiovascular Imaging (EACVI). J Cardiovasc Magn Reson 2017;19(1):75.
2. Messroghli DR, Radjenovic A, Kozerke S, Higgins DM, Sivananthan MU, Ridgway JP. Modified Look-Locker inversion recovery (MOLLI) for high-resolution T1 mapping of the heart. Magn Reson Med 2004;52(1):141-146.
3. Chow K, Flewitt JA, Green JD, Pagano JJ, Friedrich MG, Thompson RB. Saturation recovery single-shot acquisition (SASHA) for myocardial T(1) mapping. Magn Reson Med 2014;71(6):2082-2095.
4. Giri S, Chung YC, Merchant A, Mihai G, Rajagopalan S, Raman SV, Simonetti OP. T2 quantification for improved detection of myocardial edema. J Cardiovasc Magn Reson 2009;11(56).
5. Kellman P, Hansen MS. T1-mapping in the heart: accuracy and precision. J Cardiovasc Magn Reson 2014;16(22).
6. Akcakaya M, Basha TA, Weingartner S, Roujol S, Berg S, Nezafat R. Improved quantitative myocardial T2 mapping: Impact of the fitting model. Magn Reson Med 2014;74(1):93-105.
Figures
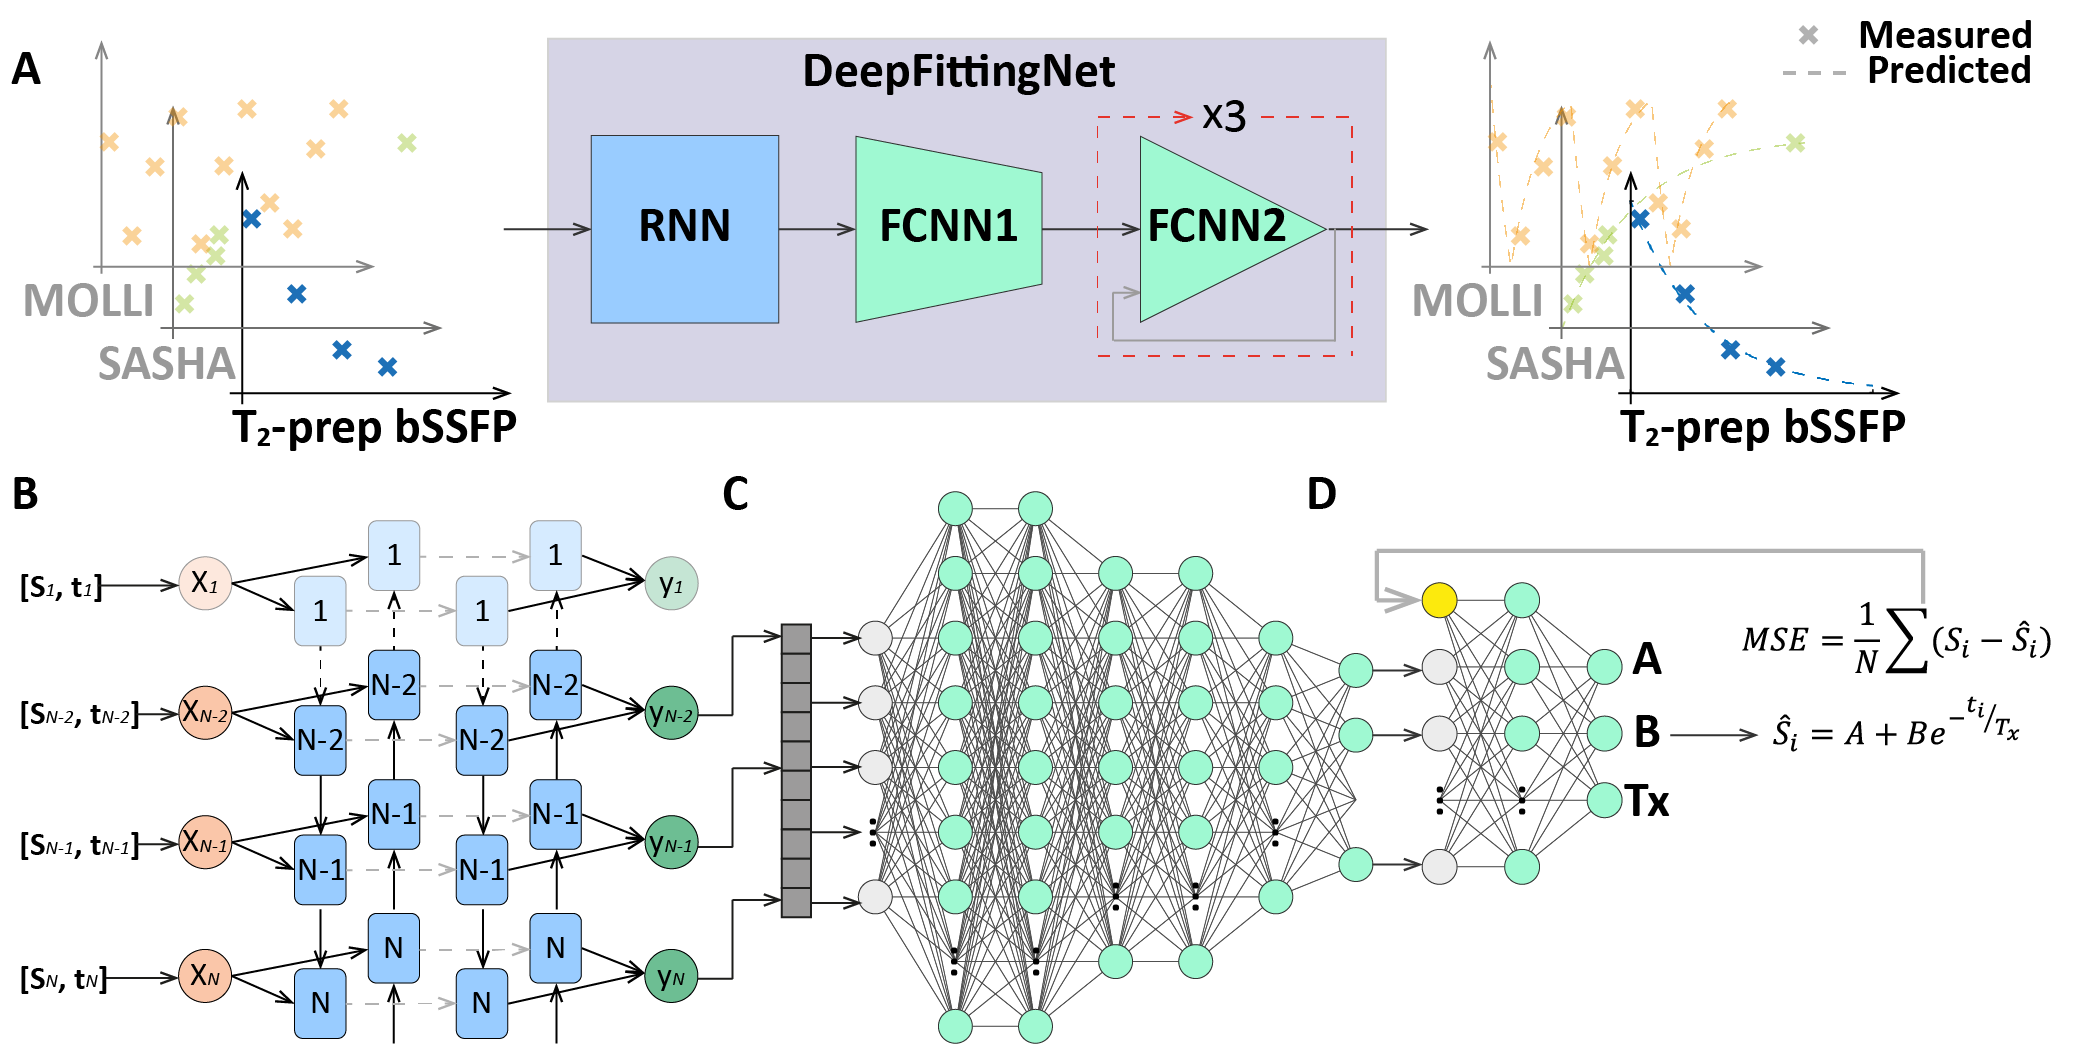
Figure 1. A: The purpose of DeepFittingNet. DeepFittingNet is developed and trained to perform T1/T2 estimation for the most used cardiac T1 mapping sequences, that is, MOLLI, SASHA, and T2 mapping (T2-prep bSSFP). B is a Recurrent Neural Network for adapting the different inputs from different mapping sequences. C and D are two parts of a fully connected network (FCNN) for predicting A, B, and Tx. D is repeated three times with the mean squared error (MSE) of residual error between measured signals and those generated from a three-parameter relaxation model, to improve performance.
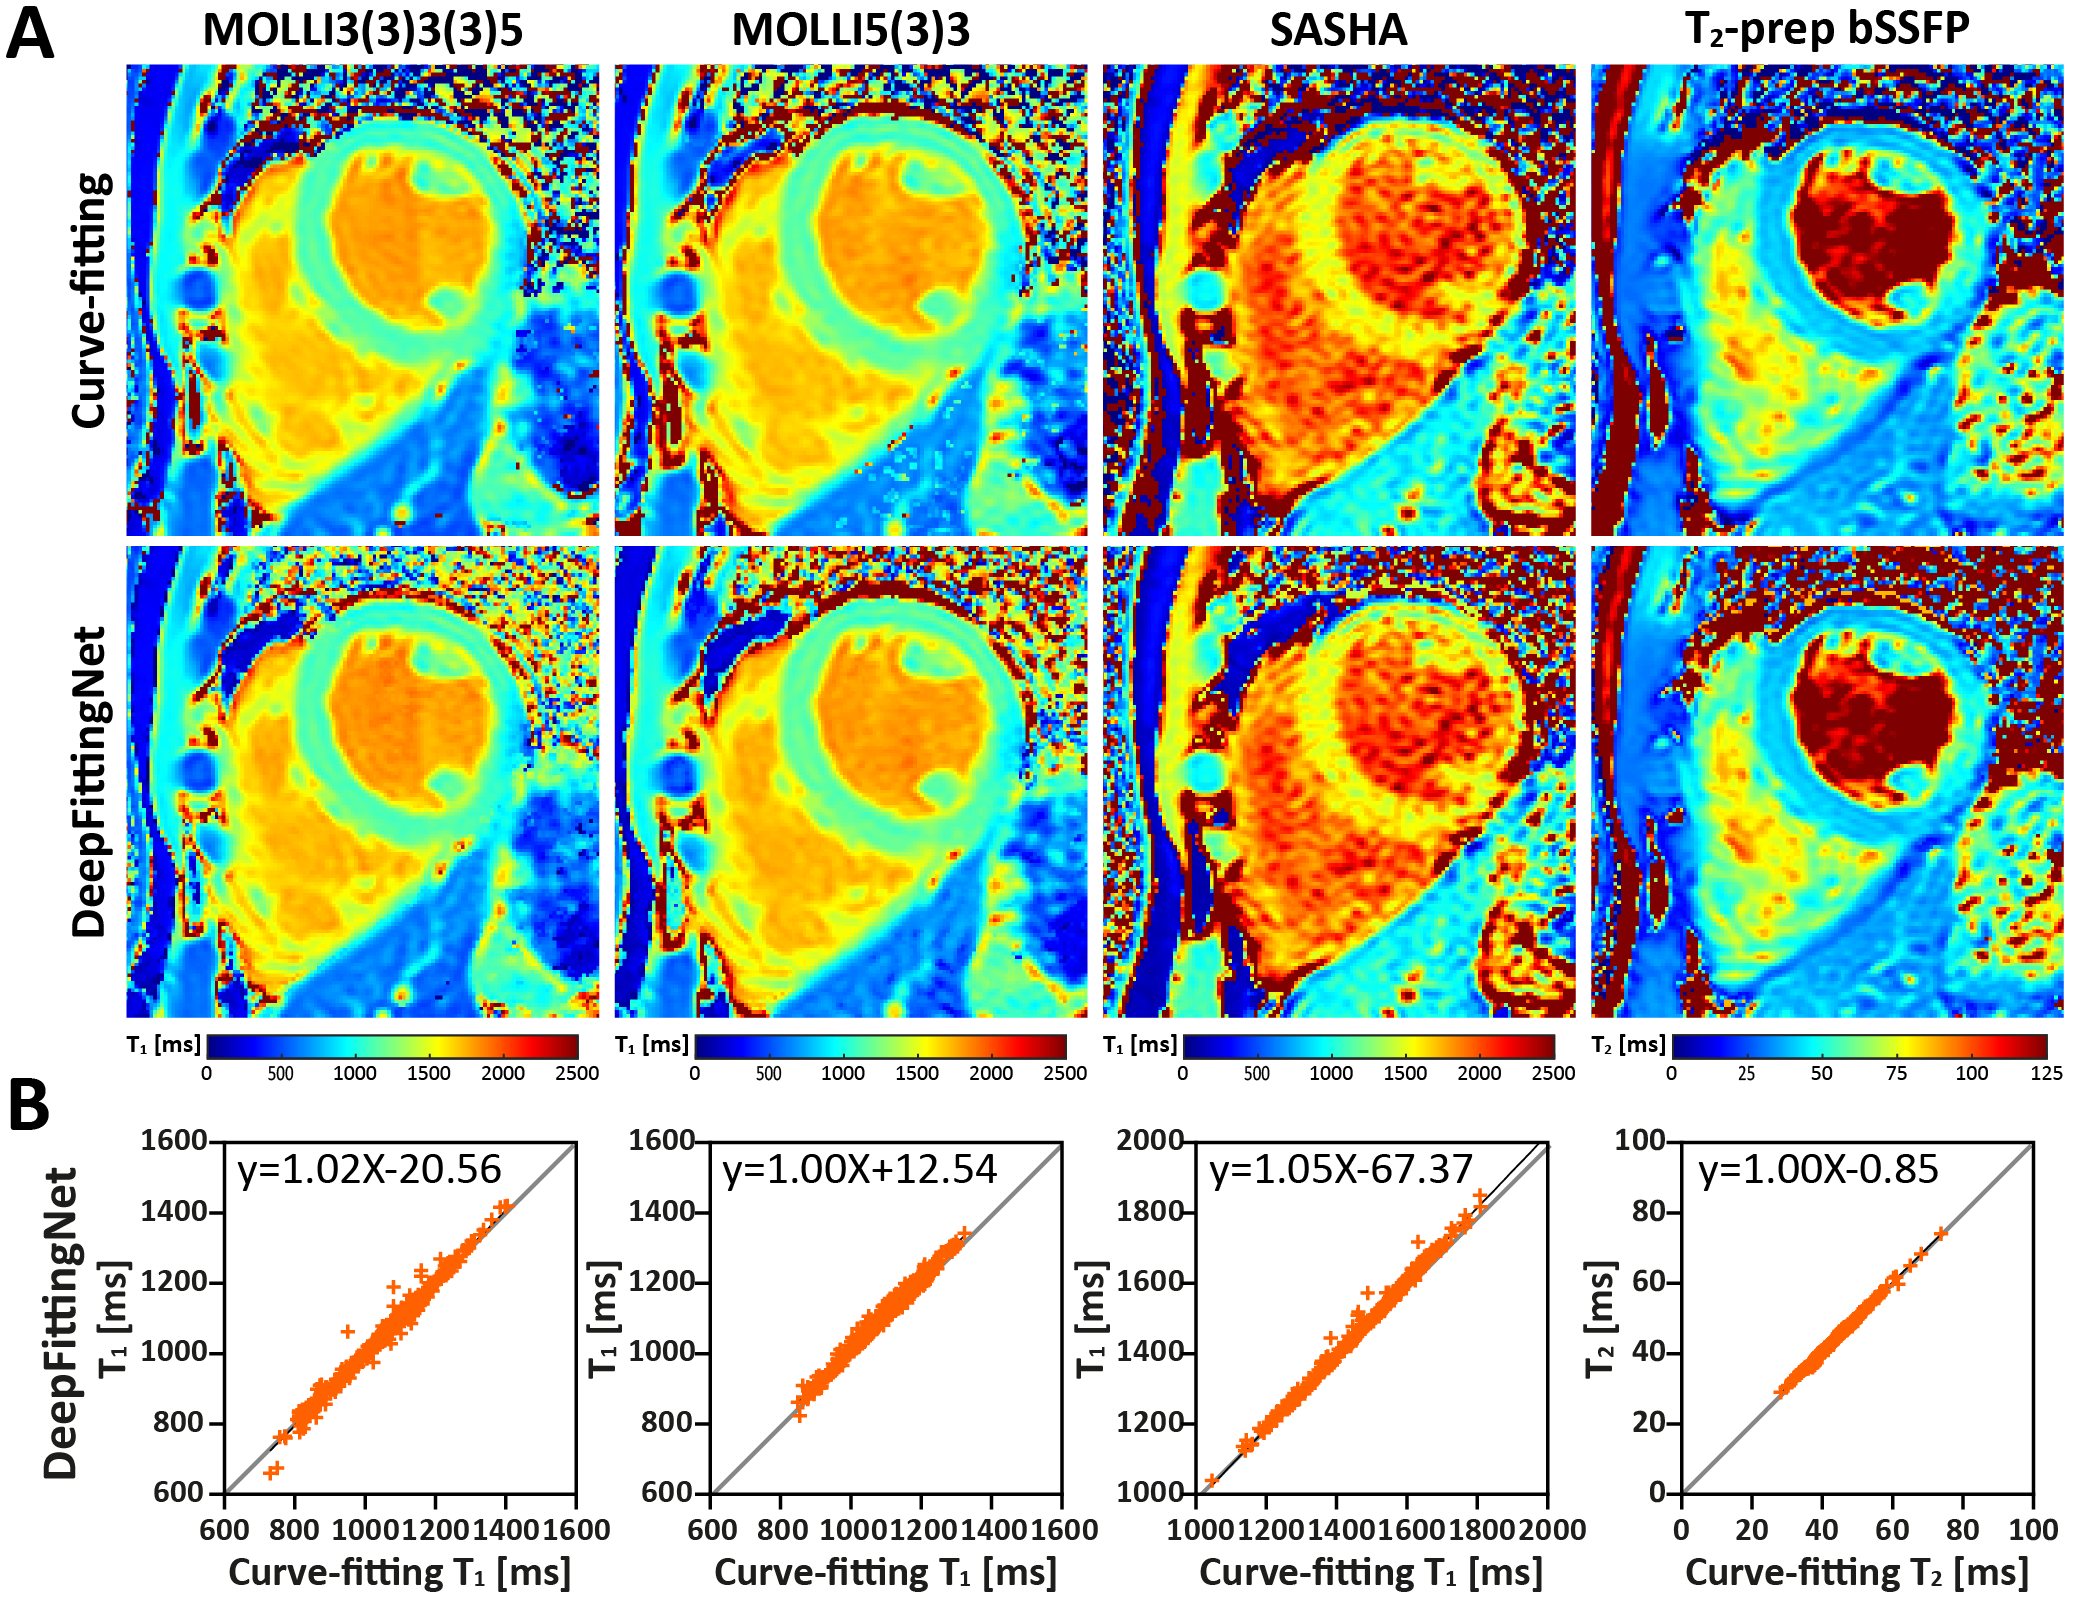
Figure 2. Represents in-vivo T1 and T2 maps reconstructed by the conventional curve-fitting method and DeepFittingNet with plots of linear regression for showing the correlation between two methods in the estimation of left-ventricle T1 and T2.
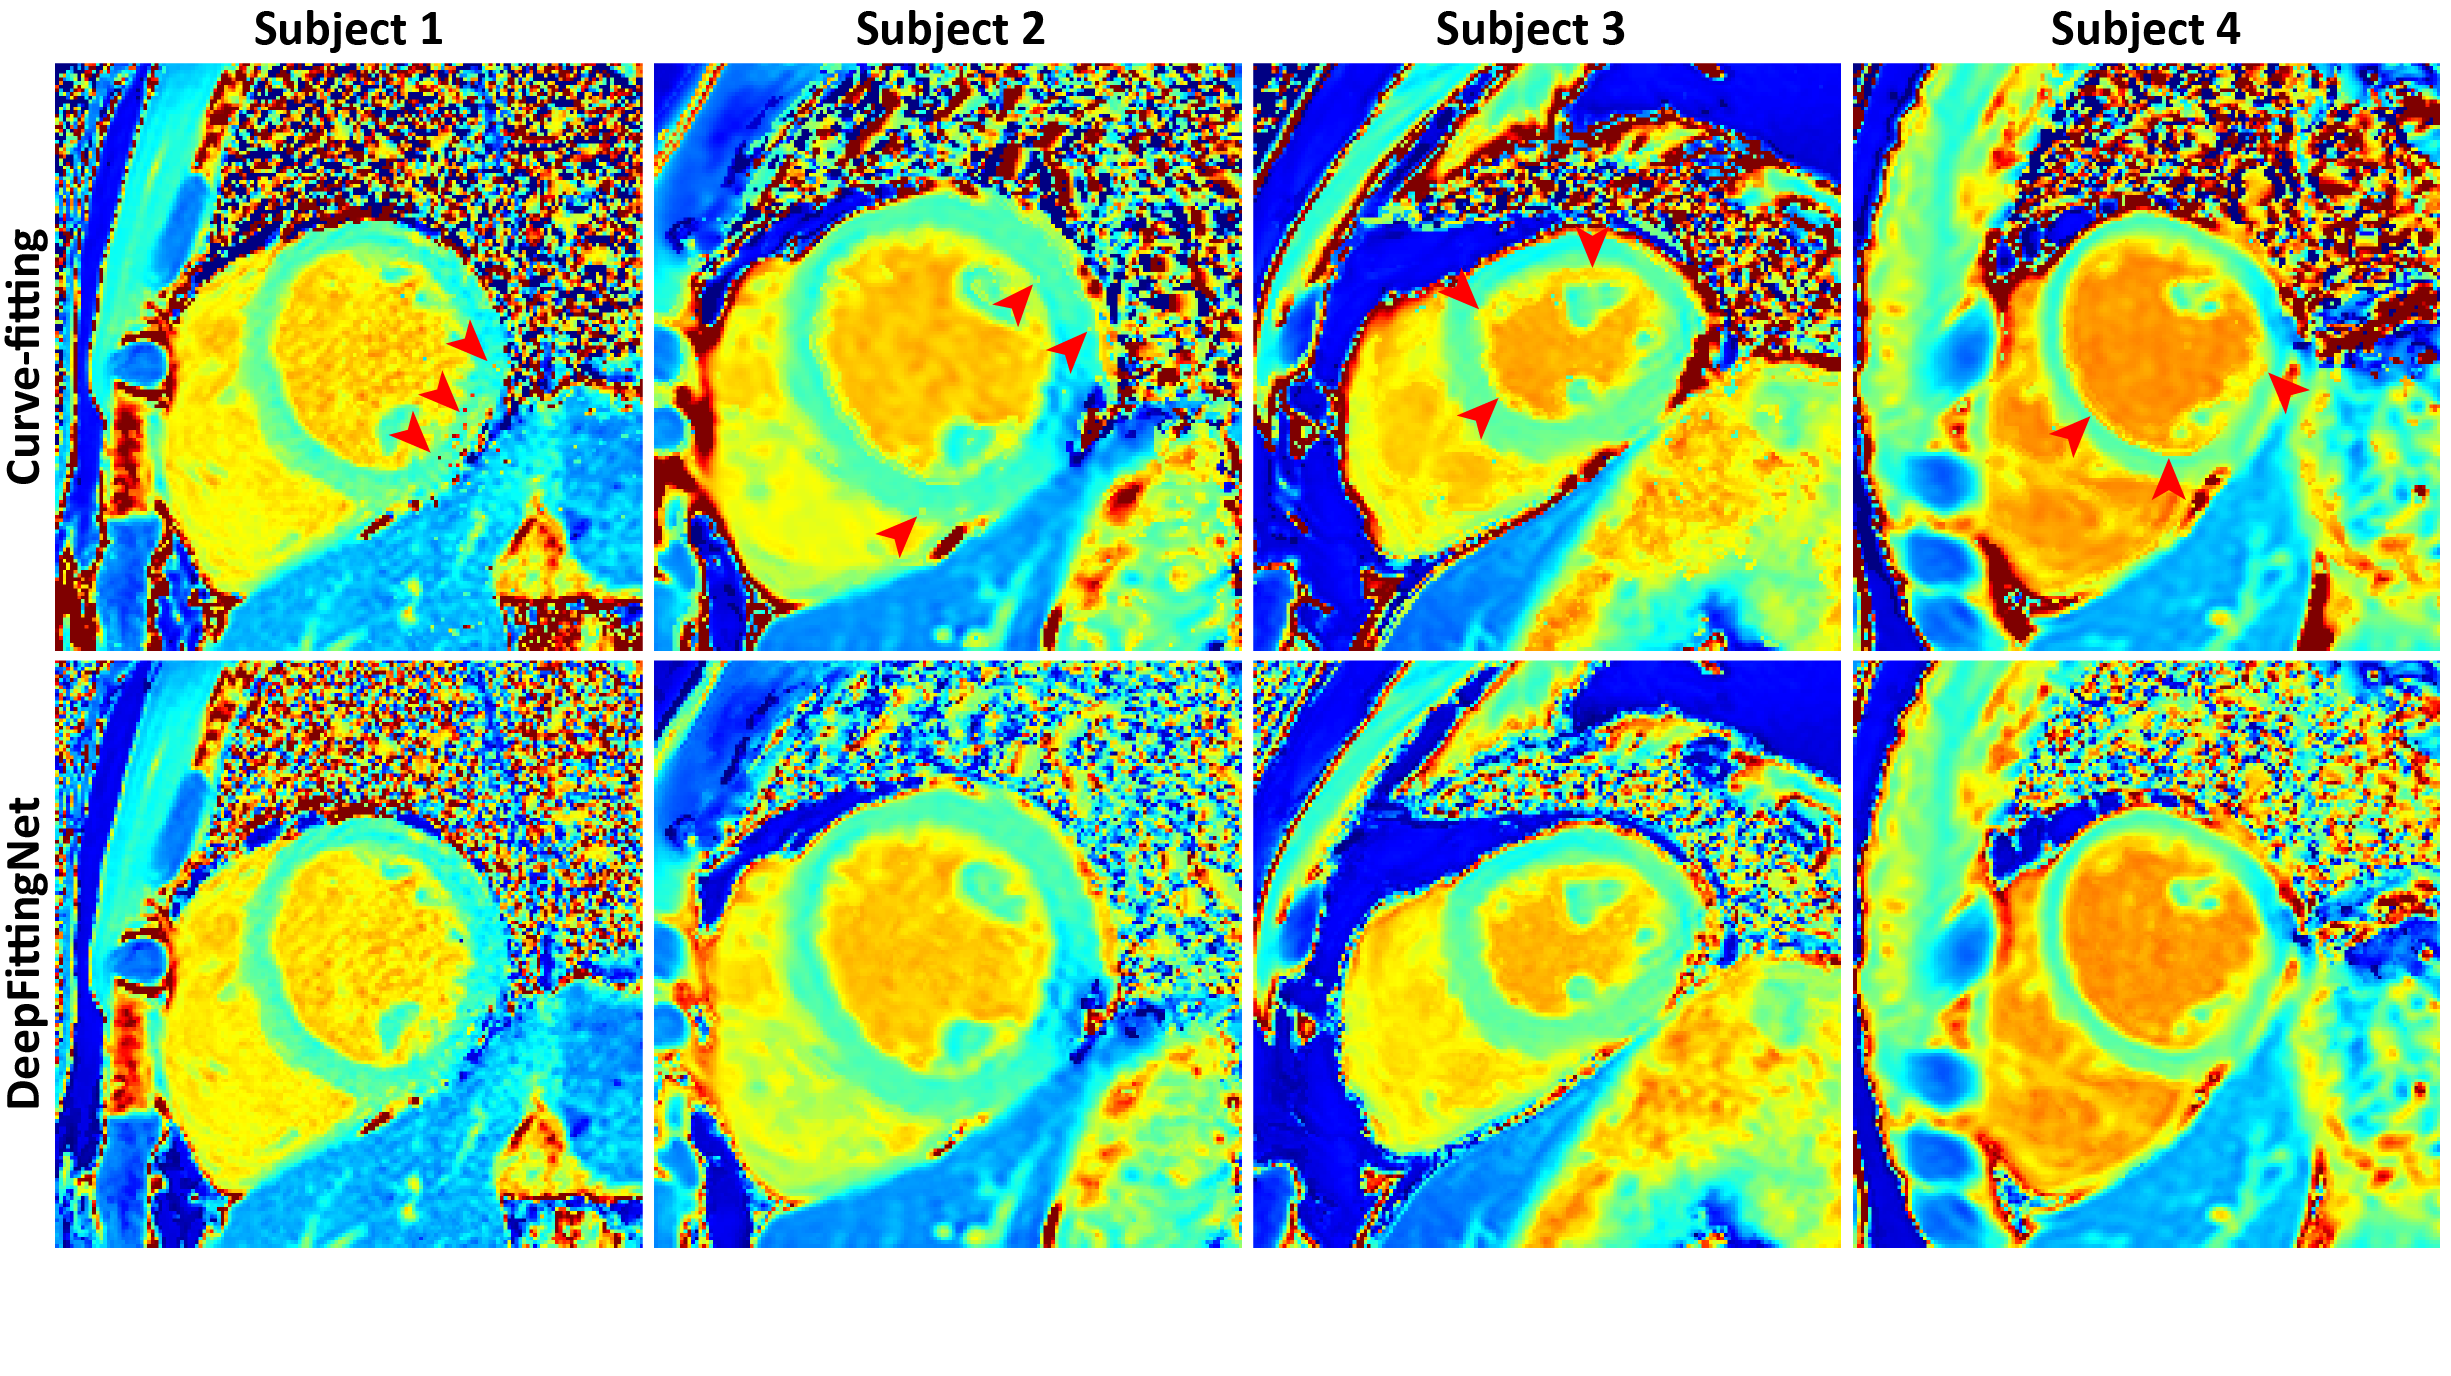
Figure 3. In-vivo maps for comparing the robustness between curve-fitting and DeepFittingNet. The red arrow indicts the fitting error.
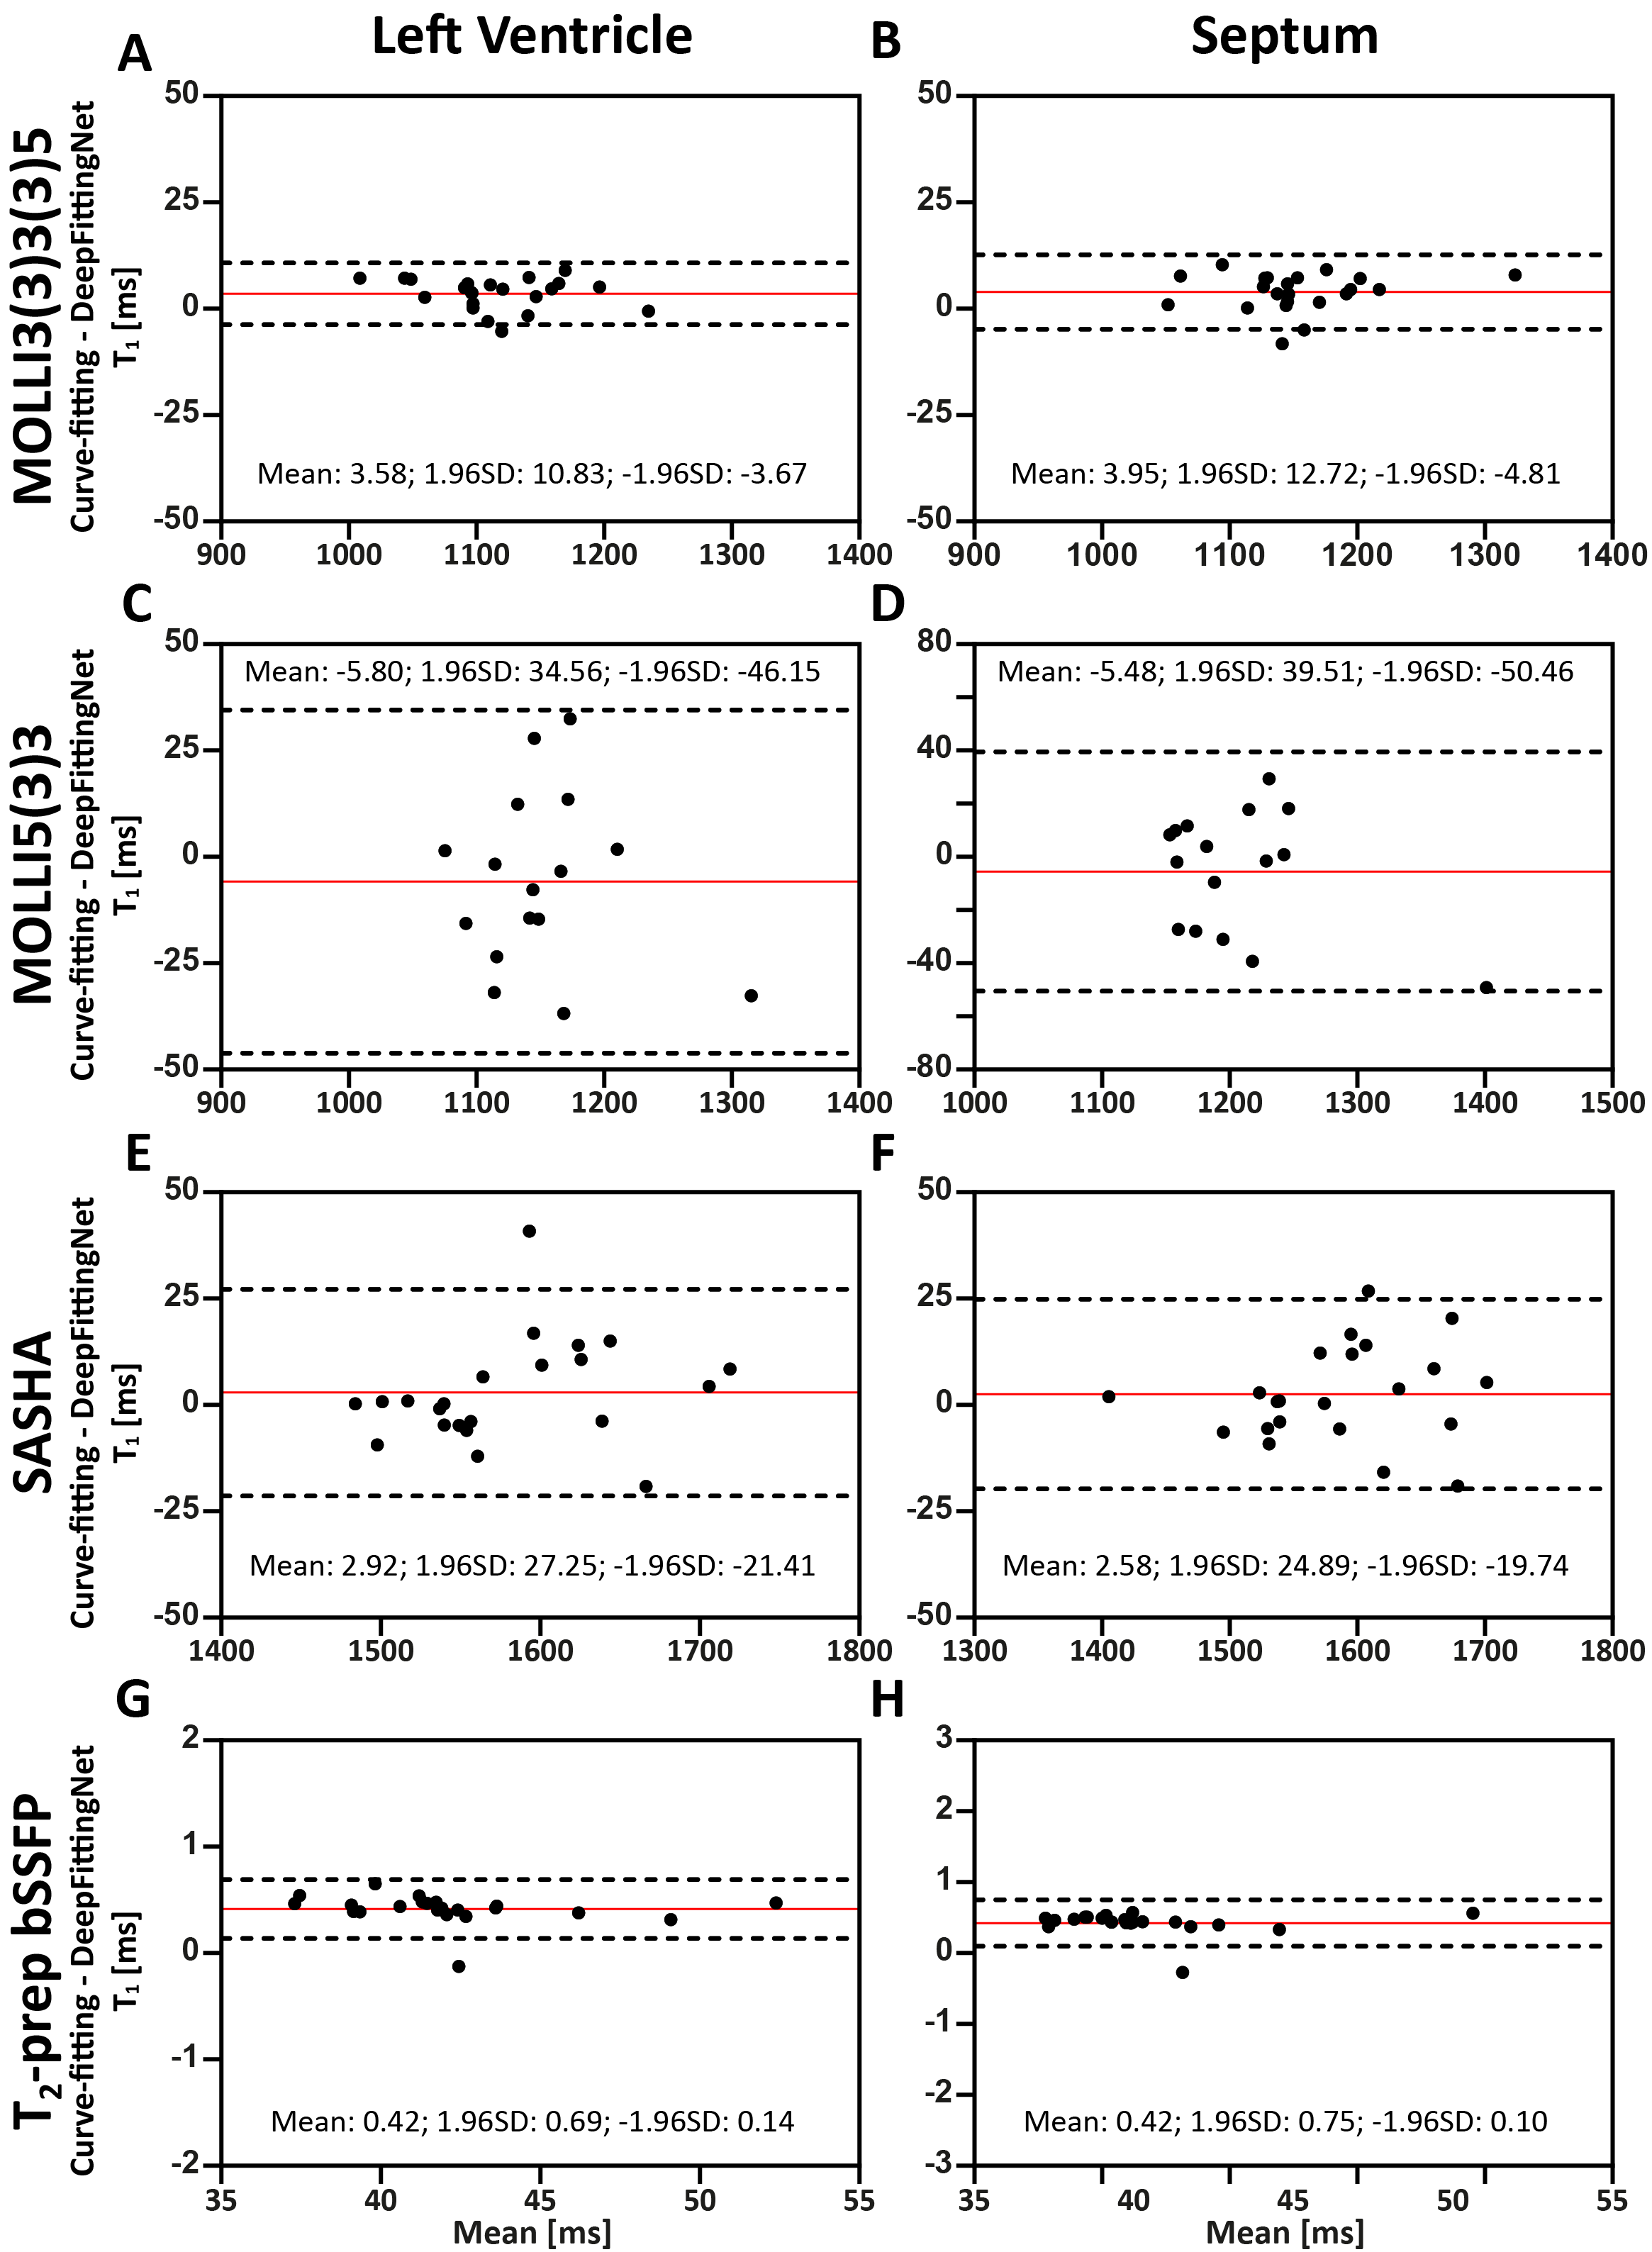
Figure 4. The agreements in left-ventricle T1 and T2 between curve-fitting and DeepFittingNet, as well as the septum. The red line indicates the mean difference and the dotted lines show the 95% confidence interval on the limits of agreement.
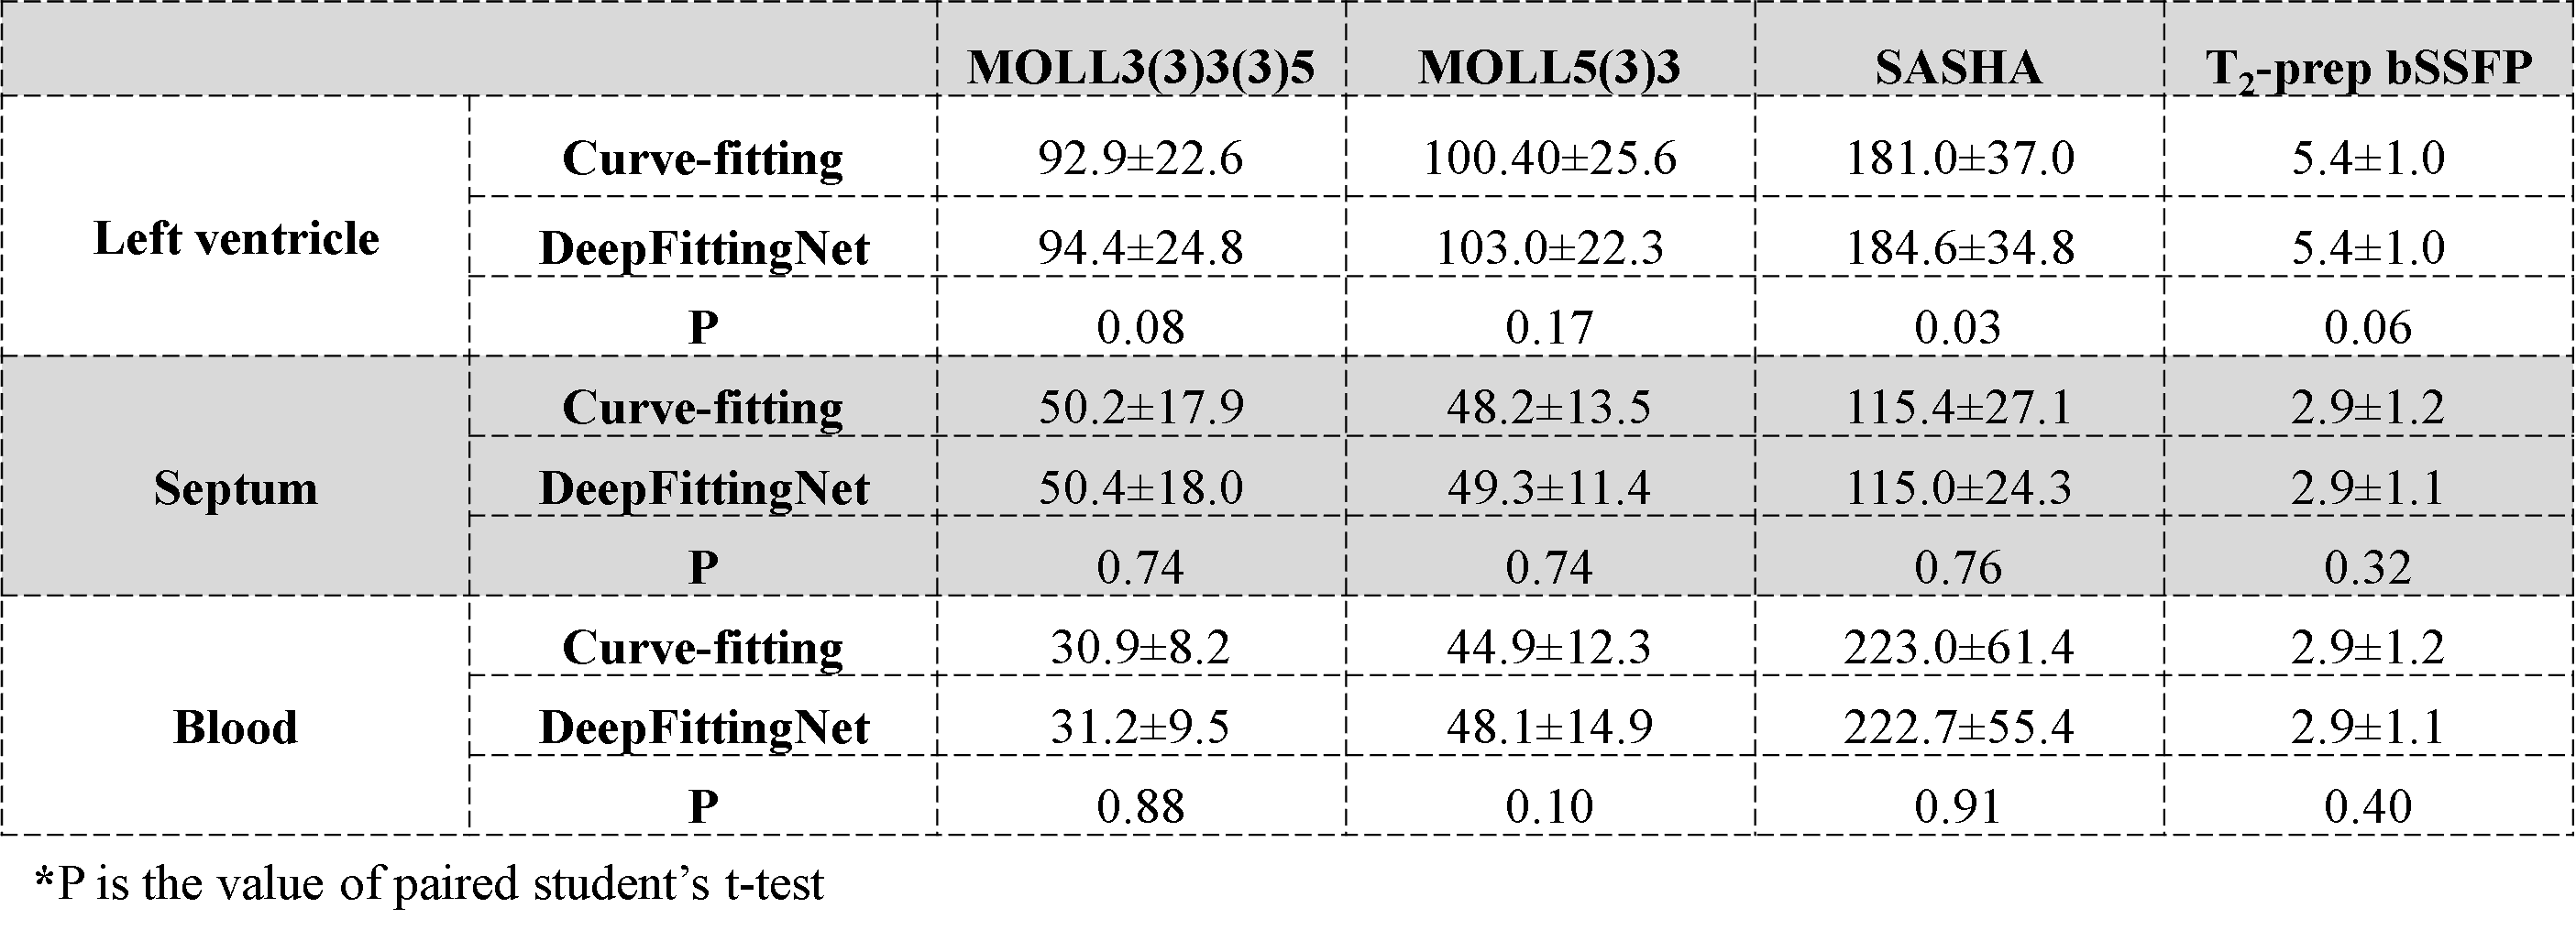
Table 1. The standard deviation of the left ventricle, septum, and blood T1/T2 averaged from all corresponding testing maps from four sequences with two calculation methods.