0345
Simplified Protocol with mSAVA for 3D Imaging of T1, T2, Extracellular Volume, Bright-Blood and Dark-Blood Late Gadolinium Enhancement1Center for Biomedical Imaging Research, Department of Biomedical Engineering, Tsinghua University, Beijing, China, 2Department of Radiology, Union Hospital, Tongji Medical College, Huazhong University of Science and Technology, Wuhan, China, 3Hubei Province Key Laboratory of Molecular Imaging, Wuhan, China, 4School of Medical Technology, Beijing Institute of Technology, Beijing, China, 5Department of Radiology, Case Western Reserve University, Cleveland, OH, United States
Synopsis
Keywords: Cardiomyopathy, Tissue Characterization
Multi-parametric SAturation recovery and Variable flip Angle (mSAVA) acquires four 3D volumes with different T1 and T2 weightings during free-breathing to simultaneously generate whole heart T1 and T2 parametric maps. We proposed a fast and simple CMR protocol using pre- and post-contrast mSAVA acquisitions to additionally generate ECV maps, and bright-blood and dark-blood LGE images. mSAVA could comprehensively assess the myocardium over the whole heart within ~6+6 min in a cohort of twenty patients.
INTRODUCTION
CMR had been widely used for myocardial tissue characterization with the ability to generate multi-parametric and multi-contrast images (1). Late gadolinium enhancement (LGE) has excellent image contrast for the detection of focal scarring, and dark-blood LGE further improved the scar-to-blood contrast (2). Parametric mapping such as T1, T2 and extracellular volume (ECV) have permitted quantification of both focal and diffuse disease (3,4). However, conventional protocols require multiple scans with different sequences (5,6) to obtained both parametric maps and LGE images. Though an all-in-one approach was proposed by calculating LGE images based on T1 and T2 maps, 2D imaging limited achievable spatial resolution and coverage (7). Conversely, whole-heart assessment requiring multiple scans would result in unacceptably long scan time. We propose a simplified protocol based on 3D free-breathing multi-parametric SAturation recovery and Variable flip Angle (mSAVA). mSAVA is performed before and after contrast injection, enabling highly efficient whole-heart T1, T2 and ECV mapping, as well as bright-blood and dark-blood LGE.METHODS
Imaging sequenceThe proposed mSAVA sequence acquires four 3D volumes with hybrid T1 and T2 weighting (Figure 1A). The first volume (IMG1) is sampled with a small flip angle (FA1) and without preparation pulses to measure the equilibrium longitudinal magnetization (8). The following three volumes (IMGi, i=2,3,4) are prepared by both saturation (SAT) and T2 preparation (T2 PREP) with variable timing. Sequence parameters are matched to a previous study (9).
Calculation of multi-parametric and multi-contrast images
T1 and T2 were jointly calculated voxel by voxel from the four volumes using a dictionary matching method combined with an orthogonal matching pursuit algorithm (10,11). The dictionary was generated with a Bloch equation to calculate the signal intensity of each volume (9).
ECV maps were calculated using native and post-contrast T1 maps after rigid registration was performed to correct the mismatch of the left ventricle myocardium (12).
Multi-contrast LGE images were generated with post-contrast T1 and T2 maps by Bloch equation simulation. Bright-blood LGE (BB-LGE) was calculated with an inversion-recovery (IR) signal model, while Dark-blood LGE (DB-LGE) was calculated with an IR-T2 PREP signal model (7):
$$$BB-LGE=1-e^{-TI/T_1}\tag{1}$$$
$$$DB-LGE=1-(1+e^{-TE/T_2})e^{-TD/T_1}\tag{2}$$$
For BB-LGE, TI was selected to suppress the signal of normal myocardium. For DB-LGE, TE and TD were selected to simultaneously suppress the signals of normal myocardium and left ventricular blood pools.
In-vivo experiments
The study was approved by the local IRB. Written informed consent was obtained from all subjects. Twenty patients (11 males, 50 ± 14 years) were recruited and imaged on a 3.0T MR scanner (Ingenia CX, Philips Healthcare, Best, Netherlands). Native T1 and T2 maps were acquired by mSAVA, modified Look-Locker inversion recovery (MOLLI) and gradient spin echo (GraSE). Post-contrast mSAVA, MOLLI and phase-sensitive inversion recovery (PSIR) LGE were performed at about 15 minutes after 0.2 mmol/kg Gd‐DTPA (Magnevist, Bayer Pharma AG, Germany) injection. Imaging parameters for mSAVA were: FOV 300×300×92mm3, voxel size1.5×1.5×8mm3 reconstructed to 1.5×1.5×4 mm3, TR/TE 4.3ms/1.35ms, 35 readouts per shot, CS-SENSE factor 2. FA1 = 2° for pre-contrast and FA1 = 3° for post-contrast. MOLLI and GraSE acquired 3 slices in 3 breath-holds. Imaging parameters were: FOV 300×300mm2, voxel size 2×2×10mm3. MOLLI was performed using 5s(3s)3s scheme for pre-contrast and 4s(1s)3s(1s)2s scheme for post-contrast, TR/TE/flip angle 2.1ms/0.97ms/35°, SENSE factor 2. GraSE used nine echo times ranging from 8.8ms to 79.6ms, TR 1 heartbeat, EPI factor 7. PSIR imaged 12 slices in separate breath-holds. Imaging parameters were: FOV = 300 × 300 mm2, voxel size 1.5×1.5×8mm3, TR/TE = 6.1/3.0 ms, flip angle = 25°, SENSE acceleration factor = 1.5.
RESULTS
mSAVA was successfully performed on all patients for both native and post-contrast imaging with scan time of 5.9±1.5 mins and 5.8±1.6 mins, respectively. Compared with conventional techniques, mSAVA acquired multi-parametric and multi-contrast images with comparable image quality (Figure 2). 3D imaging with mSAVA achieved complete coverage of the left ventricle, enabling generation of reformatted long axis views (Figure 3). The synthetic DB-LGE had a better scar-to-blood contrast than BB-LGE, potentially improving the detection of subendocardial scar. The multi-parametric images acquired by mSAVA detected both local and global abnormality of myocardium (Figure 4). Left ventricle T1 measured by mSAVA was higher than MOLLI (native: 1427±67 vs 1341±81 ms, bias: 85.8 ms, post-contrast: 660±63 vs 585±59 ms, bias: 75.3 ms), leading to a lower value of ECV (31.4±8.2 vs 35.2±8.2 %, bias: -3.8 %). T2 measured by mSAVA was lower than GraSE (47.3±4.0 vs 50.7±4.2 ms, bias: -3.4 ms) (Figure 5).DISCUSSION and CONCLUSION
In this study, we proposed a simplified CMR protocol by performing mSAVA before and after contrast to acquire 3D T1 and T2 maps. Native and post-contrast T1 mapping enabled the estimation of ECV. These multi-parametric images could quantitatively characterize the myocardium. In addition, post contrast T1 and T2 maps enabled the synthetic LGE images, presenting an excellent contrast for the detection of local scar, which also avoided the scout scan for the selection of inversion recovery time. The total scan could be efficiently completed in about 6+6 mins. In conclusion, mSAVA can comprehensively assess the whole heart by mapping T1, T2, and ECV, and generating bright-blood and dark-blood LGE images. The simplified protocol was successful during CMR examination in patients.Acknowledgements
No acknowledgement found.References
1. Guo R, Weingärtner S, Šiurytė P, et al. Emerging Techniques in Cardiac Magnetic Resonance Imaging. J. Magn. Reson. Imaging 2022;55:1043–1059 doi: 10.1002/jmri.27848.
2. Kellman P, Xue H, Olivieri LJ, et al. Dark blood late enhancement imaging. J. Cardiovasc. Magn. Reson. 2016;18:77 doi: 10.1186/s12968-016-0297-3.
3. Messroghli DR, Moon JC, Ferreira VM, et al. Clinical recommendations for cardiovascular magnetic resonance mapping of T1, T2, T2 and extracellular volume: A consensus statement by the Society for Cardiovascular Magnetic Resonance (SCMR) endorsed by the European Association for Cardiovascular Imagin. J. Cardiovasc. Magn. Reson. 2017;19:1–24 doi: 10.1186/s12968-017-0389-8.
4. Kellman P, Arai AE, McVeigh ER, Aletras AH. Phase-sensitive inversion recovery for detecting myocardial infarction using gadolinium-delayed hyperenhancement. Magn. Reson. Med. 2002;47:372–383 doi: 10.1002/mrm.10051.
5. Messroghli DR, Radjenovic A, Kozerke S, Higgins DM, Sivananthan MU, Ridgway JP. Modified Look-Locker inversion recovery (MOLLI) for high-resolutionT1 mapping of the heart. Magn. Reson. Med. 2004;52:141–146 doi: 10.1002/mrm.20110.
6. Sprinkart AM, Luetkens JA, Träber F, et al. Gradient Spin Echo (GraSE) imaging for fast myocardial T2 mapping. J. Cardiovasc. Magn. Reson. 2015;17:12 doi: 10.1186/s12968-015-0127-z.
7. Kellman P, Xue H, Chow K, et al. Bright-blood and dark-blood phase sensitive inversion recovery late gadolinium enhancement and T1 and T2 maps in a single free-breathing scan: an all-in-one approach. J. Cardiovasc. Magn. Reson. 2021;23:1–14 doi: 10.1186/s12968-021-00823-3.
8. Guo R, Si D, Chen Z, et al. SAturation‐recovery and Variable‐flip‐Angle–based three‐dimensional free‐breathing cardiovascular magnetic resonance T 1 mapping at 3 T. NMR Biomed. 2022;35:e4755 doi: 10.1002/nbm.4755.
9. Si D, Guo R, Liu B, Herzka DA, Ding H. 3D free-breathing simultaneous whole heart T 1 and T 2 mapping based on SAturation Recovery and Variable flip Angle ( SAVA ). In Proceedings of the 30th Annual Meeting of ISMRM 2022.
10. Pati YC, Rezaiifar R, Krishnaprasad PS. Orthogonal matching pursuit: recursive function approximation with applications to wavelet decomposition. In: Proceedings of 27th Asilomar Conference on Signals, Systems and Computers. IEEE Comput. Soc. Press; 1993. pp. 40–44. doi: 10.1109/ACSSC.1993.342465.
11. Hamilton JI, Jiang Y, Chen Y, et al. MR fingerprinting for rapid quantification of myocardial T 1 , T 2 , and proton spin density. Magn. Reson. Med. 2017;77:1446–1458 doi: 10.1002/mrm.26216.
12. Haaf P, Garg P, Messroghli DR, Broadbent DA, Greenwood JP, Plein S. Cardiac T1 Mapping and Extracellular Volume (ECV) in clinical practice: A comprehensive review. J. Cardiovasc. Magn. Reson. 2016;18:1–12 doi: 10.1186/s12968-016-0308-4.
Figures
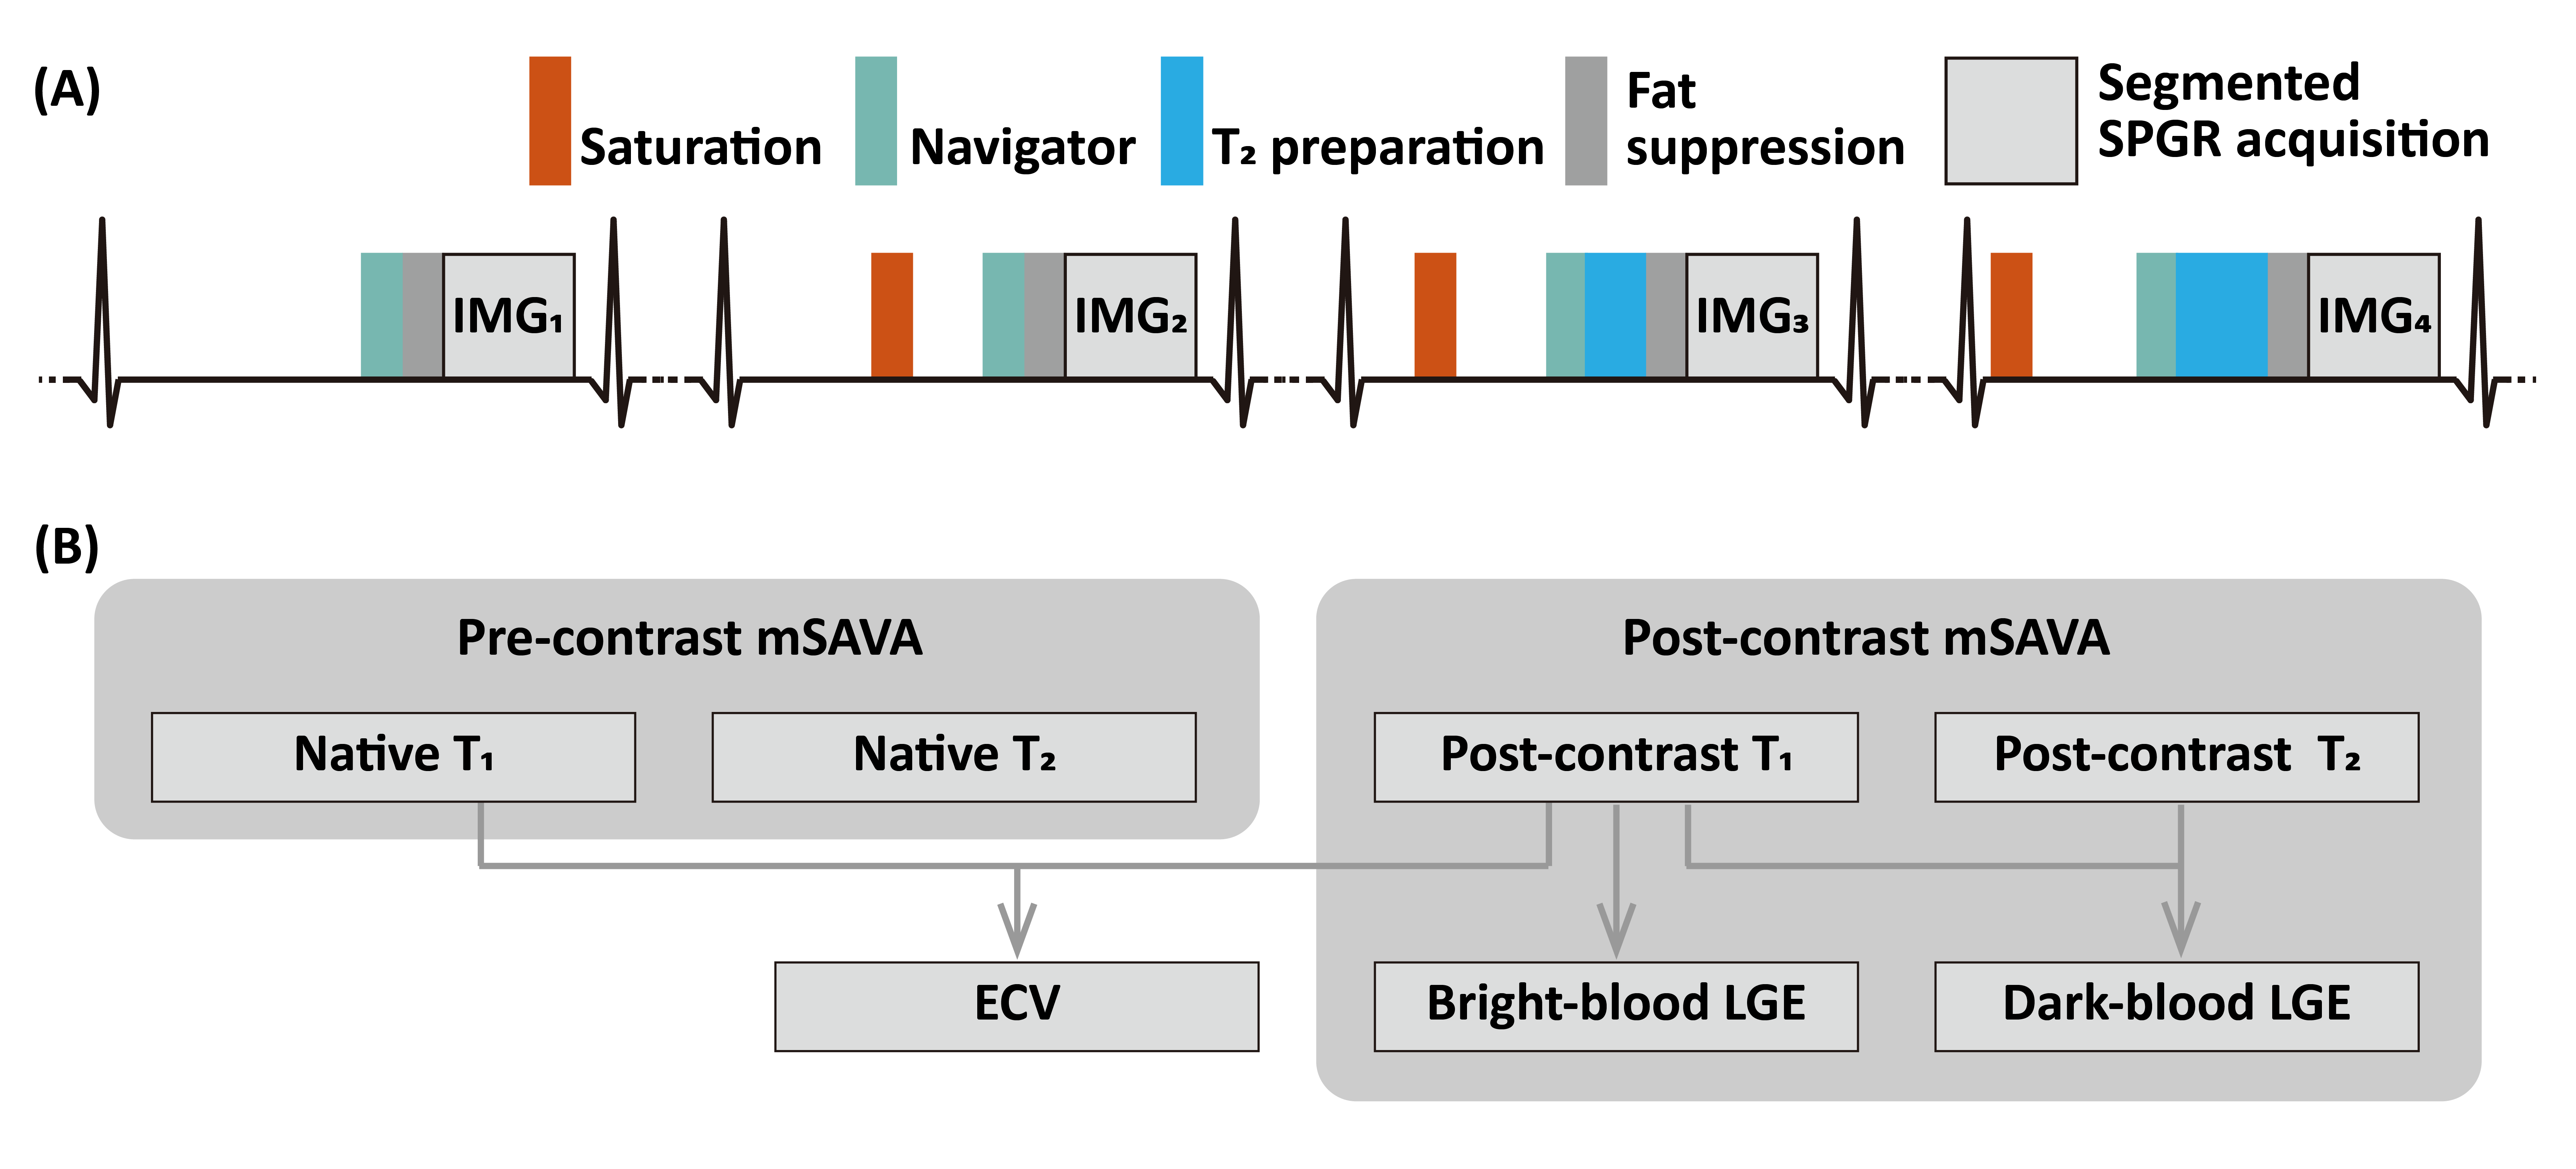
Figure 1. Pulse sequence diagram for mSAVA (A) and the flowchart for the calculation of multi-parametric and multi-contrast images (B). mSAVA acquires four 3D volumes with hybrid T1 and T2 weighting, which were used to calculate T1 and T2 maps with a dictionary matching method. mSAVA was performed before and after contrast injection to acquire native and post-contrast T1 and T2 maps. ECV was calculated with native and post-contrast T1 maps. Bright-blood LGE was generated with post-contrast T1 map, while dark-blood LGE was generated combining post-contrast T1 and T2 maps.