0336
Joint cardiac tissue velocity and diffusion tensor mapping1University and ETH Zurich, Zurich, Switzerland
Synopsis
Keywords: Heart, Diffusion Tensor Imaging
Myocardial strains and microstructure are considered important indicators of muscle contractility and function, which can be investigated with cardiac diffusion tensor imaging (cDTI) and tissue-velocity mapping. In this work we perform simulations incorporating contractile motion and model based diffusion contrast to investigate jointly encoding the information by modifying existing cDTI protocols. Key characteristics of the results agree with practical findings and suggest sufficient estimation accuracy for velocities and diffusion tensors.
Introduction
Myocardial strains and microstructure are considered important indicators of muscle contractility and function1-5. Cardiac diffusion tensor imaging (cDTI) allows investigating the microstructure of the myocardium2 which is linked to contraction patterns and myofiber rearrangement. Cardiac muscle contractility has also been inferred upon by measuring tissue velocity during contraction and relaxation3-5. In the present work we hypothesize that, by including Hadamard velocity encoding into cDTI protocols6,9, it is possible to jointly estimate tissue velocities and local diffusion tensors without increasing scan durations. To this end we performed simulations incorporating cardiac contractile motion and model based diffusion to study the accuracy of joint tissue velocity and diffusion tensor mapping.Methods
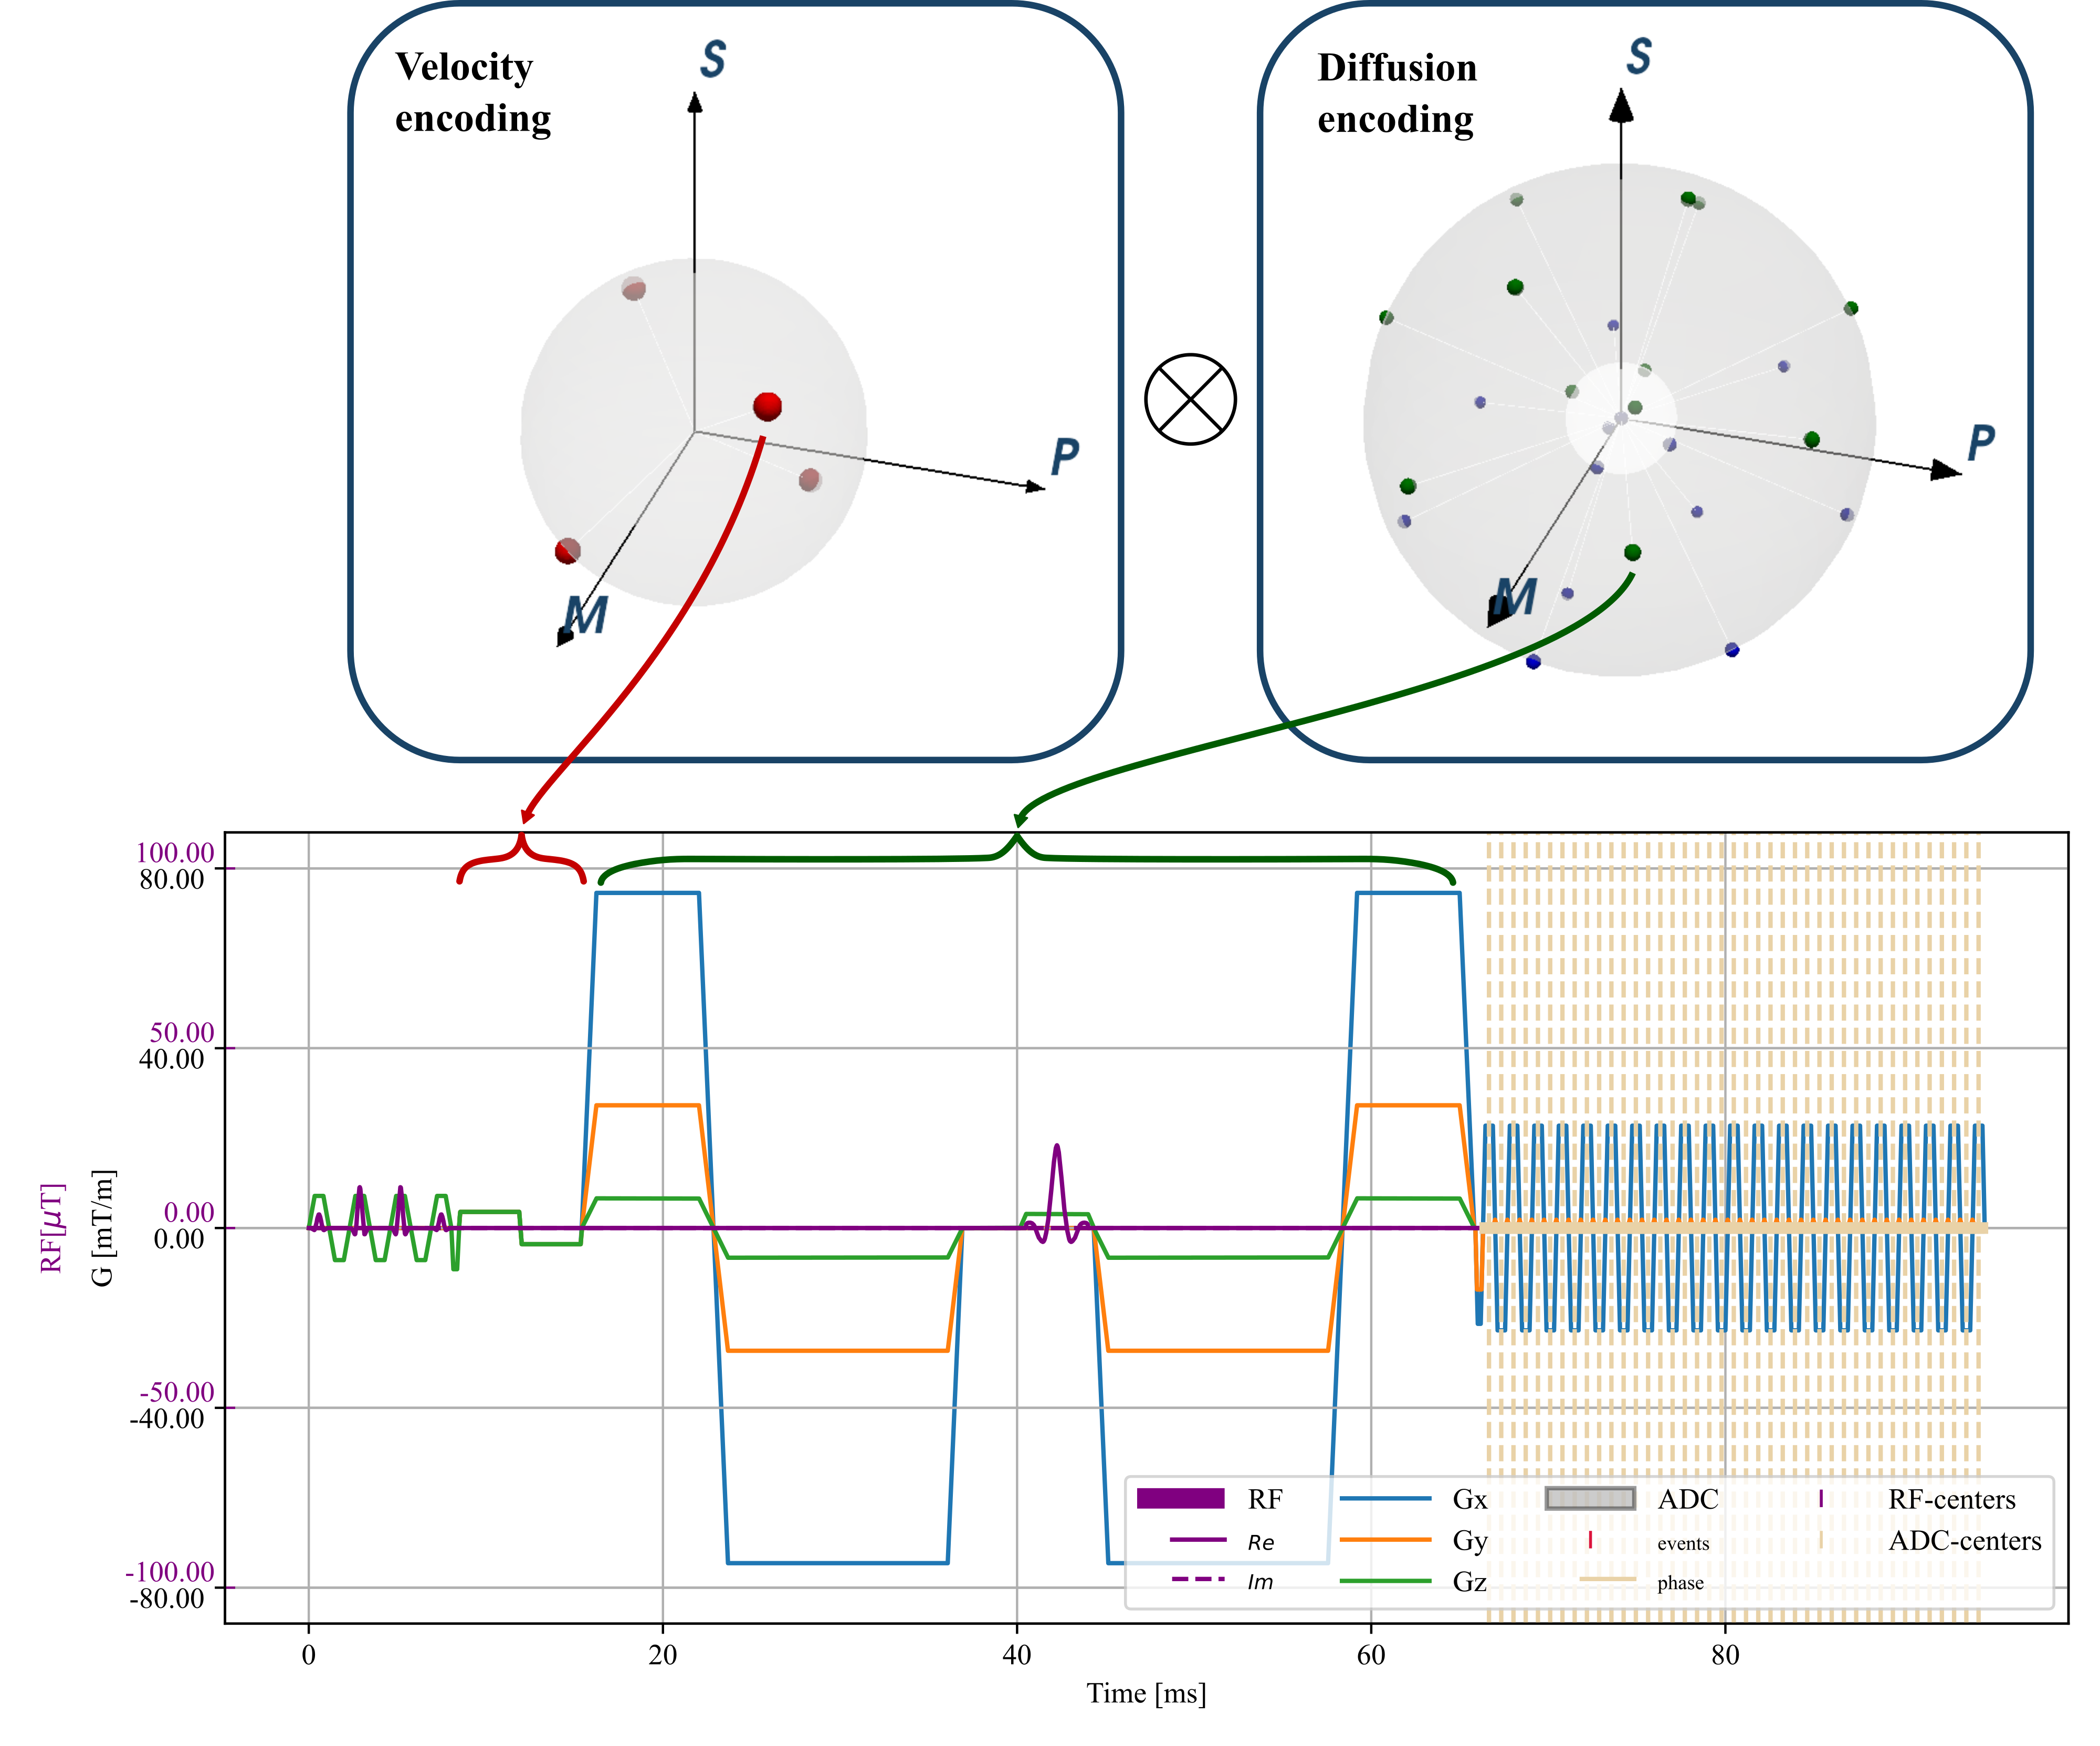
Starting from a spin-echo based cardiac DTI sequence with velocity and acceleration compensation (SE-M012)6, we defined a set of joint encoding gradient waveforms by inserting velocity encoding gradients according to the Hadamard scheme7. These velocity encoding gradients were placed into the delay between excitation and the start of the diffusion sensitization gradients. The available time was $$$6.9ms$$$ when using a 1-3-3-1 binomial excitation pulse with a field-of-view of $$$230\times97mm^2$$$ and a $$$2.35\times2.35 mm^2$$$ resolution (gradient limits of $$$80mT/m$$$ and $$$100T/m/s$$$). Figure 1 illustrates the velocity and diffusion encoding schemes with a VENC of $$$15 cm/s$$$ matching physiological tissue velocities up to $$$10 cm/s$$$3-5. The b-value contribution of the velocity encoding gradients to diffusion encoding was below $$$1\%$$$. All sequence definitions were made using the CMRseq-framework (https://people.ee.ethz.ch/~jweine/cmrseq/latest/index.html).Fig 2 illustrates a 3D left ventricular mesh model used as input and the sequence timings used for simulation with trigger delay of $$$40\%$$$ systole. For diffusion-weighted contrast simulation, the mesh was first refined to avoid inverse crime effects10 and subsequently a diffusion tensor was assigned to each node. Random sampling of smoothly varying diffusion tensors was used on a reference motion state8. Fiber motion and the corresponding tensor update were derived from the local mesh deformations (Fig 3).
The resulting signal for a diffusion weighted spin-echo experiment with single-shot readout including multiple coils was simulated with the CMRsim package (https://people.ee.ethz.ch/~jweine/cmrsim/latest/index.htm) assuming a separation of scale concerning diffusional and bulk motion. Hence, the moving particles were assumed to accumulate phase according to the discretized integration of $$$e^{j\gamma \int_0^{t} \mathbf{G}(t\prime)\mathbf{r}(t\prime)dt\prime}$$$ and magnitude attenuation depending on the diffusion tensor of the particle:
$$s(\mathbf{k}(t))=\left[\Sigma_i^j e^{2\pi\mathbf{k}(t)\mathbf{r}_i(t)}\ C_N(r)\ e^{b\mathbf{g}^T\mathbf{D_i}\mathbf{g}}\ e^{-\frac{|t-TE|}{T_2^{*}}}\ e^{j\gamma\Sigma_l^{T/\delta t}\mathbf{G}(l\delta t)\mathbf{r}_i(l\delta t)\delta t}\ e^{-\frac{TE}{{T_2}_i}}\ (1-e^{-\frac{T_{RR}}{{T_1}_i}})\ {m_0}_i\right]+\eta.$$
The simulation was evaluated for increasing trigger delays ($$$\tau$$$) from $$$35\%$$$ to $$$75\%$$$ of systole with an SNR of ~20. Subsequently, diffusion tensors were estimated from the magnitude images by solving:
$$\mathrm{arg}\min_{\hat{d}}\ |\mathbf{x}-B\hat{d}|^2_2$$with$$\mathbf{x}=[\log(s_1),\log(s_2),...],$$
where $$$s_i$$$ is the pixel-wise signal for all diffusion encodings composing the matrix $$$\mathbf{B}$$$. Tissue velocity per pixel was estimated using the Hadamard decoding matrix:
$$\vec{v}(\vec{r})=\frac{VENC}{\pi}\mathbf{D_v}\vec{\phi}(\vec{r}),\quad\mathbf{D_v}=pinv\begin{pmatrix}1&1&1\\1&-1&-1\\-1&1&-1\\-1&-1&1\end{pmatrix},$$
where $$$\vec{\phi}$$$ is the vector containing the four Hadamard encoded phases.
To evaluate errors in tensor and velocity estimation, three additional reference datasets were simulated using the same SNR and trigger delays:
- (i) no motion phase, without evaluation of the motion-phase operator in eq(1)
- (ii) ‘no venc’, full signal model without added velocity encoding
- (iii) ‘no diffusion’ no diffusion waveform and no magnitude attenuation
Results and Discussion
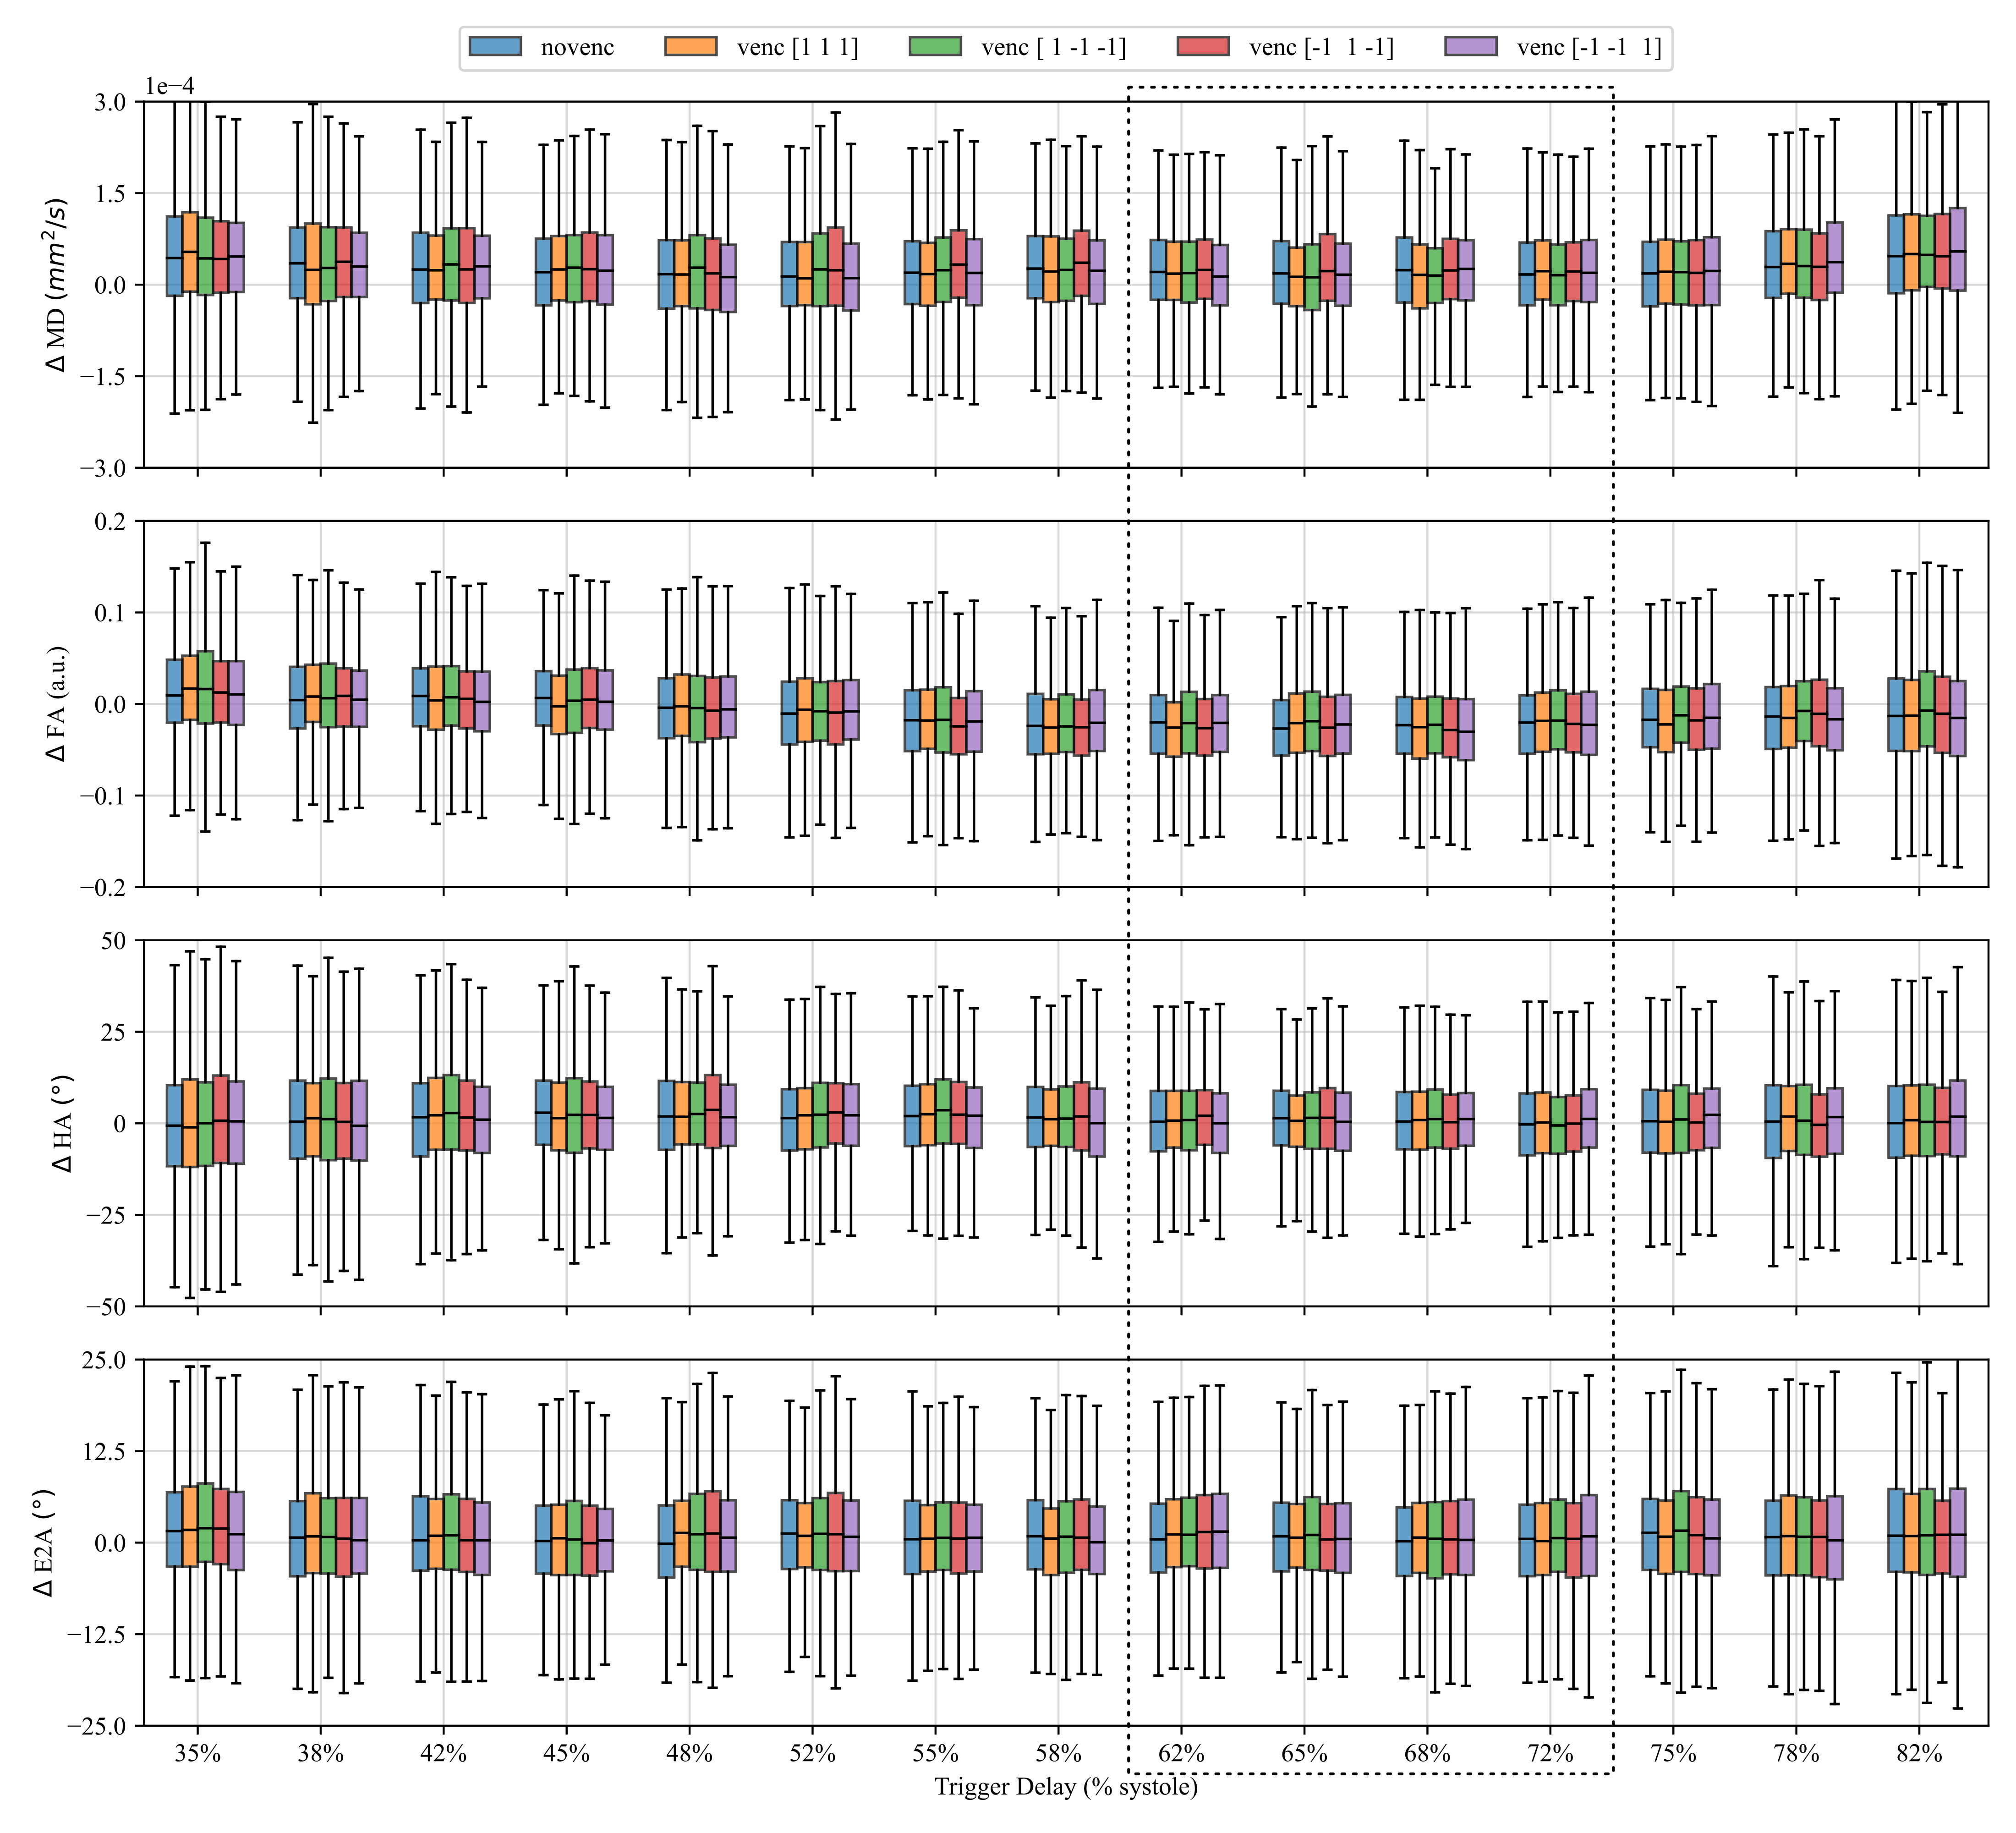
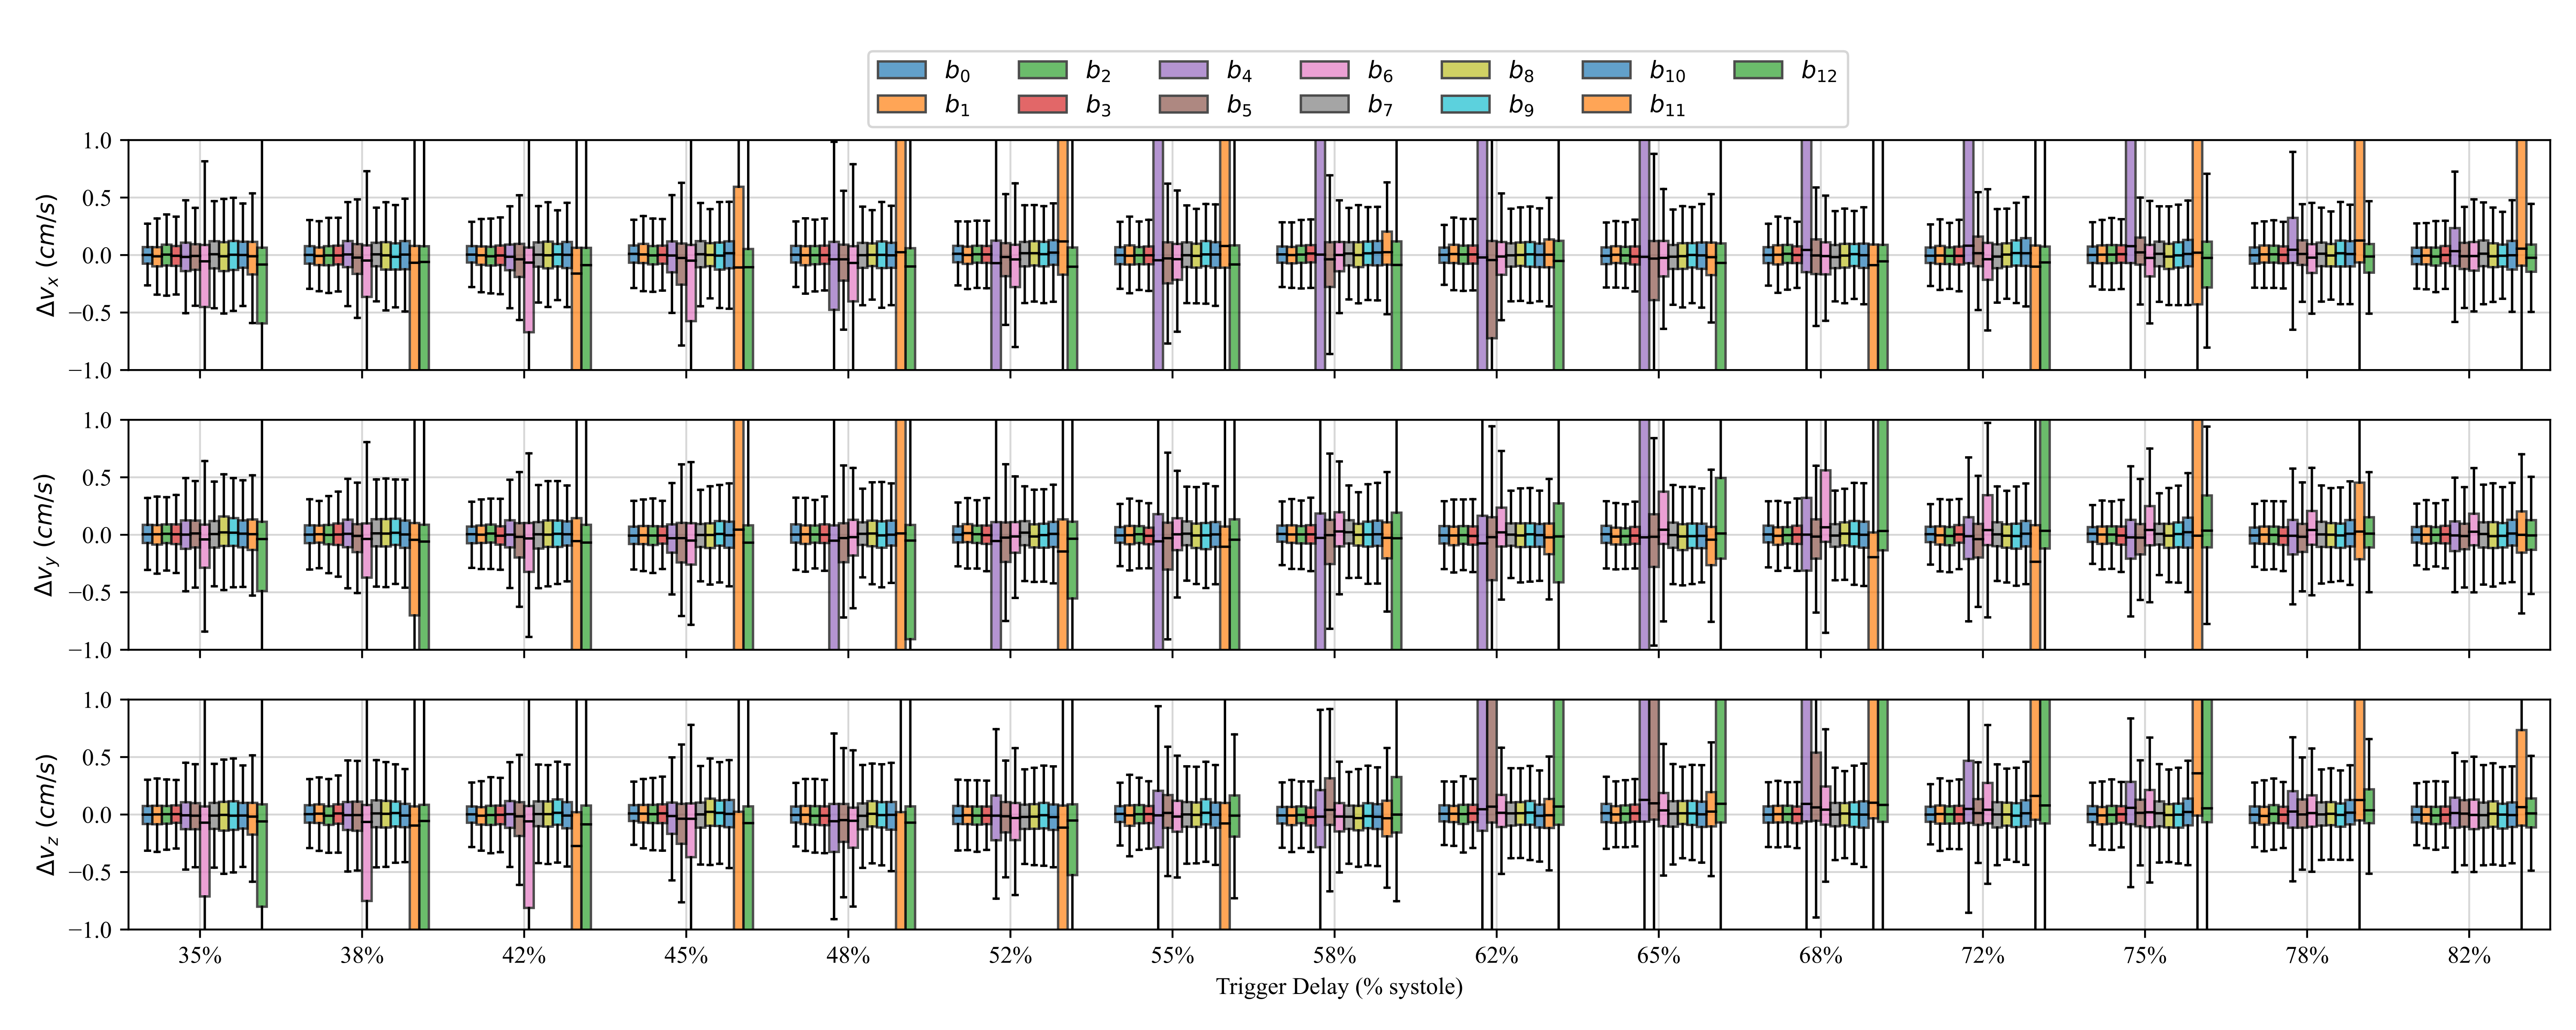
Figure 4 shows the effect of strain on the estimated diffusion tensors and hence the tensor metrics MD, FA, HA and E2A. The overestimation of MD at all trigger delays is consistent with expectations, as deformation results in intra-voxel phase gradients causing a reduced magnitude. Overestimation of FA in the early contraction phase is also expected as longitudinal strain (partially in fiber directions) is higher at the transition from iso-volumetric contraction to ejection as can be seen in Fig 2. HA and E2A are accurately estimated at trigger delays between $$$60\%-70\%$$$ systole (marked as dashed box in Fig. 4), which also reflects practical findings9. Errors vary only slightly between different velocity encoding directions, showing the negligible effect of the additional velocity encoding gradients.Figure 5 shows the difference of estimated velocities for each diffusion weighting with respect to velocity encoding without diffusion weighting. Large deviations of velocity estimations occur for specific diffusion encoding directions at $$$450mm^2/s$$$, as phase wraps were not corrected before estimating the tissue velocity. Overall the interquartile range of velocity estimation errors are smaller than $$$3mm/s$$$ and the median is close to $$$0mm/s$$$ per spatial direction if phase-wraps are neglected which is approximately equal to $$$10\%$$$ of the changes of systolic longitudinal peak velocity for HCM patients4.
Conclusion
We have presented a concept of integrating systolic tissue velocity information within existing cDTI protocols. The method holds potential to provide further insights into the interplay of cardiac tissue motion and microstructure.Acknowledgements
References
1. Cikes M, Solomon SD. Beyond ejection fraction: an integrative approach for assessment of cardiac structure and function in heart failure. Eur. Heart J. 2016;37:1642–1650 doi: 10.1093/EURHEARTJ/EHV510.
2. Nielles-Vallespin S, Scott A, Ferreira P, Khalique Z, Pennell D, Firmin D. Cardiac Diffusion: Technique and Practical Applications. J Magn Reson Imaging 2019 doi: 10.1002/jmri.26912.
3. Jung B, Markl M, Föll D, Hennig J. Investigating myocardial motion by MRI using tissue phase mapping. Eur. J. Cardio-Thoracic Surg. 2006;29:S150–S157 doi: 10.1016/J.EJCTS.2006.02.066.
4. Li A, Ruh A, Berhane H, Robinson JD, Markl M, Rigsby CK. Altered regional myocardial velocities by tissue phase mapping and feature tracking in pediatric patients with hypertrophic cardiomyopathy. Pediatr. Radiol. 2020;50:168 doi: 10.1007/S00247-019-04549-4.
5. Föll D, Jung B, Schilli E, et al. Magnetic resonance tissue phase mapping of myocardial motion new insight in age and gender. Circ. Cardiovasc. Imaging 2010;3:54–64 doi: 10.1161/CIRCIMAGING.108.813857.
6. Stoeck CT, von Deuster C, Genet M, Atkinson D, Kozerke S. Second-order motion-compensated spin echo diffusion tensor imaging of the human heart. Magn Reson Med 2016;75:1669–1676 doi: 10.1002/mrm.25784.
7. Guenthner C, Runge JH, Sinkus R, Kozerke S. Analysis and improvement of motion encoding in magnetic resonance elastography. NMR Biomed. 2018;31:e3908 doi: 10.1002/NBM.3908.
8. Weine J, van Gorkum RJH, Stoeck CT, Vishnevskiy V, Kozerke S. Synthetically trained convolutional neural networks for improved tensor estimation from free-breathing cardiac DTI. Comput. Med. Imaging Graph. 2022;99:102075 doi: 10.1016/J.COMPMEDIMAG.2022.102075.
9. Stoeck CT, von Deuster C, van Gorkum RJH, Kozerke S. Motion and eddy current–induced signal dephasing in in vivo cardiac DTI. Magn. Reson. Med. 2020;84:277–288 doi: 10.1002/MRM.28132.
10. Guerquin-Kern M, Lejeune L, Pruessmann KP, Unser M. Realistic Analytical Phantoms for Parallel Magnetic Resonance Imaging. IEEE Trans. Med. Imaging 2012;31 doi: 10.1109/TMI.2011.2174158.
Figures