0334
Cardiac structure discontinuities revealed by ex-vivo microstructural characterization on the Basal Inferoseptal Left Ventricle region.1Univ. Bordeaux, CNRS, CRMSB, UMR 5536, Bordeaux, France, 2Liryc, Electrophysiology and Heart Modeling Institute, Fondation Bordeaux Université, Pessac-Bordeaux, France, 3Inria Epione Team, Université Côte d'Azur, Biot, France, 4Centre de Neuroscience Cognitive, CNRS, Université Claude Bernard Lyon I, Villeurbanne, France, 5Cardiology Departement, Bordeaux University Hospital (CHU), Pessac, France
Synopsis
Keywords: Myocardium, Microstructure, Fiber
The knowledge of the cardiac microstructure and the 3D myofiber architecture grow years after years with the multiplication and the upgrade of imaging technologies. However, the course of events of pathophysiological processes like cardiac remodeling, and the link with clinical phenotypes are not yet clearly understood. Some concerns have been raised regarding the interpretation of the late gadolinium enhancement (LGE) at the right ventricle attachment or insertion point (RVIP) however 3D microstructure organization of the RVIP has not been extensively described in the literature.Introduction
The purpose of the present work is to characterize in ex-vivo human hearts, the inferior septal myocyte fiber orientation and assess its functional impact in electrophysiology. In particular, it aims to detail the 3D structure organization by identifying the myofiber organization with high-resolution diffusion MRI at 600 µm and anatomical images at 150 µm. In addition, based on the observed human experimental data, we model the effects of fiber orientation on cardiac electrophysiology (EP), computing local activation times and pseudo-ECGs.Methods
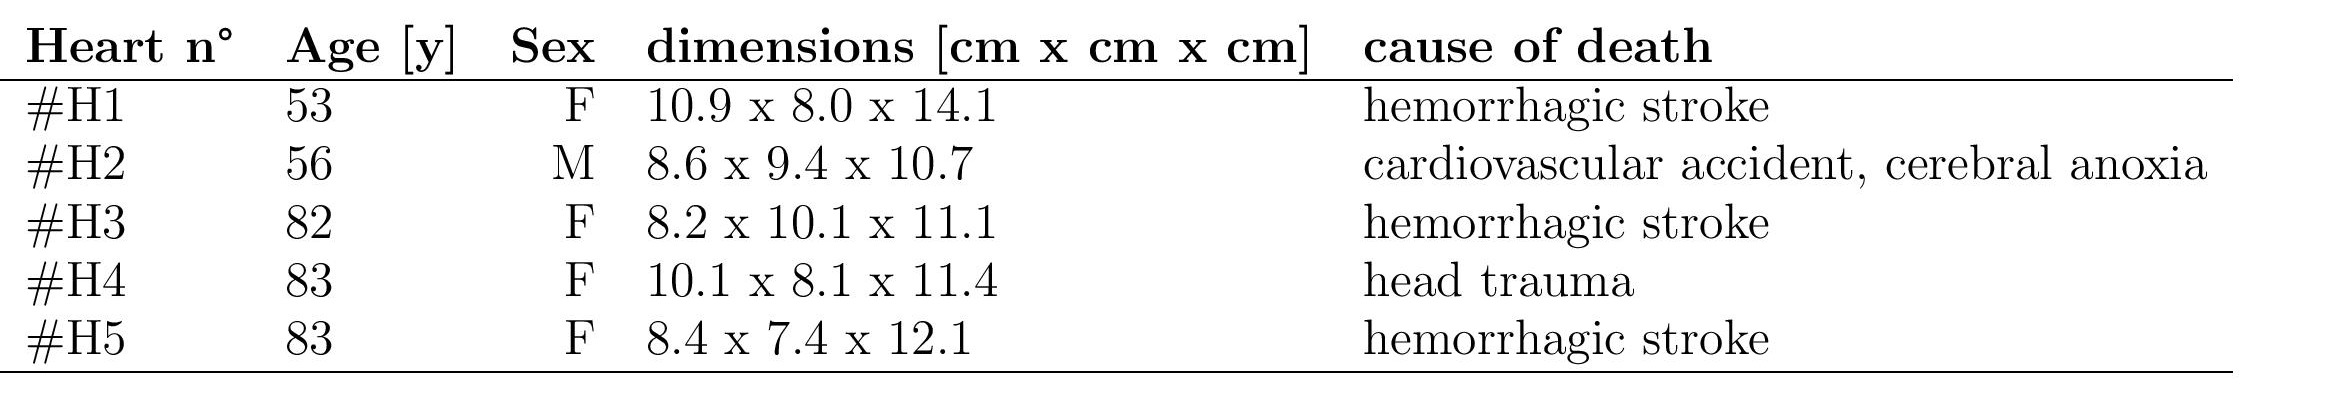
Samples: Human samples were derived from the Human donor program “CADENCE” approved by the “Agence Française de la Biomédecine'’. The experiment was conducted in accordance with the declaration of Helsinki and the institutional ethic’s committee. Five hearts (71±15.5 yo) were used in the study. A brief summary is available in Figure 1. Sample preparation was already described in[1,2]. Prior to MRI acquisition, the heart was removed from formalin and immersed into Fomblin oil to reduce susceptibility artifacts.Acquisition: MRI acquisitions were performed at 9.4T/30cm (Bruker BioSpin, Germany) with a 7 elements transmit/receive array coil (165 mm inner diameter). DT-MRI was carried out with a set of 6 directions using a 3D diffusion-weighted spin-echo sequence (TR/TE/FOV=500 ms/22 ms/110x100x80 mm3 ,flip angle=30°), at an isotropic resolution of 600 μm.Anatomical image was performed with a gradient echo sequence (TR/TE/FOV=30 ms/9 ms/110x100x80 mm3) with an isotropic resolution of 150 μm. All MRI scans and experiment acquisitions were similar to those described previously by Magat[1,2,3].
Processing: Diffusion tensor maps (eigenvalues, fractional anisotropy (FA),eigenvectors, apparent diffusion coefficient (ADC), and color-coded FA (cFA)) were obtained with MRtrix3 software[4,5]. The first DT eigenvector v1 was associated with the main myofiber orientation. All images, tensors and DTI derived metrics were reoriented in long axis orientation using ANTs[6].
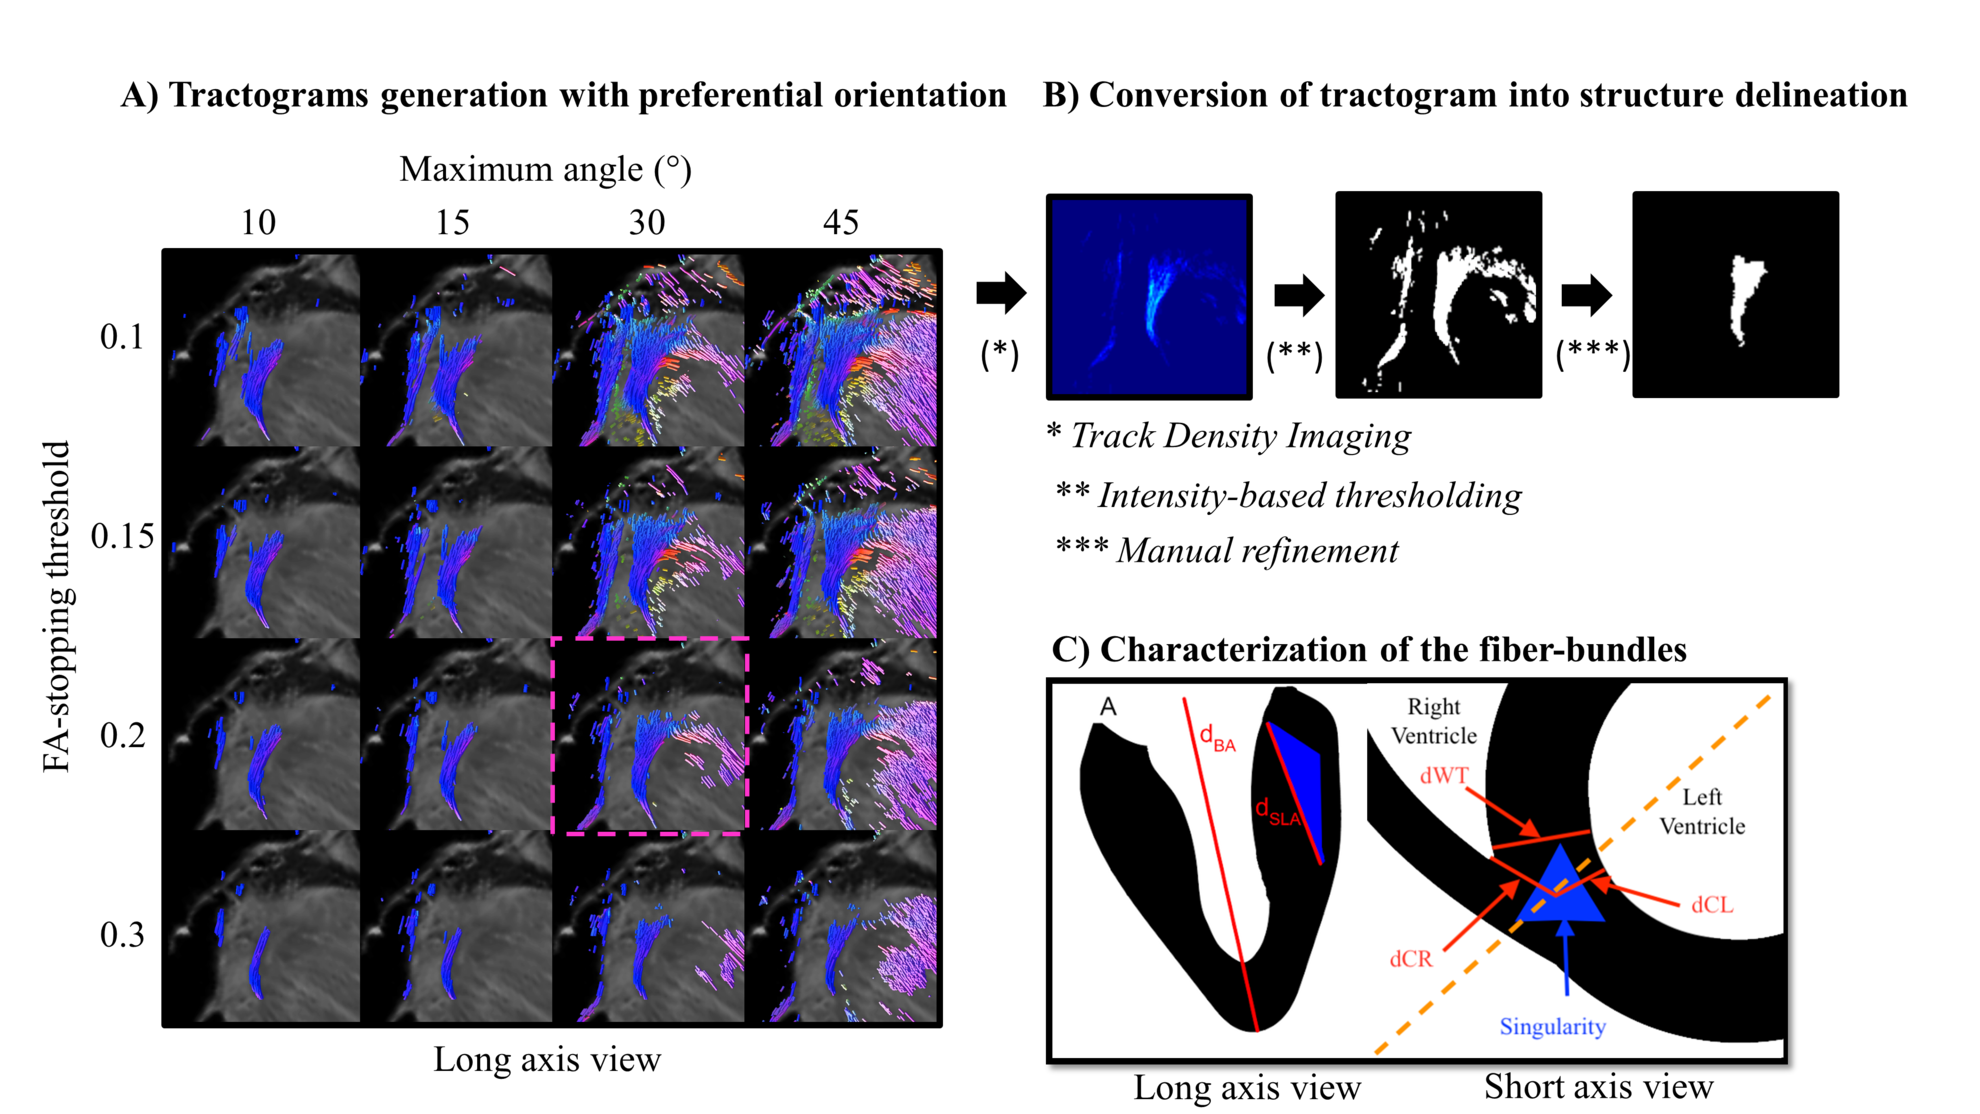
Delineation of the fiber-bundles: Tractography processing was adapted to delimitate and quantify the size of fiber-bundles located at the RVIP, also referred to as the singularity. First, multiple tractrograms have been generated with a preferential orientation to long axis and variable parameters (FA-stop threshold and maximum angle parameters) as referred on Figure 2.A. Streamlines were generated with the FACT algorithm[7] using the principal eigenvector of the diffusion tensor. Second, a set of parameters were arbitrarily chosen (cut-off=0.2,max_angle=30°). Lastly, the chosen tractrograms were converted into a label using Track Density Imaging[8] (see Figure 2.B) .
Sizing of the fiber-bundles: To quantify the size of the singularity compared to the whole heart, distances were manually measured in long and short axis cardiac orientation as described on Figure 2.C.
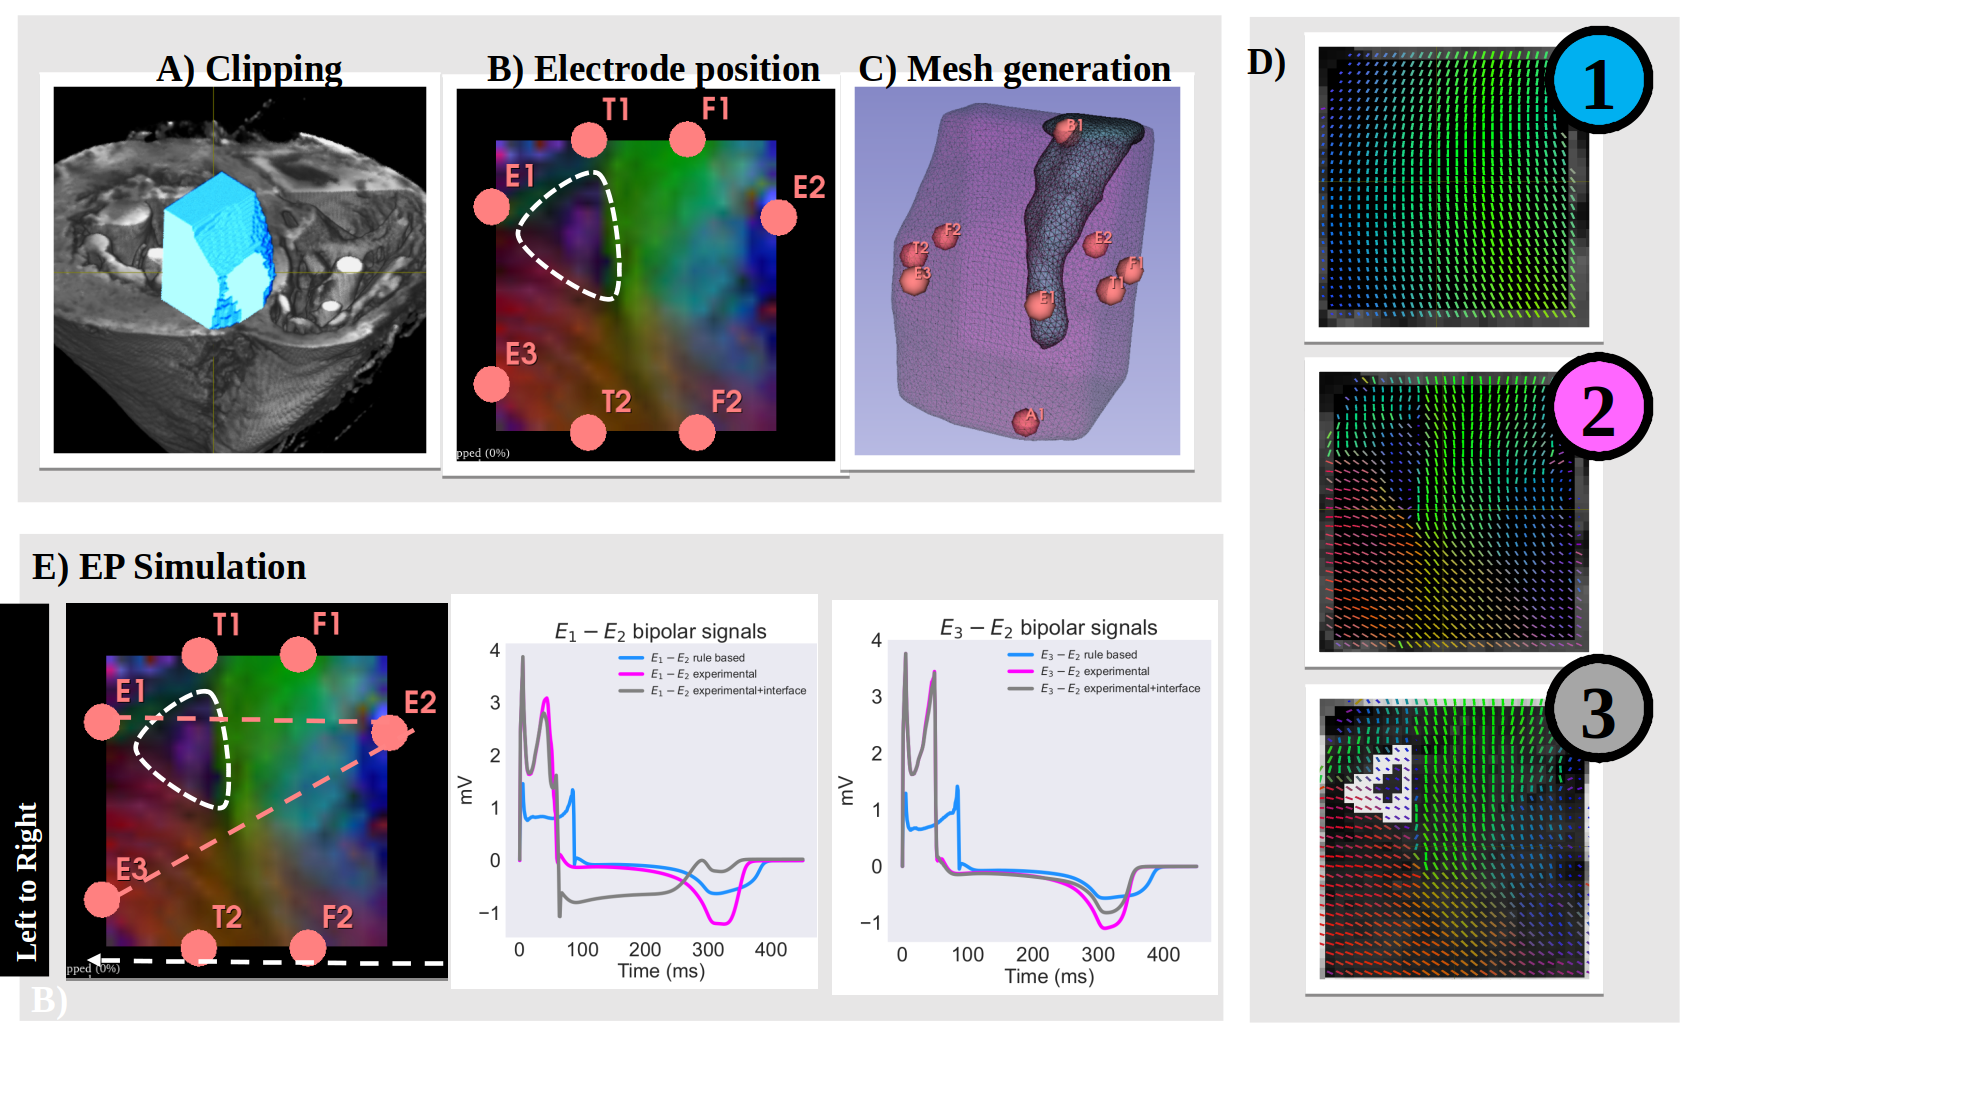
Cardiac Electrophysiology simulation: A 1.7×1.8×2.5 cm wedge was constructed to represent the basal inferoseptal wall of the first sample. First, we created a fiber configuration by means of a rule-based algorithm[9]. This geometry served as a reference for our computations. Second, we mapped the experimental fiber configuration obtained from DTI to our wedge using interpolation by inverse distance weighting. Lastly, additional to the experimental fiber configuration obtained from DTI, we included an interface surrounding the triangular pattern where the fibers are oriented in the apicobasal direction. Local activation time and pseudo-ECGs were computed for each scenario.
Results
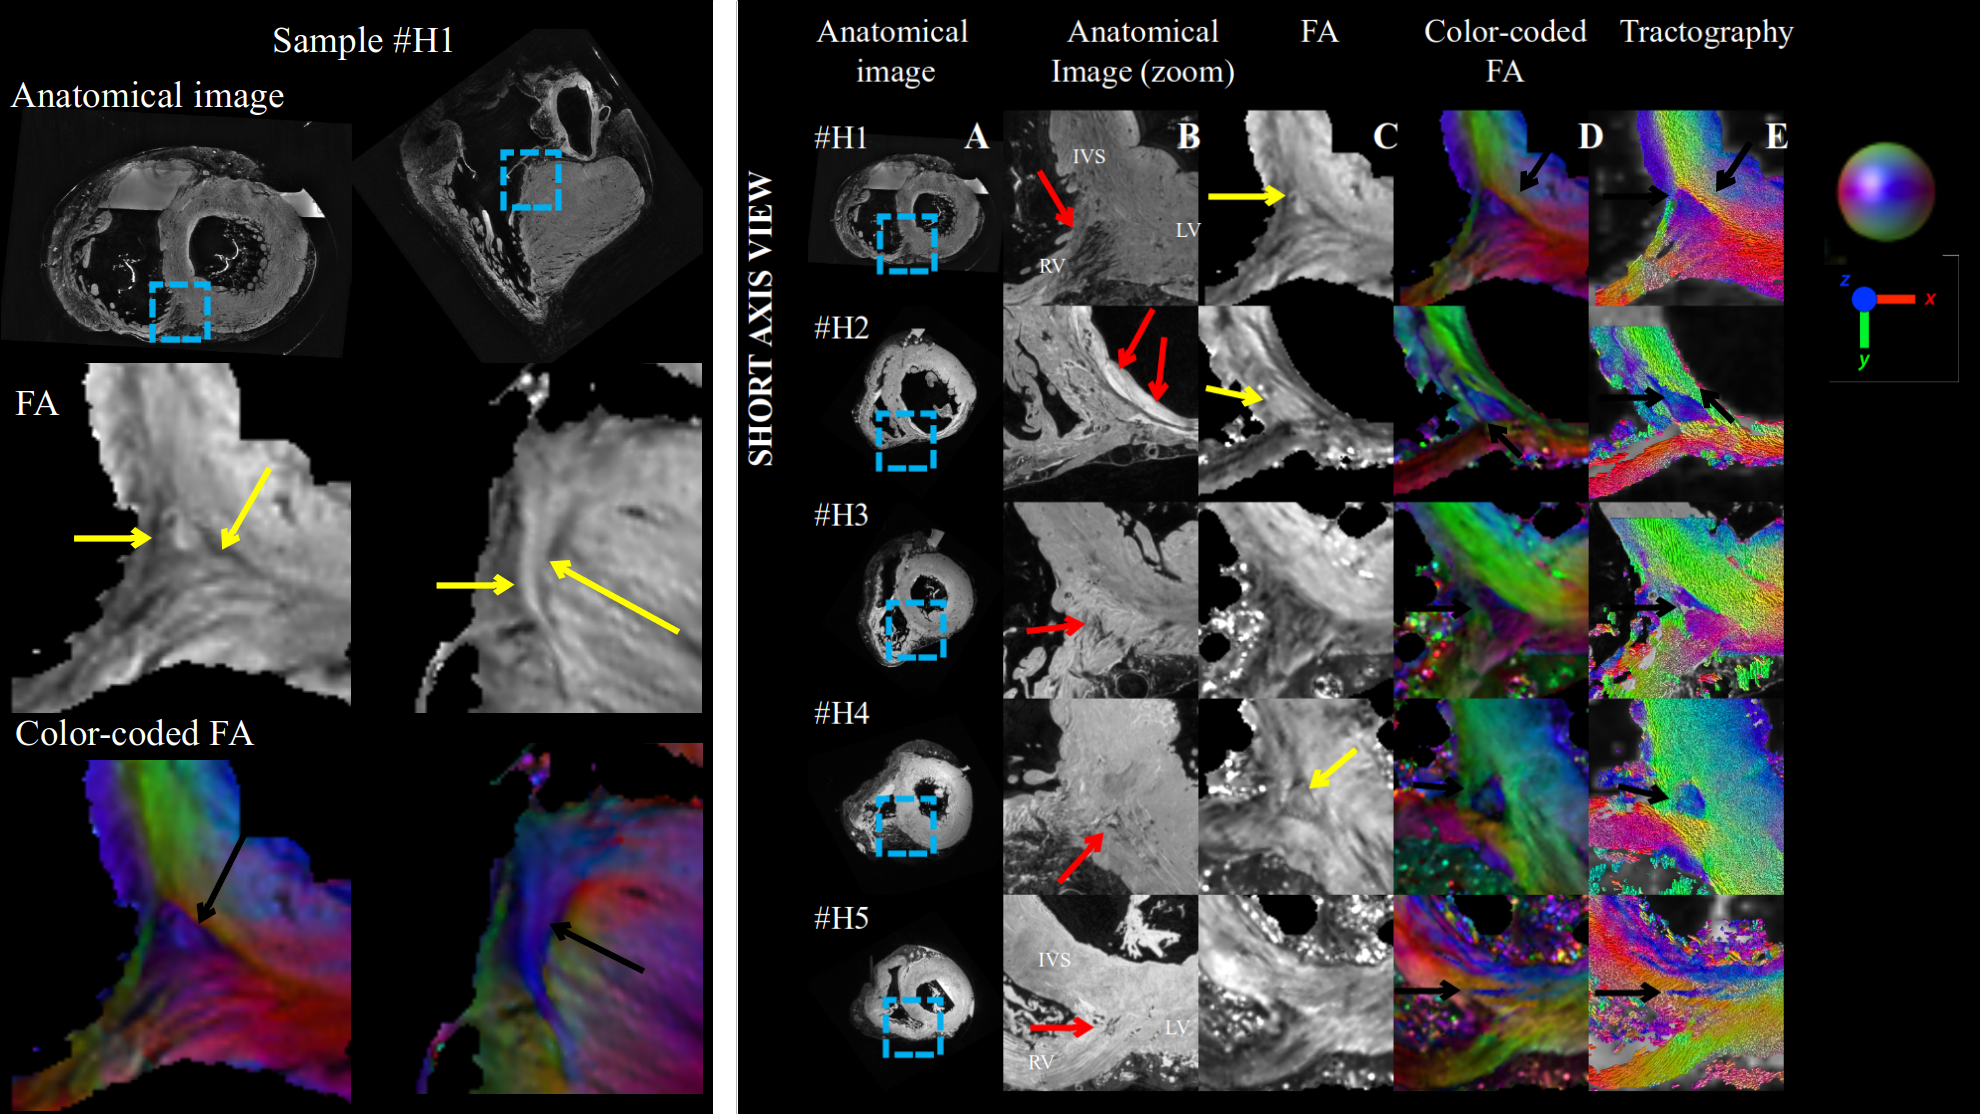
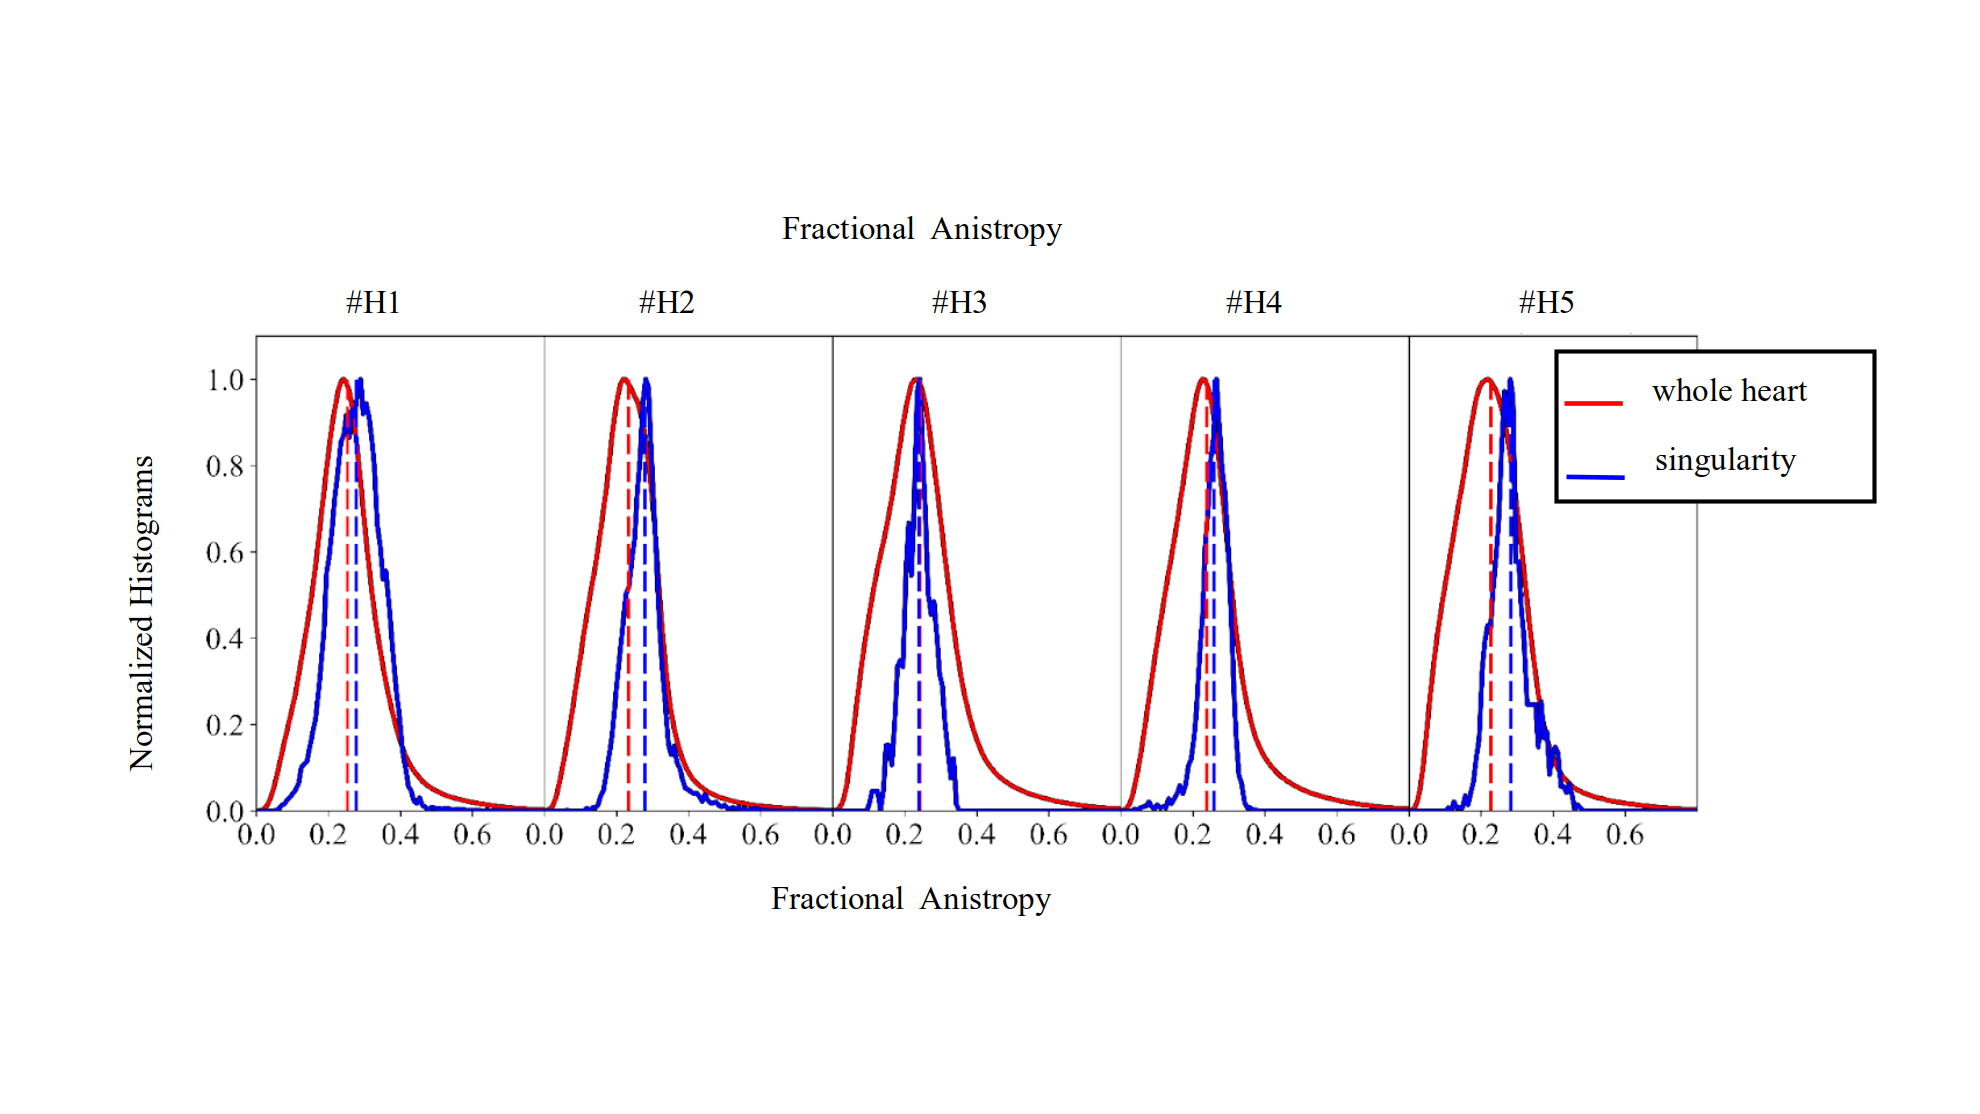
Figure 3 highlights the existence of fiber discontinuity with the presence of FA decrease (pointed by yellow arrow on the FA maps) and a triangle shape arrangement of fibers (pointed by black arrow on the cFA maps) in basal-apical direction starting at the inferobasal crux and ending at the middle of inferoseptal wall of the LV. The pattern was visible on all samples. The distribution of the FA on Figure 4 was found equal or higher in the singularity (0.28±0.06) than in the whole heart (0.24±0.09), indicating higher anisotropy in this area. dBA of the ventricle ranged from 70 to 85 mm. dWT was 14±1 mm and showed higher variability for human hearts. dSLA was estimated to 23±5.6mm with the exception of the sample #H5. The singularity is closer to the RV cavity than the LV cavity as the wall thickness of the LV is higher. The volume of the singularity ranged from 0.1-0.6 cm3 (mean 0.3±0.15 cm3 ). For all activation patterns, incorporating the experimental fiber orientation slows the wavefront propagation leading to significant delay ranging from 10-40 ms. The influence of fiber orientation is then reflected in the pseudo-ECGs (amplitude changed from 1.97 mV to 4.85 mV and 4.58 mV for rule-based, experimental, experimental with interface, respectevily) and more apparent for bipolar points crossing the interface (Figure 5).Discussions
The RVIP at the level of the inferior septum presents a unique arrangement of myocardial fibers. At this level, an abrupt, mid-myocardial change in fiber orientation can be observed, delimiting a triangle-shaped region, present in human hearts. The fiber orientation of this region creates an obstacle to wavefront propagation in a simulated wedge model. While different configurations and sizes were reported in the study and in other mammalian species[1], the low number of ex-vivo human samples cannot extend the finding to the general population as most donors had a history of heart disease.Acknowledgements
No acknowledgement found.References
1. Magat, J., et al.,PLoS One, 2022. 17(7): p. e0271279.DOI:https://doi.org/10.1371/journal.pone.0271279
2. Magat J, Ozenne V, Cedilnik N, MAGMA. 2021 Oct;34(5):741-755. DOI: 10.1007/s10334-021-00913-4. Epub 2021 Feb 27. PMID: 33638739; PMCID: PMC8421292.
3. Rodríguez-Padilla J, Petras A, Magat. Am J Physiol Heart Circ Physiol.
2022 Jun 1;322(6):H936-H952. DOI: 10.1152/ajpheart.00050.2022. Epub
2022 Mar 18. PMID: 35302879; PMCID: PMC9109800.
4.Tournier, J.D., F. Calamante, and A. Connelly,Neuroimage, 2007. 35(4): p. 1459-72.DOI: 10.1016/j.neuroimage.2007.02.016
5.Tournier, J.D., F. Calamante, and A. Connelly.International journal of imaging systems and technology, 2012. 22(1): p. 53-66. https://doi.org/10.1002/ima.22005
6.Paul A. Yushkevich, Joseph Piven, Heather Cody Hazlett. Neuroimage 2006 Jul 1;31(3):1116-28.DOI: 10.1016/j.neuroimage.2006.01.015
7.Mori, S., et al.,. Ann Neurol, 1999. 45(2): p. 265-9.DOI: 10.1002/1531-8249(199902)45:2<265::aid-ana21>3.0.co;2-3
8. Calamante, F., et al.,Neuroimage, 2010. 53(4): p. 1233-43. DOI: 10.1016/j.neuroimage.2010.07.024
9.Bayer, J.D., et al. Ann Biomed Eng, 2012. 40(10): p. 2243-54.DOI: 10.1007/s10439-012-0593-5
Figures