0333
Diffusion dispersion mapping of ischemic lesions in the ex vivo porcine heart1Institute for Biomedical Engineering, ETH Zurich and University of Zurich, Zurich, Switzerland, 2Center for Surgical Research, University Hospital Zurich, University of Zurich, Zurich, Switzerland
Synopsis
Keywords: Heart, Ischemia
Diffusion dispersion mapping is a recently proposed method for probing tissue microstructure and quantifying microstructural disorder based on differences in the impact of diffusion restrictions over different length scales. In this work, this method was employed in the ex vivo heart to investigate the utility of diffusion dispersion in identifying and characterizing ischemic tissue. Our results show that ischemic cardiac lesions exhibit reduced diffusion dispersion rates, in agreement with known microstructural changes, and can be differentiated with respect to surrounding tissue. These findings demonstrate that microstructure-sensitive contrast offers a novel avenue for probing and characterizing cardiac pathologies.Introduction
Diffusion dispersion mapping1 is a recently proposed method for probing tissue microstructure that employs pulsed gradient (PG) and oscillating gradient (OG) diffusion sequences to measure the spectral power of diffusion. The diffusion dispersion rate, Λ, is a quantitative measure of the frequency dependence of diffusivity, resulting from the varying impact of diffusion restrictions over different length scales, and informs on disorder in the microstructural environment,2,3 where greater Λ represents a shorter spatial scale of diffusion restrictions. Diffusion dispersion mapping has until now only been applied in neuroimaging, but relevant applications exist in other tissues/organs, particularly for pathologies that result in microstructural changes.One such example is myocardial infarction (MI), an ischemic event in the heart that leads to degradation of cell membranes and vasculature in the ischemic region.4,5 Such changes in the infarct region are known to lead to elevated mean diffusivity (MD) and reduced fractional anisotropy (FA);6 however, the frequency dependence of diffusion tensor metrics in ischemic lesions has not yet been studied. In this work, we investigate the utility of diffusion dispersion in differentiating ischemic cardiac tissue in the ex vivo porcine heart using an improved fitting of the dispersion model.
Methods
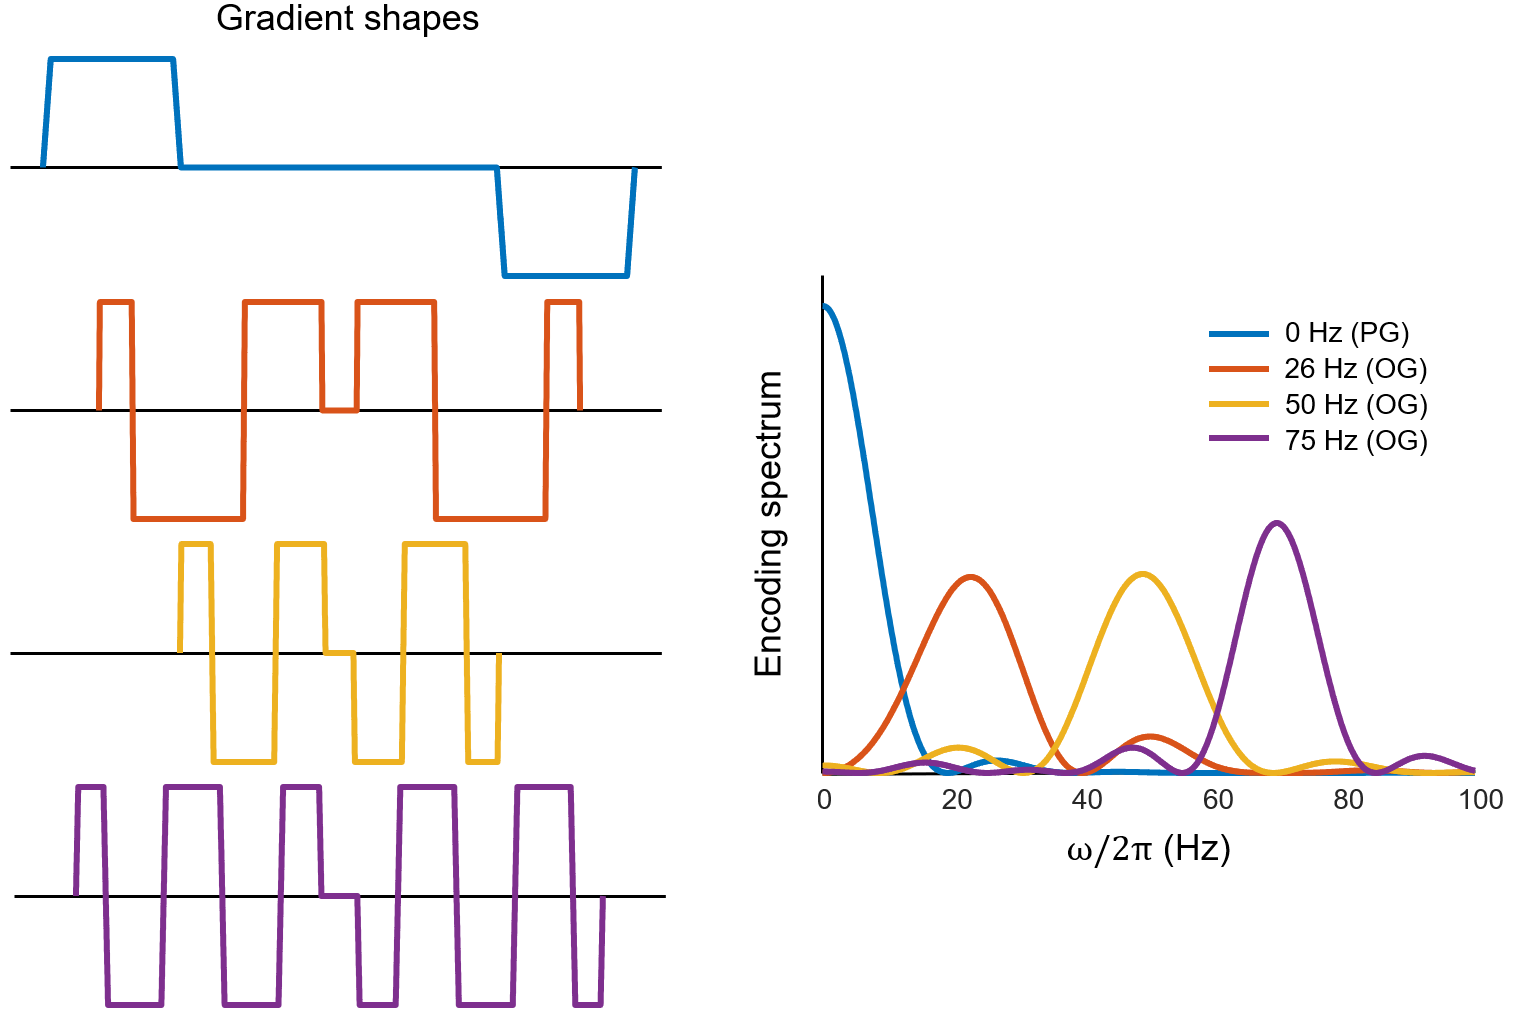
Scanning was performed on nine porcine hearts, of which five had chronic MI (120 min. balloon occlusion of the left circumflex (N = 4) or distal left anterior descending artery (N = 1); organ harvest nine weeks after MI)4 and four were healthy controls, which were fixated in a 4% formalin solution. The hearts were imaged using a 3T Philips Achieva system (Philips Healthcare, Best, the Netherlands) equipped with a high-performance gradient insert coil (Gmax = 200 mT/m).7 Each heart was scanned using $$$b=500$$$ s/mm2 PGSE DTI and OGSE DTI sequences with spiral readouts. The centroid frequencies of the OGSE waveforms8,9 were 26, 50, and 71 Hz (Figure 1). Other scan parameters were 10 slices, 1.5 mm in-plane resolution, 3 mm slice thickness, TR/TE = 5600/70 ms, six $$$b=0$$$ acquisitions, and 16 diffusion directions. An inversion recovery sequence was also performed for identification of lesioned areas.Diffusion tensors were fitted voxelwise, incorporating b-tensor spatial variations.10 MD, axial diffusivity (AD), and radial diffusivity (RD) were subsequently computed. Diffusion dispersion maps were generated via voxelwise fitting of the power law model to MD data: $$$\mathrm{MD}(\omega)=\mathrm{MD}_{\omega=0}+{\Lambda}\omega^{\theta}$$$, where $$$\theta=0.5$$$ is assumed, which corresponds to short-range disorder in two dimensions.2 This model was fitted using two sets of nominal sampling frequencies:
- The centroid of the encoding spectrum $$${\lvert}F(\omega)\rvert^2$$$, $$$\omega=\frac{\int_{0}^{\infty}{\lvert}F(\omega)\rvert^2{\omega}d\omega}{\int_{0}^{\infty}{\lvert}F(\omega)\rvert^2d\omega}$$$, for OGSE and 0 Hz for PGSE, per common convention
- The frequency given by $$$\omega=\left(\frac{\int_{0}^{\infty}{\lvert}F(\omega)\rvert^2\omega^{0.5}d\omega}{\int_{0}^{\infty}{\lvert}F(\omega)\rvert^2d\omega}\right)^2$$$ for PGSE and OGSE
Results
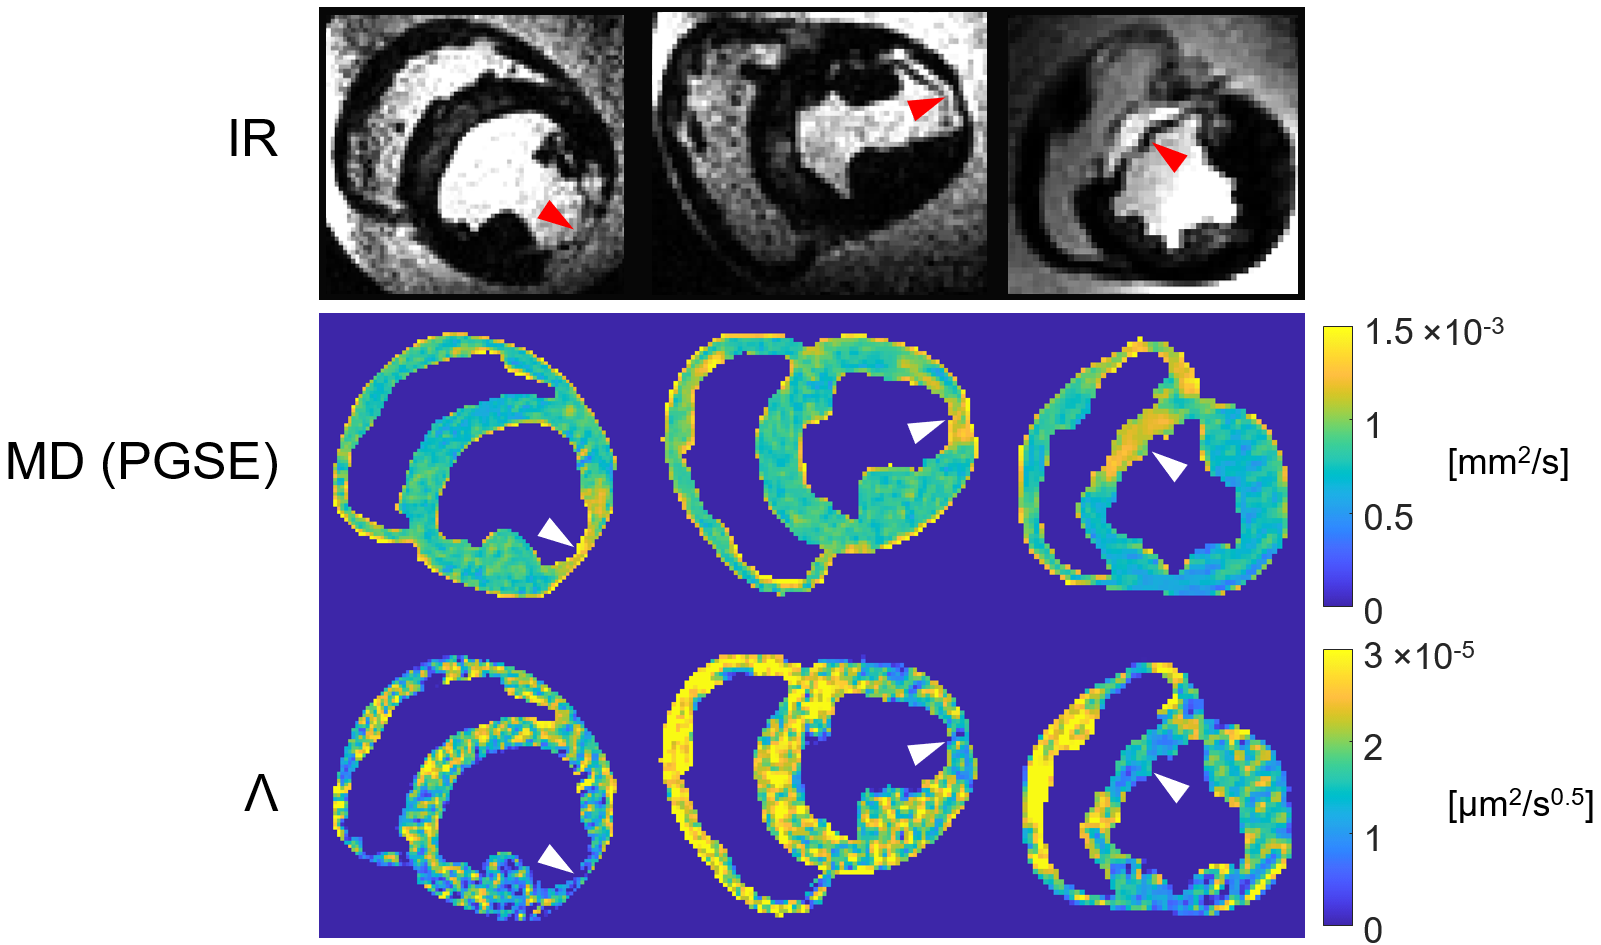
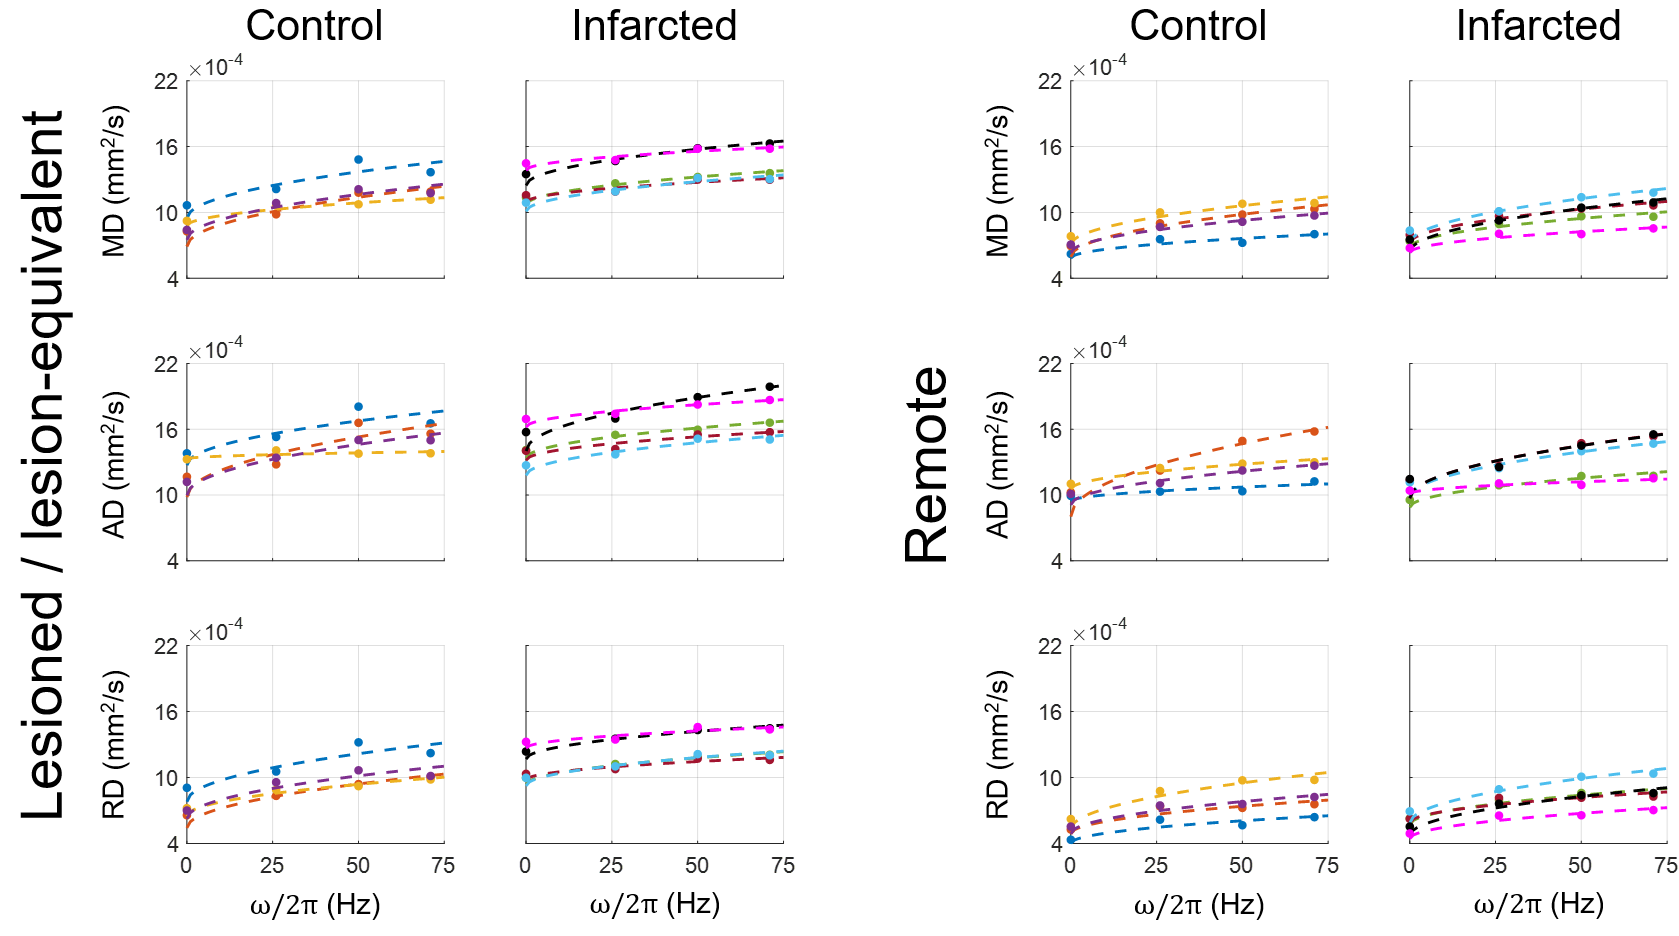
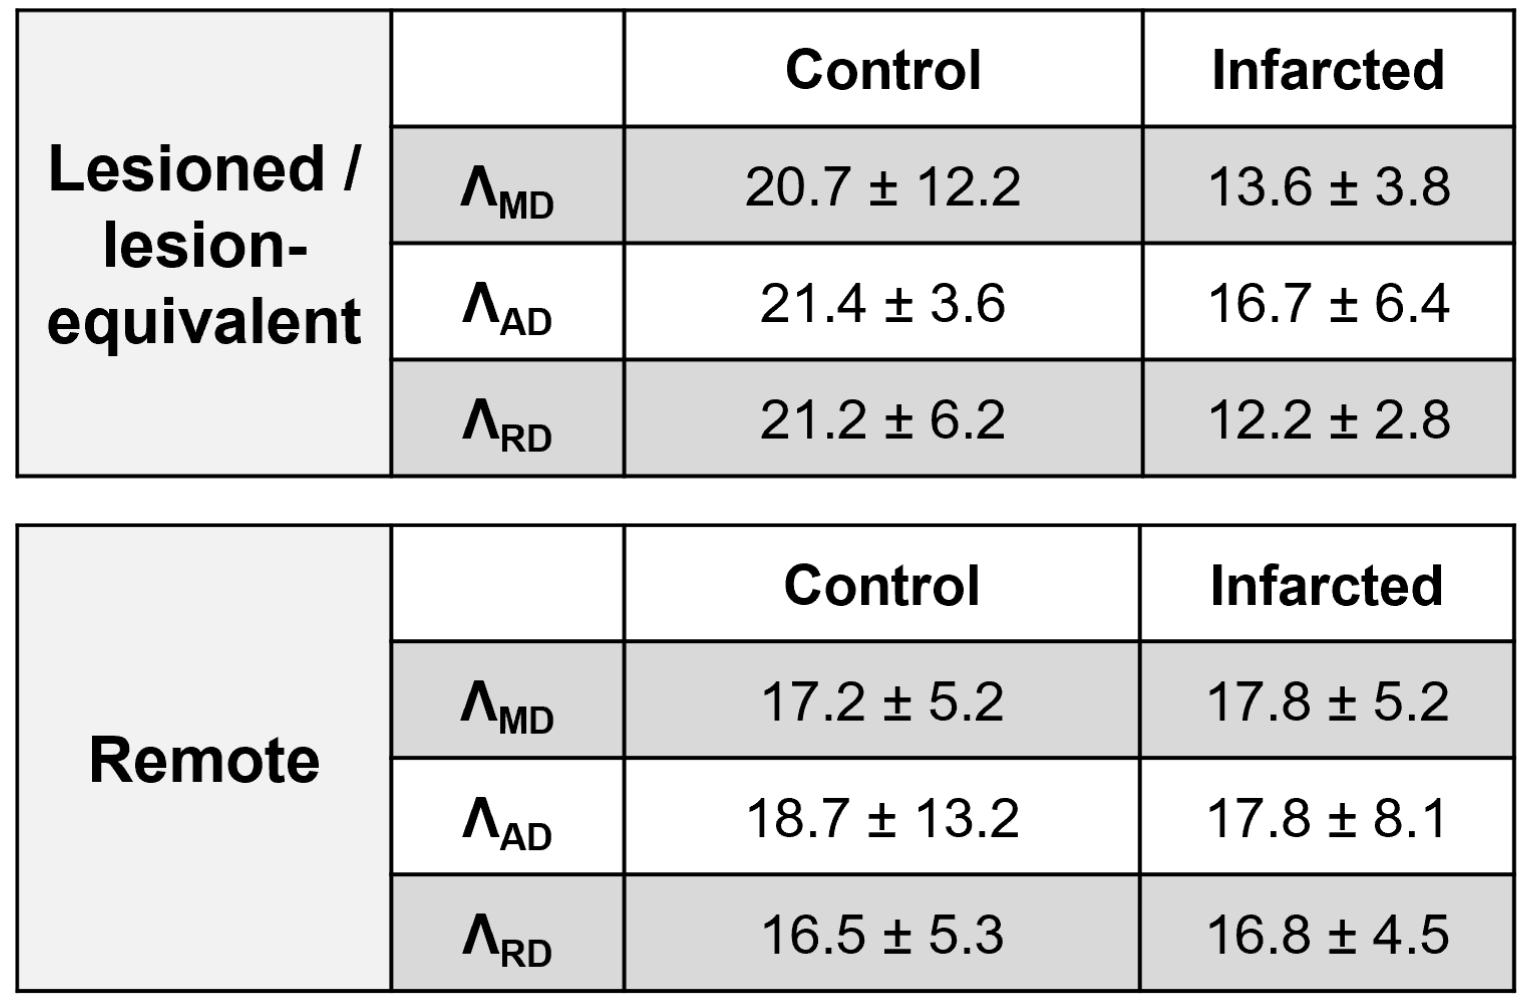
Figure 2 shows IR images, MD maps at 0 Hz, and Λ maps for representative slices containing lesions for three of the infarcted hearts.Figure 3 depicts the frequency dependences of MD, AD, and RD for both control and infarcted groups in lesioned/lesion-equivalent and remote regions, with statistics of the corresponding diffusion dispersion rates tabulated in Table 1.
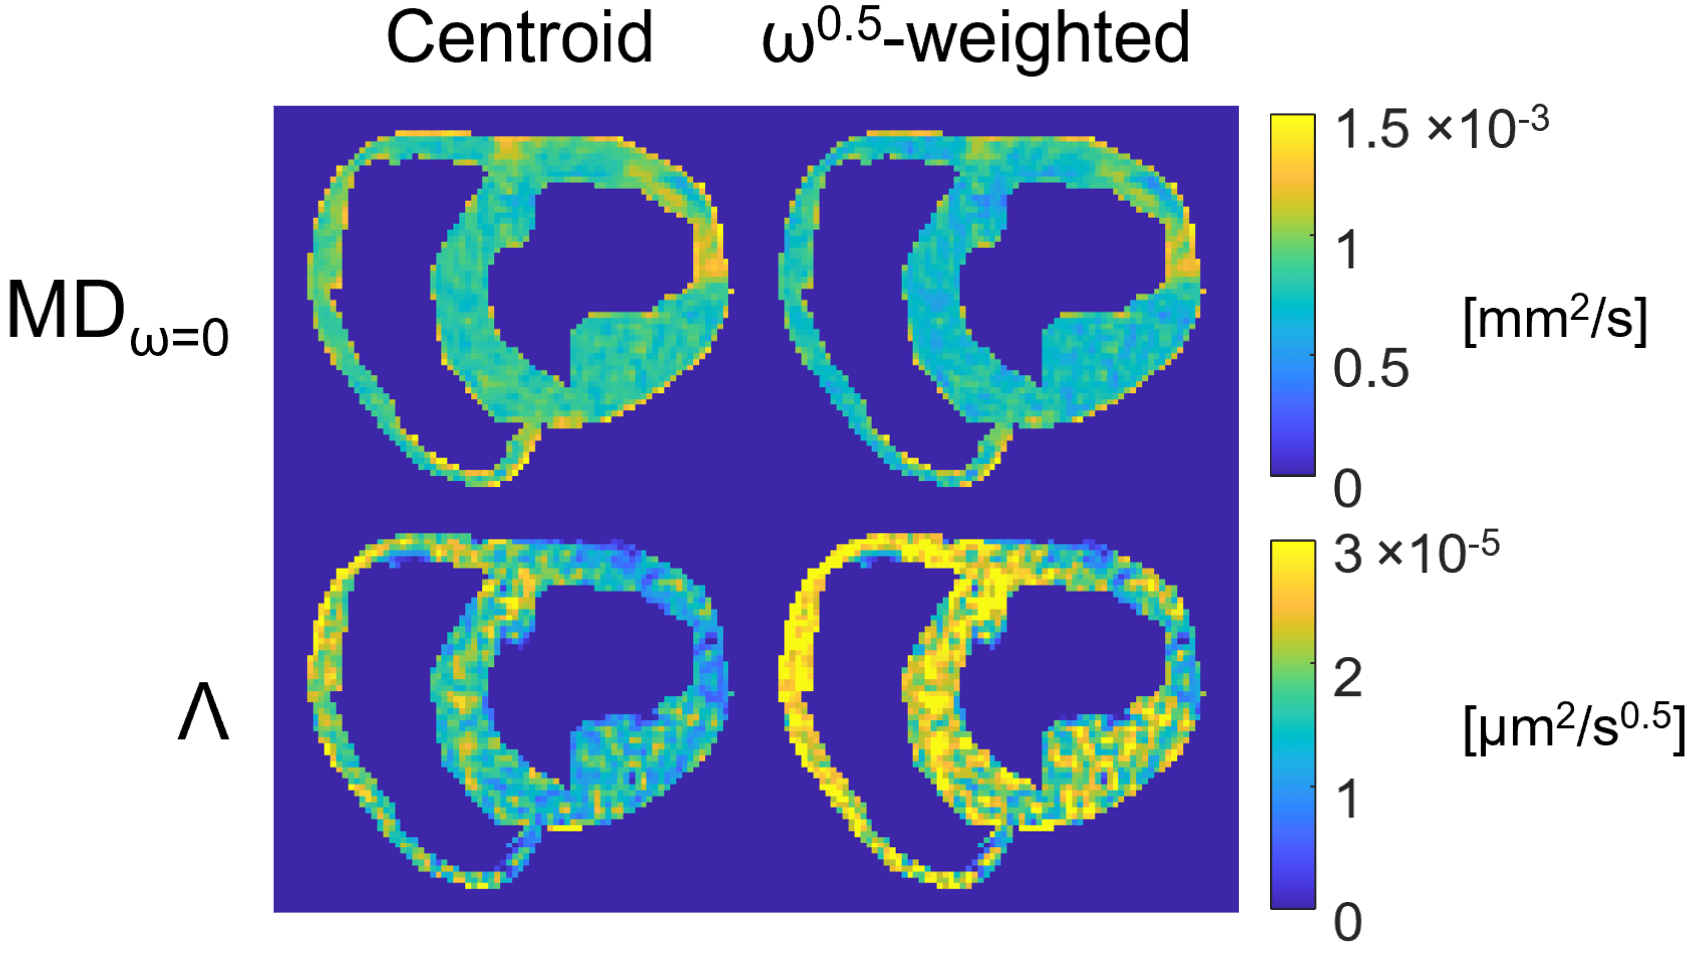
Figure 4 shows the fitting results of MDω=0 and Λ with the two sets of nominal sampling frequencies.
Discussion
In Figure 2, ischemic lesions, which exhibit hyperintensities in IR images and elevated MD, are characterized by reduced diffusion dispersion rates with respect to surrounding tissue. The reduction in dispersion is likely explained by the rupturing of cell membranes in infarcted tissue, which represents a reduction in restrictions and prolongation of the mean free pathway.4,11This observation is corroborated by Figure 3, where a slight flattening of the frequency dependences of all diffusivities is apparent for the lesioned regions of the infarcted hearts with respect to lesion-equivalent regions of the control hearts, and by Table 1, where corresponding reduced dispersion rates are seen. In the remote tissue, on the other hand, there exist no clear differences between infarcted and control hearts in terms of Λ.
From Figure 4, it can be deduced that using conventional nominal frequencies biases diffusion dispersion fits, leading to increased MDω=0 and reduced Λ with respect to fit results that use nominal frequencies corresponding to the assumed dispersion exponent; this bias primarily results from neglecting contributions from $$$\omega>0$$$ in the PGSE measurement. When a spectral model is assumed/known, incorporating the model into the fitted frequencies promises the most quantitatively accurate result.
Conclusion
Our results indicate that ischemic events in the heart result in microstructural changes that can be identified in diffusion dispersion maps as reduced diffusion dispersion rates. The sensitivity of diffusion dispersion to changes in diffusion restrictions over different length scales represents an additional dimension for characterizing microstructural changes and offers another avenue for evaluating cardiac pathologies.Acknowledgements
No acknowledgement found.References
1. Arbabi A, Kai J, Khan AR, Baron CA. Diffusion dispersion imaging: Mapping oscillating gradient spin-echo frequency dependence in the human brain. Magn Reson Med. 2020;83(6):2197-2208.
2. Novikov DS, Jensen JH, Helpern JA, Fieremans E. Revealing mesoscopic structural universality with diffusion. Proc Natl Acad Sci USA. 2014;111(14):5088-5093.
3. Burcaw LM, Fieremans E, Novikov DS. Mesoscopic structure of neuronal tracts from time-dependent diffusion. Neuroimage. 2015;114:18-37.
4. Stoeck CT, von Deuster C, Fuetterer M, et al. Cardiovascular magnetic resonance imaging of functional and microstructural changes of the heart in a longitudinal pig model of acute to chronic myocardial infarction. J Cardiovasc Magn Reson. 2021;23(1):103.
5. Wu M-T, Tseng W-YI, Su M-YM, et al. Diffusion tensor magnetic resonance imaging mapping the fiber architecture remodeling in human myocardium after infarction. Circulation. 2006;114(10):1036-1045.
6. Wu Y, Chan CW, Nicholls JM, Liao S, Tse H-F, Wu EX. MR study of the effect of infarct size and location on left ventricular functional and microstructural alterations in porcine models. J Magn Reson Imaging. 2009;29(2):305-312.
7. Weiger M, Overweg J, Rösler MB, et al. A high-performance gradient insert for rapid and short-T2 imaging at full duty cycle. Magn Reson Med. 2018;79(6):3256-3266.
8. Hennel F, Michael ES, Pruessmann KP. Improved gradient waveforms for oscillating gradient spin-echo (OGSE) diffusion tensor imaging. NMR Biomed. 2021;34(2):e4434.
9. Michael ES, Hennel F, Pruessmann KP. Evaluating diffusion dispersion across an extended range of b-values and frequencies: Exploiting gap-filled OGSE shapes, strong gradients, and spiral readouts. Magn Reson Med. 2022;87(6):2710-2723.
10. Bammer R, Markl M, Barnett A, et al. Analysis and generalized correction of the effect of spatial gradient field distortions in diffusion-weighted imaging. Magn Reson Med. 2003;50(3):560-569.
11. Abdullah OM, Drakos SG, Diakos NA, et al. Characterization of diffuse fibrosis in the failing human heart via diffusion tensor imaging and quantitative histological validation. NMR Biomed. 2014;27(11):1378-1386.
Figures