0332
Free-breathing mapping of stress/rest myocardial T1 reactivity with Ferumoxytol-enhanced imaging using a widely available sequence1Laboratory for Translational Imaging of Microcirculation, Indiana University School of Medicine, Indianapolis, IN, United States, 2Krannert Cardiovascular Research Center, Indiana University School of Medicine, Indianapolis, IN, United States
Synopsis
Keywords: Myocardium, Ischemia, dobutamine
Myocardial T1 reactivity, defined as the relative T1 change from rest to stress, has been proposed as a marker for detection of ischemic heart disease. Commonly used MOLLI T1 mapping is sensitive to B0 field inhomogeneities and can have susceptibility/banding artifacts because of bSSFP readouts, especially at 3T. In this study, we investigated the feasibility of free-breathing SR-FLASH T1 mapping for ferumoxytol-enhanced (FE) dobutamine-stress T1 reactivity studies at 3T in preclinical settings. We showed the feasibility of using a widely available perfusion sequence for T1 reactivity studies under Ferumoxytol-enhancement.Background
Myocardial T1 reactivity, defined as the myocardial T1 change in response to exercise or pharmacological stress relative to the baseline/resting T1 value, has been proposed as a novel marker for detection of ischemic heart disease.1,2 In such studies, MOLLI-based T1 mapping is commonly used due to its high precision and wide availability across different scanner platforms.3-5 MOLLI uses balanced steady-state (bSSFP) readouts and hence is sensitive to B0 field inhomogeneities which can result in susceptibility/banding artifacts, especially at 3T. Furthermore, in T1 reactivity patient studies which require either exercise or pharmacological stress, it may not be feasible to perform breath-hold scans. In such settings, free-breathing MOLLI scans will need to be performed which, due to the varying tissue/blood contrasts (across different inversion times), may lead to inaccurate T1 values as a result of imperfect registration. In this work, we propose a “single-point T1 mapping” approach using a saturation-recovery (SR) prepared FLASH (SR-FLASH) with a fixed SR time, which is the same pulse sequence as the one commonly used for first-pass myocardial perfusion MRI studies.6 Although SR-FLASH-based imaging has lower signal-to-noise ratio (SNR) than bSSFP-based T1 mapping techniques, this can be compensate for by (1) continuous acquisition of multiple frames to “average out” the noise in the image series, (2) SNR enhancement by administering a T1-reducing intravascular contrast agent such as ferumoxytol. In addition, the consistent contrast in SR-FLASH image series enables inline nonrigid motion correction to perform consistently in free-breathing settings. In this study, we investigated the feasibility of free-breathing SR-FLASH T1 mapping for ferumoxytol-enhanced (FE) dobutamine-stress T1 reactivity studies at 3T in a preclinical setting.Methods
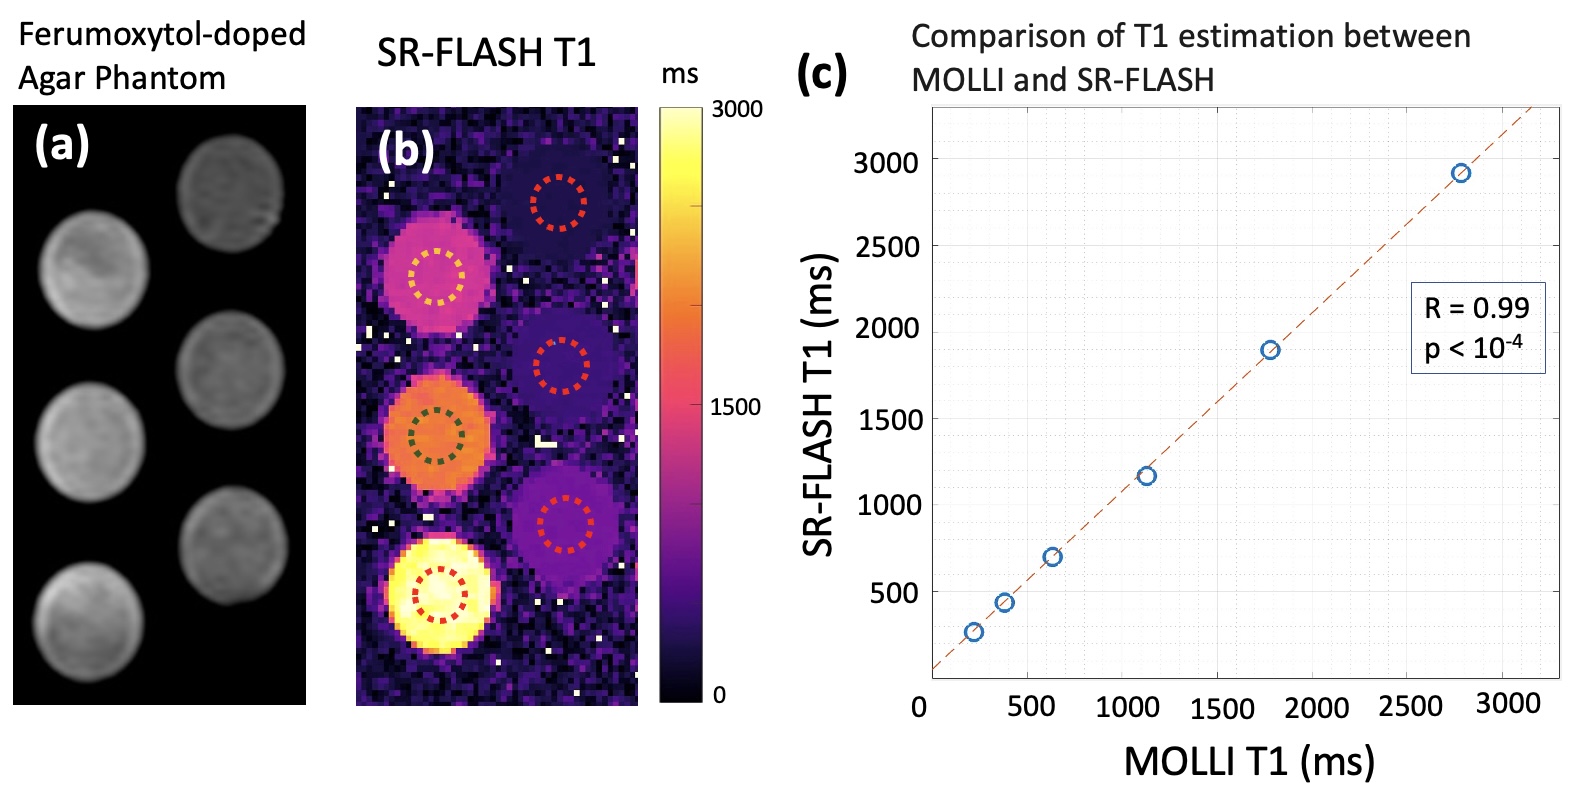
We conducted stress/rest FE studies on a clinical whole-body scanner (Siemens) at 3T in 6 healthy pigs under a wide range of dobutamine-induced stress heart rates (to mimic exercise stress). Data was acquired using both the established MOLLI-based T1 mapping approach and our proposed SR-FLASH-based T1 reactivity mapping. For SR-FLASH scans, we used a widely available perfusion sequence with following parameters: TE/TR = 1.08/1.97 ms, flip angle = 14o, SR time = 150 ms, matrix = 130x160 with GRAPPA factor = 2. We acquired 1 proton-density (PD) weighted and 28 T1-weighted images and used the “single-point T1 mapping” approach often used in quantitative perfusion techniques. 6 To validate our T1 quantification scheme, we conducted phantom studies with ferumoxytol-doped agar to compare vs MOLLI. In the pig studies, we manually segmented the myocardium (2 readers in consensus) avoiding partial volume effects, and performed the analysis on a “bull’s eye map” by dividing the myocardium into 12 angular and 3 radial subsectors. We evaluated the agreement between SR-FLASH and MOLLI in the anteroseptal sector as in-vivo validation for SR-FLASH. We then analyzed the agreement between neighboring subsectors in anterior wall (the region that is less prone to bSSFP-related artifacts) and the inferior wall (the region more sensitive to bSSFP-related artifacts) for both MOLLI and SR-FLASH maps.Results
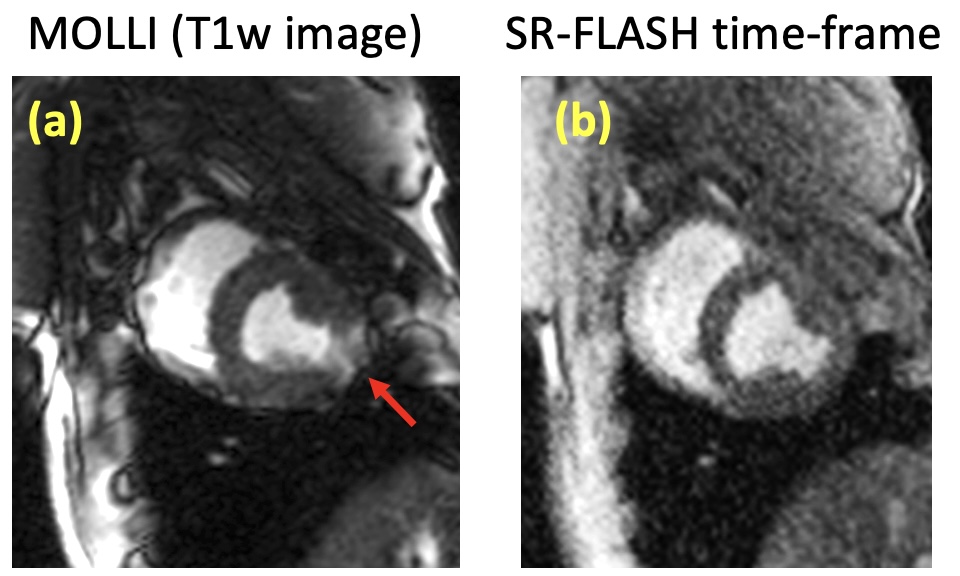
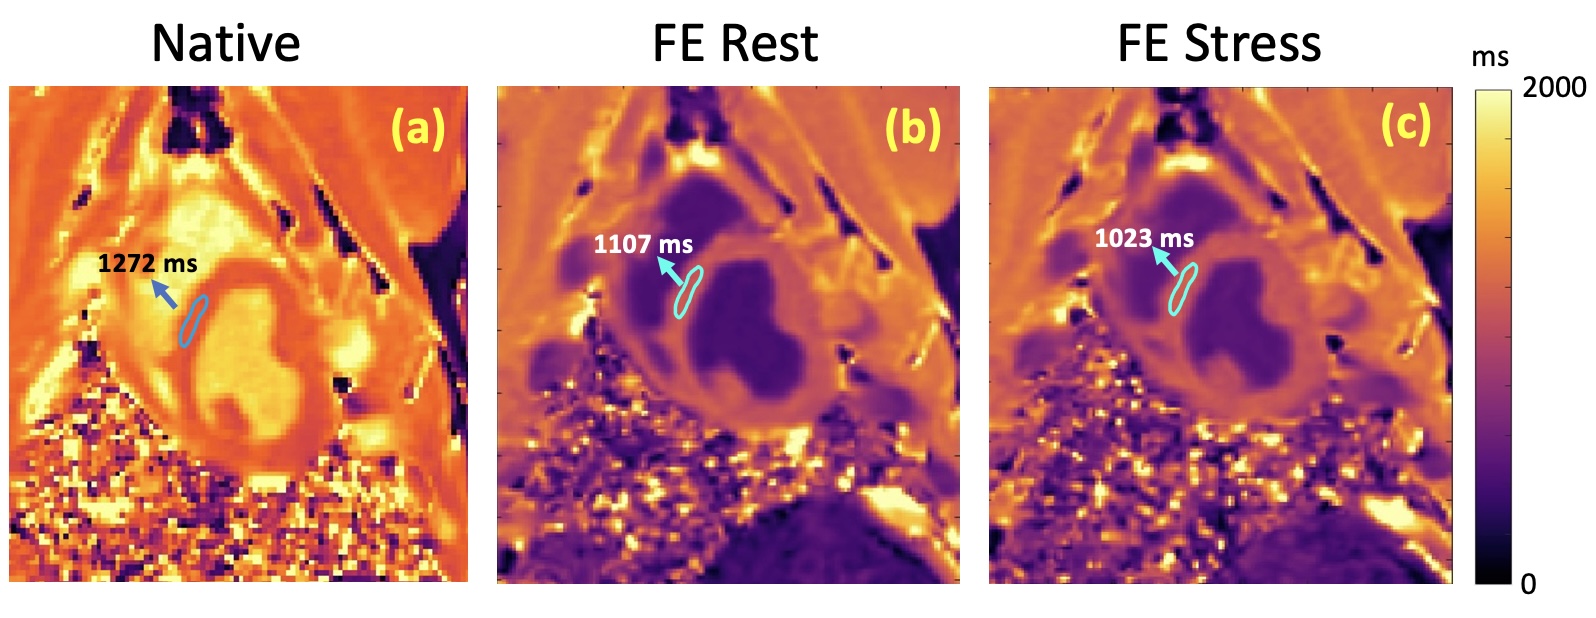
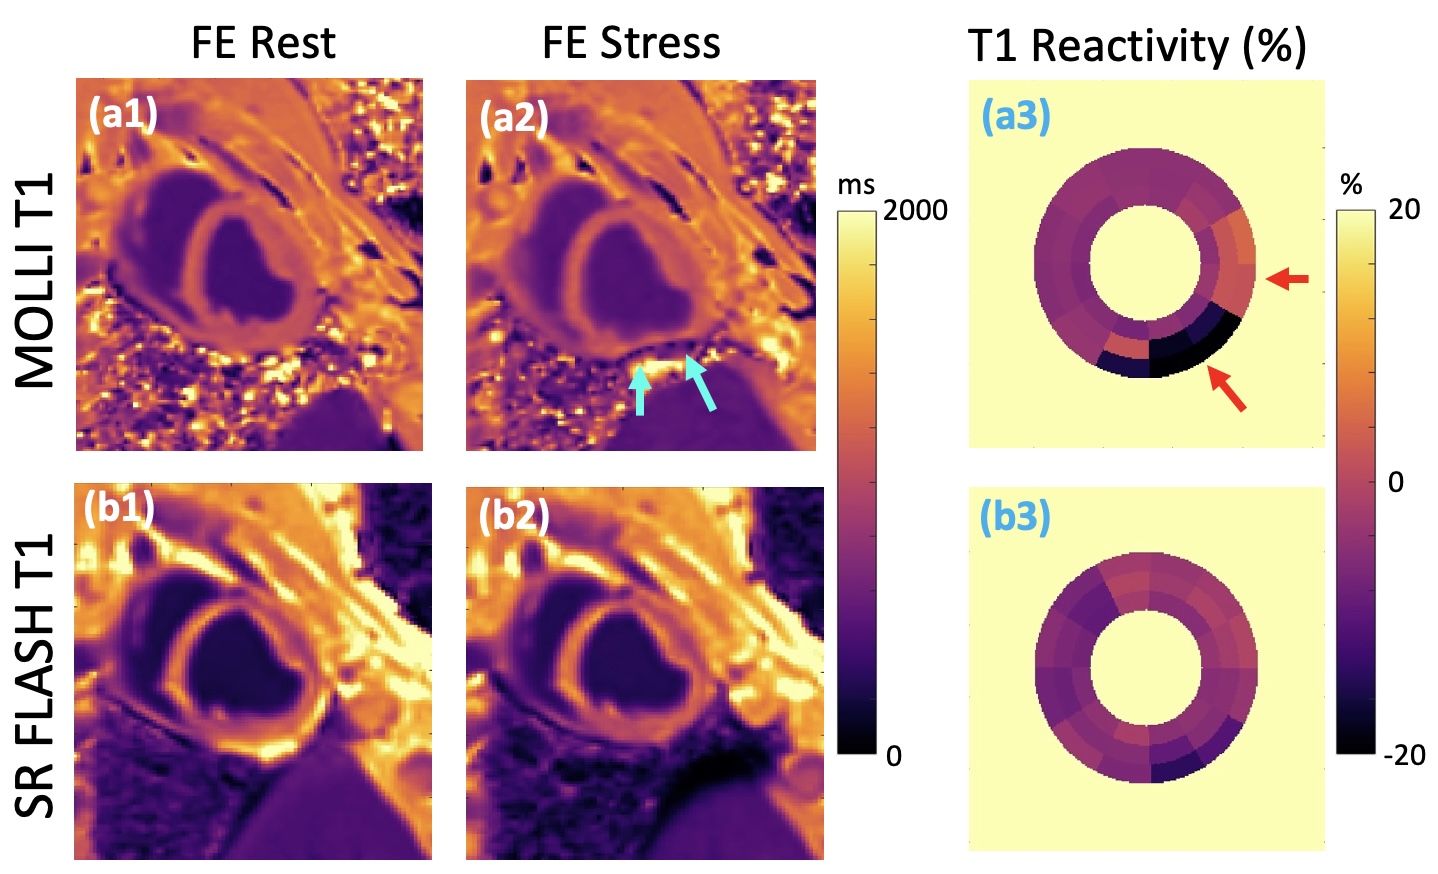
Our phantom studies showed excellent correlation between SR-FLASH and MOLLI T1 maps with R = 0.99 and p < 10-4 (Figure 1). MOLLI T1 values were 10% lower than SR-FLASH T1 values on average as expected because of MOLLI’s known T1 underestimation. Although free-breathing MOLLI at rest performed well, it occasionally failed at stress. SR-FLASH, on the other hand, was much more robust to very high heart rates (Figure 2). Moreover, even breathhold MOLLI scans were sensitive to susceptibility/banding artifacts in lateral wall (Figure 3). Fig 4 shows example MOLLI T1 maps for native rest and FE rest/stress scans in a representative animal. As highlighted with arrows, FE stress T1 values are lower than FE rest indicating increased myocardial blood volume during dobutamine stress. SR-FLASH and MOLLI T1 reactivities showed good correlation in the anteroseptal sector (R = 0.76, p<0.001). For comparison, the agreement between T1 reactivities obtained by 2 different sets of MOLLI scans were R = 0.85, which shows the natural variability in T1 reactivity studies. SR-FLASH and MOLLI T1 reactivities both performed well in terms of the agreement between neighboring subsectors in anterior wall (R = 0.75 and R = 0.83, respectively). However, SR-FLASH outperformed better MOLLI in terms of agreement between neighboring subsectors in the inferior wall (R = 0.76 vs R = 0.40). A representative case is shown in Fig 5, where MOLLI has a severe susceptibility/banding artifact in inferior/lateral wall whereas SR-FLASH is artifact-free in the same region.Discussion/Conclusion
In this study, we showed the feasibility of using a widely available SR-prepared FLASH pulse sequence (typically used for myocardial perfusion imaging) to enable free-breathing FE T1 reactivity studies at high stress/rest heart rates. Our results demonstrated that the proposed SR-FLASH T1 reactivity mapping technique is robust to susceptibility/banding artifacts which can affect MOLLI especially in the as lateral and inferior sectors. Finally, since the image series acquired with SR-FLASH has a consistent tissue/bloodpool contrast, it is well suited for inline motion-correction which in turn enables rapid free-breathing T1 reactivity mapping in ferumoxytol-enhanced with exercise or pharmacological stress.Acknowledgements
No acknowledgement found.References
1. Mahmod M, Piechnik SK, Levelt E, Ferreira VM, Francis JM, Lewis A, et al. Adenosine stress native T1 mapping in severe aortic stenosis: evidence for a role of the intravascular compartment on myocardial T1 values. J Cardiovasc Magn Reson. 2014;16:92.
2. Colbert CM, Le AH, Shao J, Currier JW, Ajijola OA, Hu P, Nguyen KL. Ferumoxytol-enhanced magnetic resonance T1 reactivity for depiction of myocardial hypoperfusion. NMR Biomed 2021;34:e4518.
3. Chow K, Flewitt JA, Green JD, Pagano JJ, Friedrich MG, Thompson RB. Saturation recovery single-shot acquisition (SASHA) for myocardial T(1) mapping. Magn Reson Med. 2014;71:2082-2095. doi: 10.1002/mrm.24878
4. Messroghli DR, Radjenovic A, Kozerke S, Higgins DM, Sivananthan MU, Ridgway JP. Modified Look-Locker inversion recovery (MOLLI) for high-resolution T1 mapping of the heart. Magn Reson Med. 2004;52:141-146. doi: 10.1002/mrm.20110
5. Xanthis CG, Bidhult S, Greiser A, Chow K, Thompson RB, Arheden H, Aletras AH. Simulation-based quantification of native T1 and T2 of the myocardium using a modified MOLLI scheme and the importance of Magnetization Transfer. Magn Reson Imaging. 2018;48:96-106. doi: 10.1016/j.mri.2017.12.020
6. Cernicanu A, Axel L. Theory-based signal calibration with single-point T1 measurements for first-pass quantitative perfusion MRI studies. Acad Radiol. 2006;13:686-693. doi: 10.1016/j.acra.2006.02.040
Figures