0330
Efficient fat suppression in free-running whole-heart CMR using OptiPulse
Xavier Sieber1, Ludovica Romanin1,2, Chris W. Roy1, Jessica AM Bastiaansen3,4, Jérôme Yerly1, Jonas Richiardi1, Matthias Stuber1,5, and Ruud B. van Heeswijk1
1Department of Diagnostic and Interventional Radiology, Lausanne University Hospital (CHUV) and University of Lausanne (UNIL), Lausanne, Switzerland, 2Advanced Clinical Imaging Technology, Siemens Healthineers International AG, Lausanne, Switzerland, 3Department of Diagnostic, Interventional and Pediatric Radiology (DIPR), Inselspital, Bern University Hospital, University of Bern, Bern, Switzerland, 4Translation Imaging Center (TIC), Swiss Institute for Translational and Entrepreneurial Medicine, Bern, Switzerland, 5Division of Cardiology, CIBM Center for Biomedical Imaging, Lausanne, Switzerland
1Department of Diagnostic and Interventional Radiology, Lausanne University Hospital (CHUV) and University of Lausanne (UNIL), Lausanne, Switzerland, 2Advanced Clinical Imaging Technology, Siemens Healthineers International AG, Lausanne, Switzerland, 3Department of Diagnostic, Interventional and Pediatric Radiology (DIPR), Inselspital, Bern University Hospital, University of Bern, Bern, Switzerland, 4Translation Imaging Center (TIC), Swiss Institute for Translational and Entrepreneurial Medicine, Bern, Switzerland, 5Division of Cardiology, CIBM Center for Biomedical Imaging, Lausanne, Switzerland
Synopsis
Keywords: Vessels, RF Pulse Design & Fields
The incomplete or time-inefficient suppression of fat signals is an unsolved issue in 3D cardiovascular MR imaging (CMR). We present a flexible framework named OptiPulse to design spectrally-selective radiofrequency (RF) pulses using numerical optimization of Bloch equation simulations. The RF pulse performance was assessed using a composite loss function for both fat suppression and power requirement. OptiPulse was used to design a B-splines-interpolated pulse for use in a free-running 3D whole-heart pulse sequence. Its fat suppression performance was ascertained both in vitro and in vivo, where it resulted in more homogeneous fat suppression when compared to other WE pulses (P<0.01).Background
In radial 3D imaging of the heart at 1.5T, fat suppression methods are necessary for the correct delineation of the anatomy, but they are often technically challenging while they also need to be time-efficient to limit the scan duration.Recently, short water-excitation (WE) radiofrequency (RF) pulses have been reported as an efficient solution for fat suppression in high-resolution imaging of the heart1-3. These WE RF pulses were designed using analytical methods and may require manual tuning of the parameters. For this reason, their optimization is constrained to low-dimensional (<5) parameter space, which may limit the search to a small domain of solutions while a more global optimum may be overlooked.
We therefore propose a flexible and efficient framework of optimizing B-splines-interpolated4 WE RF pulses, named OptiPulse. The goal of this study was thus to design an RF pulse with OptiPulse, to compare its fat suppression to a standard non-suppressive pulse, a 1-1 binomial WE pulse and the LIBRE 1-1 WE pulse3 in a phantom, and to validate it in vivo in the heart.
Methods
The optimization of B-splines-interpolated4 RF pulses was performed with 30 parameters (15 phase, 15 amplitude). The frequency response in the transverse plane was computed using Bloch equations simulation of 400 isochromats ranging from -1kHz to 1kHz (Fig.1). Next, the performance of the pulse was evaluated with a tailored loss function L:$$ L(P) = \frac{[||M_{xy} ||_2]_f}{[||M_{xy}||_2]_w} + \frac{\lambda_{1}}{[||M_{xy}||_2]_w} + \lambda_{2}[(||M_{xy}||_2)^{2}]_f, $$
Where $$$\lambda_{1}=0.01$$$ and $$$\lambda_{2}=400$$$ are the regularization coefficients, $$$||M_{xy}||_2$$$ is the L2 norm of the transverse magnetization and $$$[…]_w$$$ and $$$[…]_f$$$ are the averages over the water and fat bands. Finally, the loss function was minimized with the Covariance Matrix Adaptation Evolution Strategy CMA-ES5, a black-box optimizer.
A WE RF pulse with a duration of 2.56ms was optimized and implemented on a 1.5T clinical scanner (MAGNETOM Sola, Siemens Healthcare) as part of a free-running 3D radial bSSFP research sequence6 (α=70°, TR=5.4ms). The fat suppression of the optimized RF pulse was compared to that of a 0.3ms non-fat-suppressing pulse, to that of a 2.6ms 1-1 WE and to that of a 2.6ms LIBRE 1-1 pulse in an agar-oil phantom by measuring the contrast-to-noise ratio (CNR) between the blood and fat phantom compartment.
Finally, free-running 4D bSSFP images with 3D translational correction of respiratory motion using fNAV7 were reconstructed in the heart of 8 healthy volunteers with the 1-1 WE pulse, the LIBRE pulse, and the optimized RF pulse (voxel size (1.1mm)3, duration 11min). The contrast ratios (CR=Sfat/Sblood) between both chest fat/epicardial fat and the left-ventricular blood pool were calculated since the noise can no longer be reliably measured, while the traceable length of the right coronary artery (RCA) and the left anterior descending artery (LAD) was measured8 for the three water-selective acquisitions. All metrics were tested against those obtained with the optimized pulse using a paired Student’s t-tests including a Bonferroni correction for multiple comparisons.
Results
The numerical simulations of the RF pulses showed a slightly broader suppression band for the optimized pulse than for the other pulses (Fig.2E). In the phantom, blood-fat CNRs were -161 (i.e. fat brighter than blood), 72, 81 and 84 for the non-suppressing, the 1-1 WE, the LIBRE and the optimized pulse, respectively (Fig.2F-I).In vivo, the blood-pool/chest-fat CR amounted to 4.2±1.4 for the optimized pulse, 2.0±0.6 for the 1-1 WE pulse (P=0.005) and 2.8±0.9 for the LIBRE pulse (P=0.04) (Fig.3). The blood-pool/epicardial-fat CR of the optimized pulse at CR=3.8±1.3 was higher than that of the 1-1 WE pulse at CR=2.0±1.1 (P=0.004) and similar to CR=2.4±1.1 (P=0.016)obtained with the LIBRE pulse.
The RCA could be traced for a length of 5.8±1.0cm with the optimized pulse, 4.9±0.8cm (P=0.28) with the 1-1 WE pulse and 5.0±0.6cm (P=0.28) with the LIBRE pulse. Finally, the LAD could be traced for 8.7±1.3cm, 7.0±0.9cm (P=0.03) and 7.5±1.2cm (P=0.09) for the optimized pulse, the 1-1 WE and the LIBRE RF pulses respectively. In multiple volunteers, the more homogeneous fat suppression of the epicardial fat signal achieved with the optimized pulse led to better visualization of the proximal and distal parts of the LAD (Fig.4).
Discussion
The RF pulse generated with the OptiPulse framework demonstrated higher levels of fat suppression than the 1-1 WE and the LIBRE pulse in both the phantom and in vivo studies.This was consistent with the measurement of the vessel length, which was hampered by residual strong fat signal in the 1-1 WE images. These results suggest that using a broader suppression band is beneficial for whole-heart imaging where magnetic field inhomogeneities are high.
While OptiPulse requires further validation in a large patient cohort, these preliminary results suggest both chest and epicardial fat can be simultaneously well suppressed in 3D radial whole heart imaging with OptiPulse, potentially leading to improved visualization of the coronary arteries.
Conclusion
In conclusion, we developed an optimization framework called OptiPulse to generate a B-spline-interpolated water-selective RF pulse. The optimized pulse resulted in more homogeneous lipid suppression in phantoms and human hearts at 1.5T when compared to other water-excitation pulses.Acknowledgements
No acknowledgement found.References
- Ye Y, Hu J, Haacke EM. Robust selective signal suppression using binomial off-resonant rectangular (BORR) pulses: Binomial Off-Resonance RF for Water-Fat Separation. J. Magn. Reson. Imaging 2014;39:195–202 doi: 10.1002/jmri.24149.
- Bastiaansen JAM, Stuber M. Flexible water excitation for fat-free MRI at 3T using lipid insensitive binomial off-resonant RF excitation (LIBRE) pulses: Libre for Fat-Free MRI. Magn. Reson. Med. 2018;79:3007–3017 doi: 10.1002/mrm.26965.
- Masala, N, Bastiaansen, JAM, Di Sopra, L, et al. Free-running 5D coronary MR angiography at 1.5T using LIBRE water excitation pulses. Magn Reson Med. 2020;84:1470-1485 doi: 10.1002/mrm.28221
- de Boor C. Bicubic Spline Interpolation. J. Math. Phys. 1962;41:212–218 doi: 10.1002/sapm1962411212.
- Hansen N, Müller SD, Koumoutsakos P. Reducing the Time Complexity of the Derandomized Evolution Strategy with Covariance Matrix Adaptation (CMA-ES). Evol. Comput. 2003;11:1–18 doi: 10.1162/106365603321828970.
- Di Sopra L, Piccini D, Coppo S, Stuber M, Yerly J. An automated approach to fully self-gated free-running cardiac and respiratory motion-resolved 5D whole-heart MRI. Magn Reson Med. 2019 Dec;82(6):2118-2132. doi: 10.1002/mrm.27898.
- Roy CW, Heerfordt J, Piccini D, et al. Motion compensated whole-heart coronary cardiovascular magnetic resonance angiography using focused navigation (fNAV). J Cardiovasc Magn Reson. 2021;23(1):33 doi: 10.1186/s12968-021-00717-4. 7.
- Etienne A, Botnar RM, Van Muiswinkel AM, Boesiger P, Manning WJ, Stuber M. “Soap-Bubble” visualization and quantitative analysis of 3D coronary magnetic resonance angiograms. Magn Reson Med 2002;48:658–66 doi: 10.1002/mrm.10253.
Figures
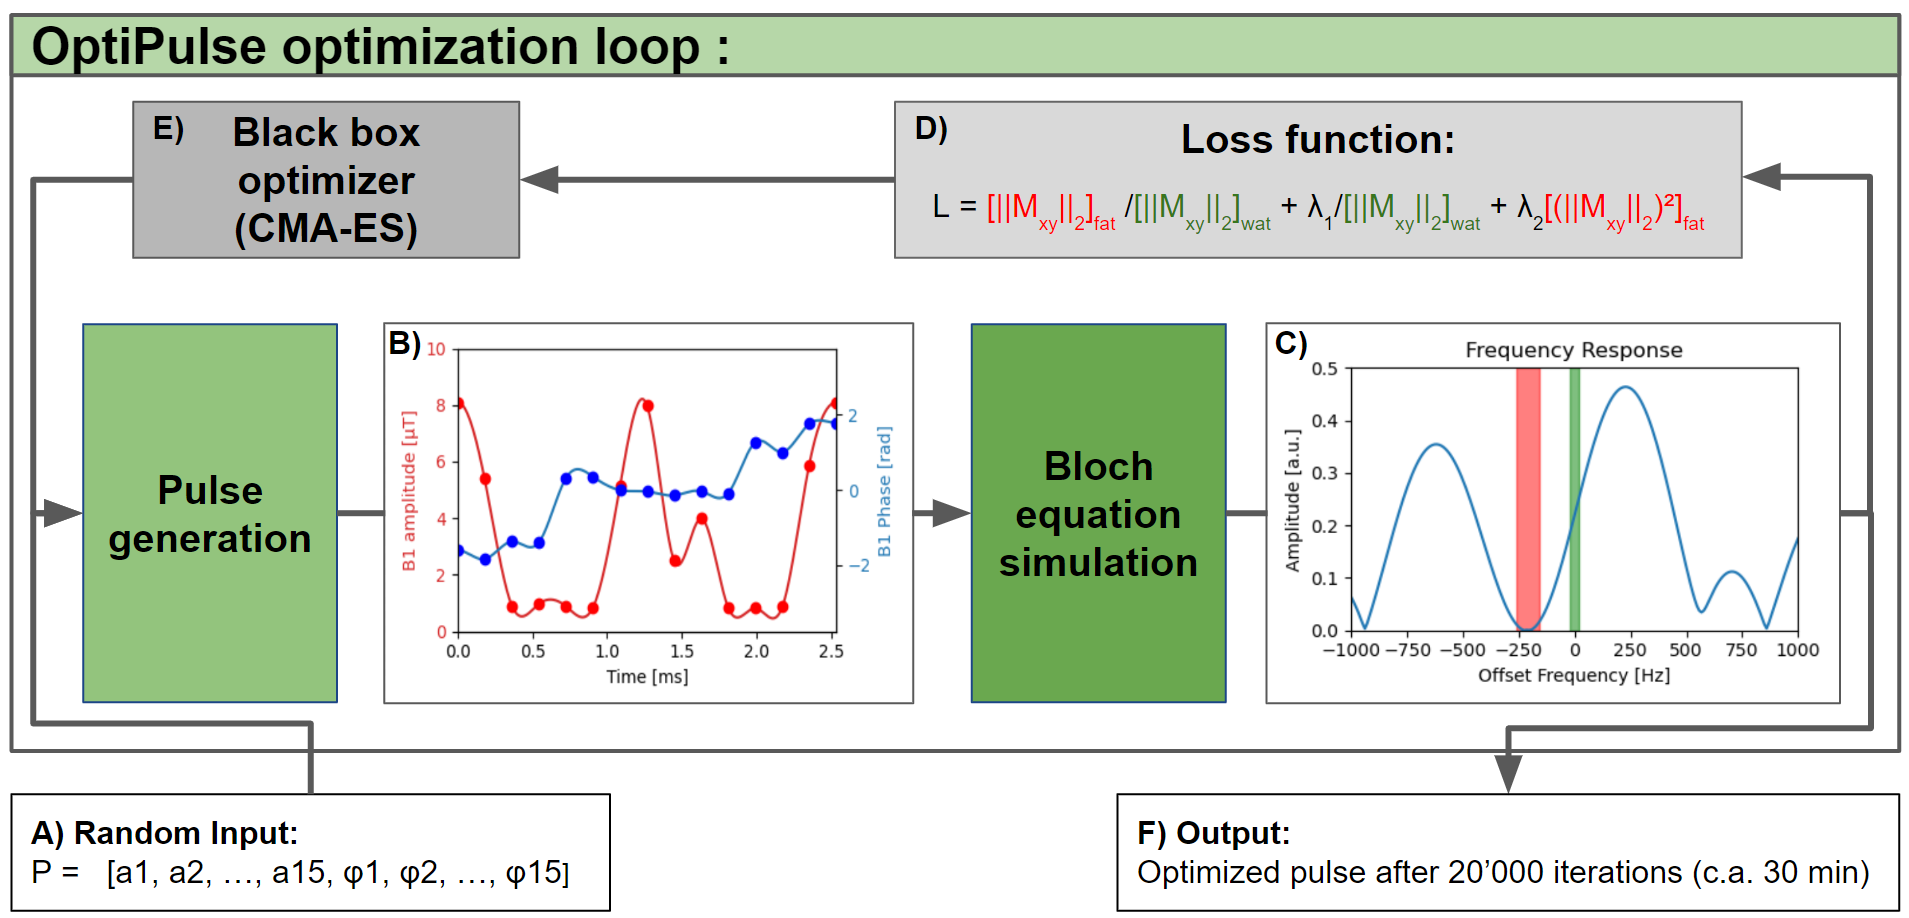
Figure 1. Optimization
loop diagram. A) The parameters P are initialized randomly before being used to
generate the amplitude and phase time series (a, φ) of the pulse (B). C) Next,
the frequency response is computed using
Bloch equation simulation and is evaluated by the loss function L (D). Note
that the red and green terms of the equation affect the fat and water bands
seen in the spectrum, respectively. E) New parameters, suggested by CMA-ES, are used to perform the next optimization iteration. F) The algorithm outputs
the best-performing pulse simulated during the 20’000 iterations.
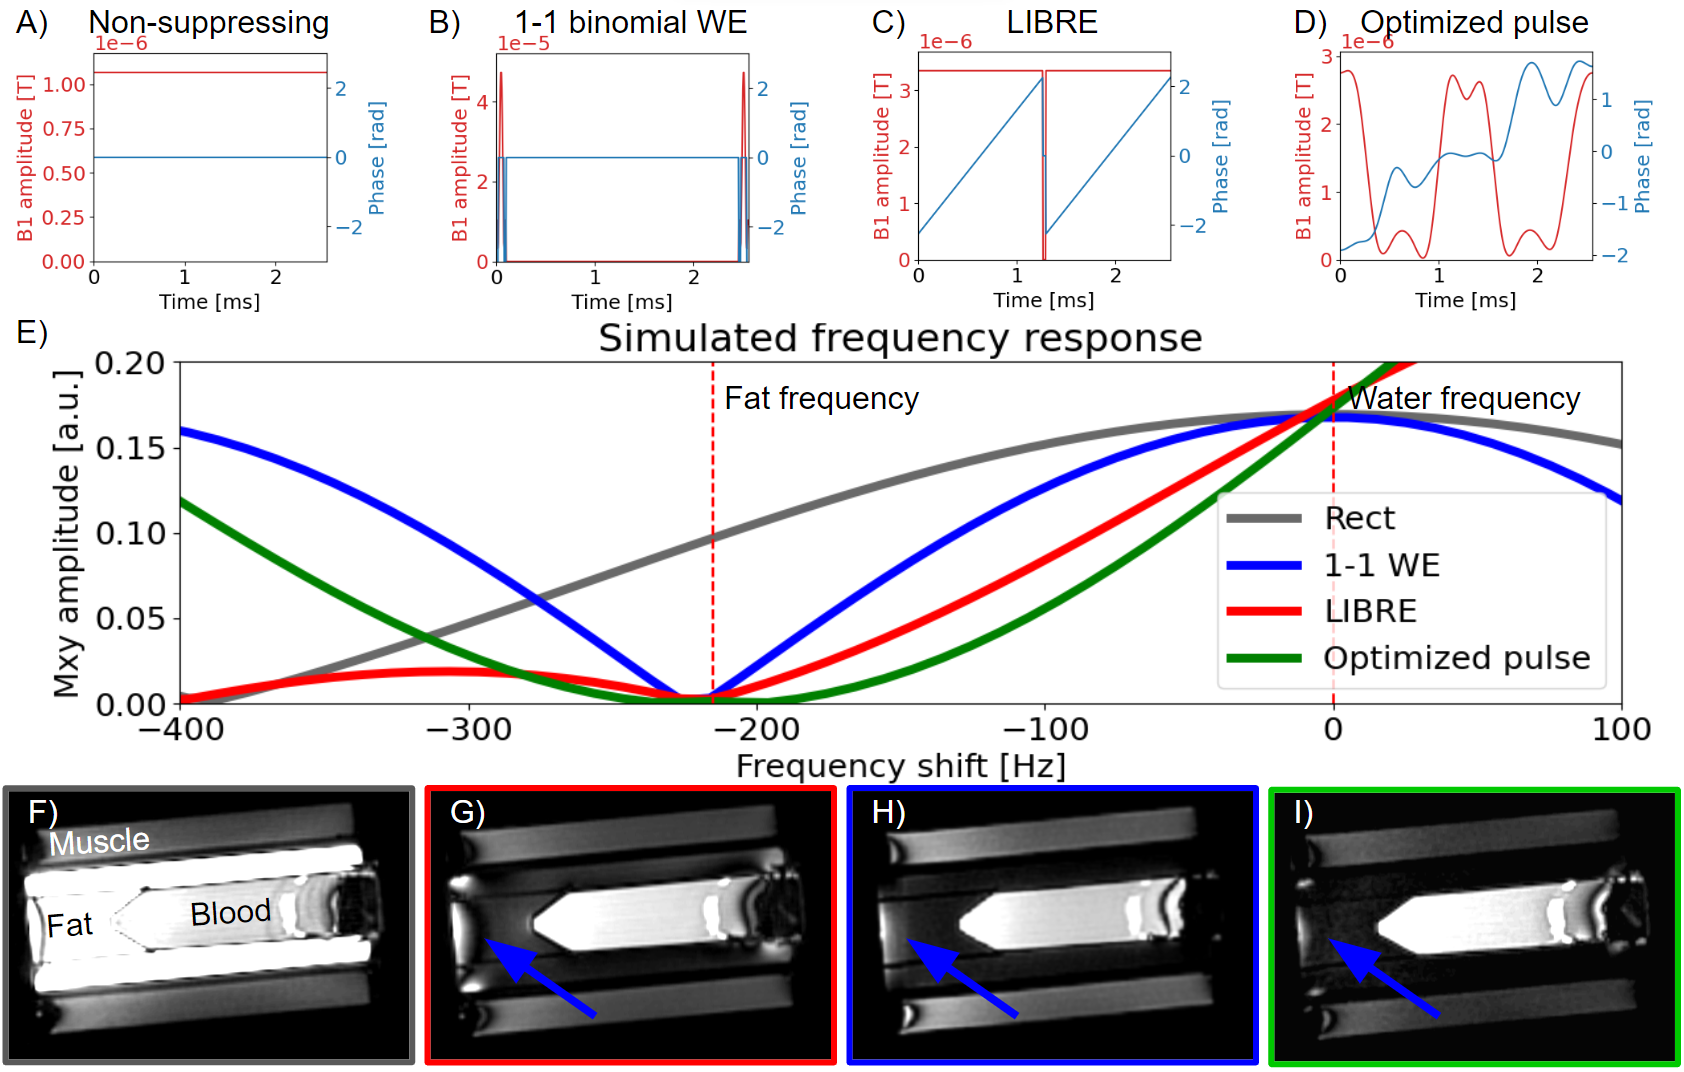
Figure 2. Simulation
and phantom results. A-D) The amplitude (red) and phase (blue) of the compared
RF pulses. E) The simulated frequency response of each RF pulse. The optimized
pulse has the broadest suppression band around the fat frequency at -215 Hz.
F-I) In the phantom images, the optimized pulse (outlined in green) results in a
more complete fat suppression than the 1-1 WE (in red) by having less signal towards
the edges of the phantom (blue arrow) in the “fat” compartment.
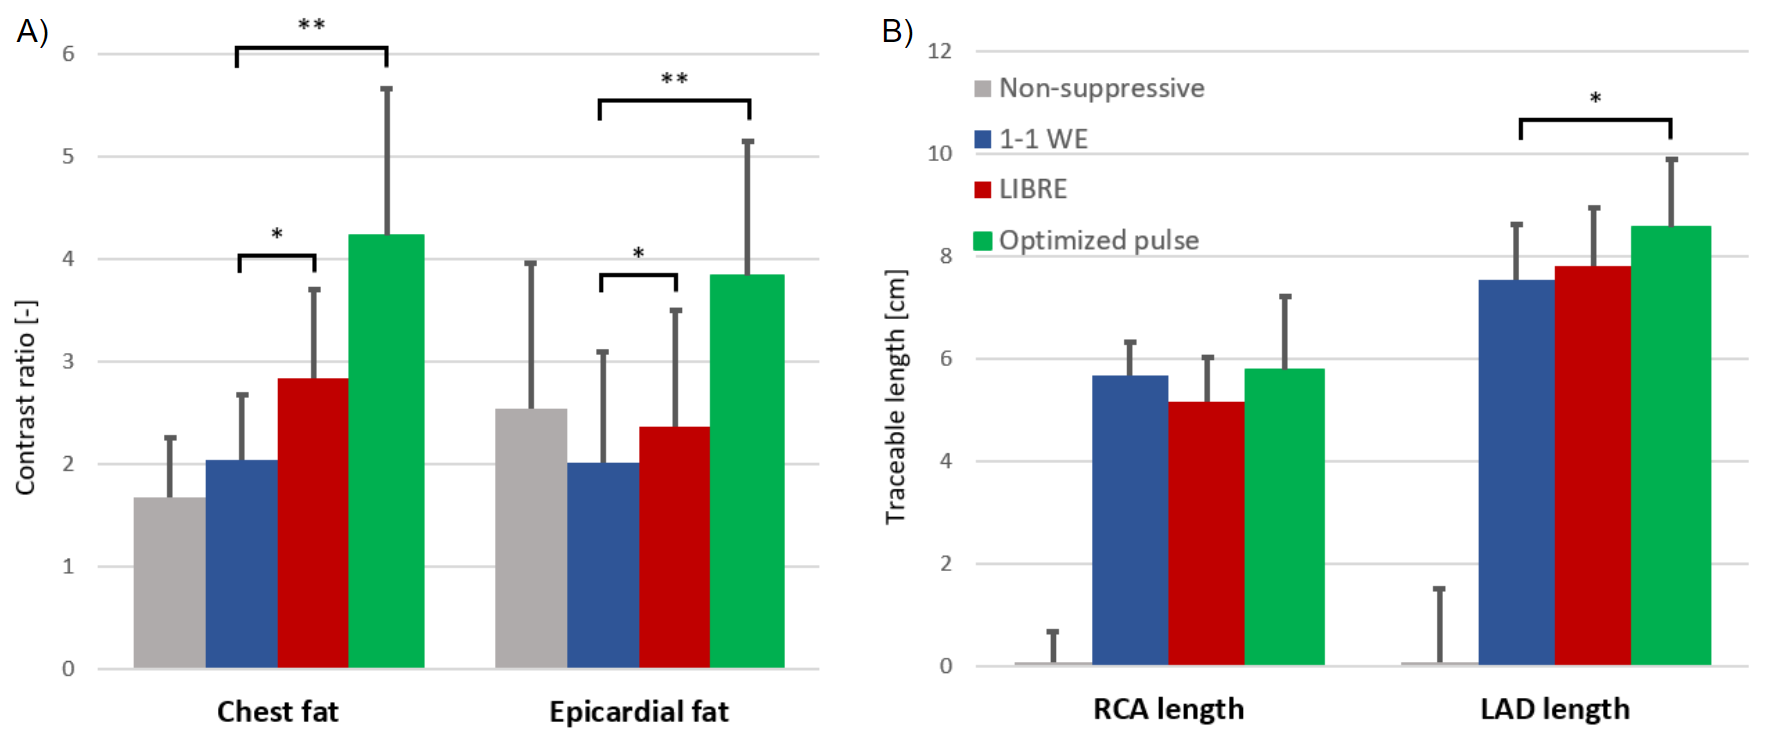
Figure 3. In vivo contrast ratios between blood and
fat and traceable vessel length. A) The optimized B-spline pulse resulted in significantly
higher values than all the other methods in the contrast ratio of both chest
fat and epicardial fat. B) The traceable length of the RCA was not
significantly longer for the optimized pulse, while it was significantly longer
for the LAD when compared to the 1-1 WE.
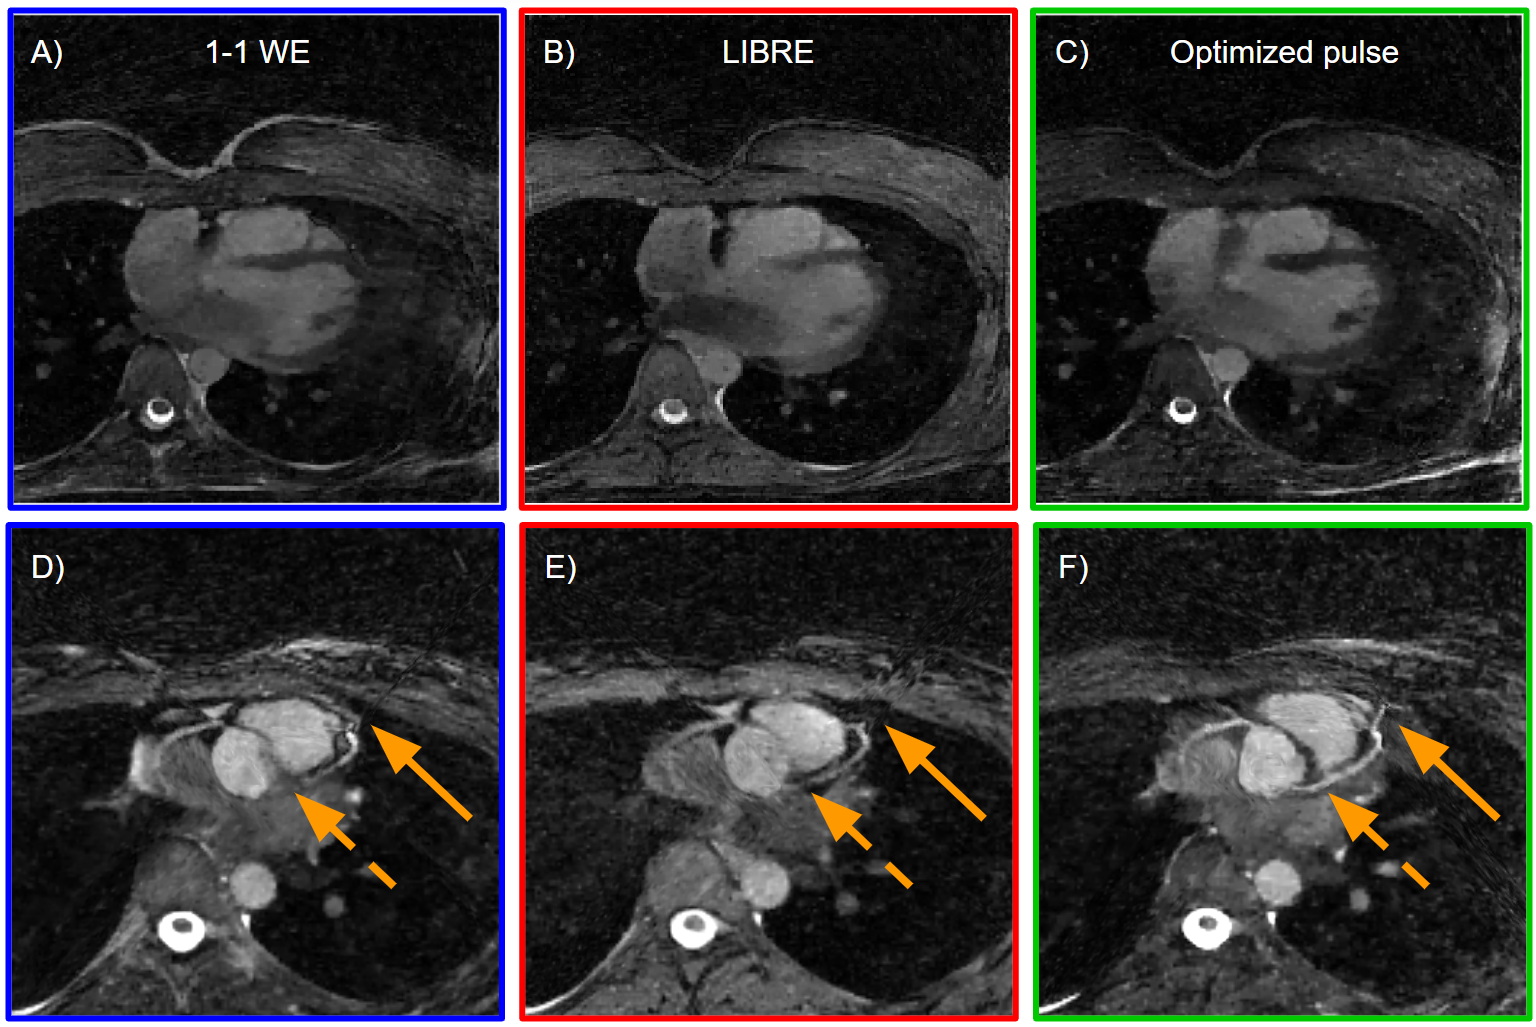
Figure 4. Free-running
whole-heart bSSFP in healthy volunteers at 1.5T. A-C) Transversal - slices of
the heart at mid-diastole and
end-expiration show suppression of both chest and epicardial fat. D-F) Multiplanar coronary reformats where the fat
suppression enables the visualization of the LAD and RCA. The solid arrows
highlight the distal part of the LAD which could be traced further with the
B-Splines optimized pulse. The dashed arrows show how the proximal part of the
LAD stands out when fat is well suppressed.
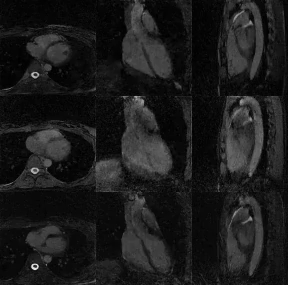
Figure 5. Free-running bSSFP cardiac cycle
reconstructions using, from top to bottom, the 1-1 WE, LIBRE and the
optimized pulse. Note the more complete suppression of chest and epicardial
fat achieved with the optimized pulse (last row).
DOI: https://doi.org/10.58530/2023/0330