0324
Prostate cancer characterization with a data-driven analysis of multi-center 3D 1H-MRSI data using Multivariate Curve Resolution1Department of Medical Imaging, Radboud University Medical Center, Nijmegen, Netherlands, 2Department of Analytical Chemistry & Chemometrics, Radboud University, Nijmegen, Netherlands, 3Department of Circulation and Medical Imaging, Norwegian University of Technology and Science, Trondheim, Norway
Synopsis
Keywords: Prostate, Spectroscopy, multi-center, cancer, aggressiveness
Location and aggressiveness of cancer lesions in the prostate were assessed with a Multivariate Curve Resolution (MCR) approach. This data-driven method was trained on 3D 1H MRSI data from 63 patients from 6 institutions to extract common spectroscopic components without needing prior knowledge. MCR identified 5 components related to known prostate metabolites, residual lipid and water signals. The relative amounts of these components robustly separated cancer from benign tissue in a test set of 43 other subjects from 8 centers, and showed a strong correlation with cancer aggressiveness. This approach facilitates automatic analysis of prostate MRSI, avoiding subjective human intervention.
Introduction
Automated and reliable spectroscopic evaluation is essential for the clinical use of 3D 1H-MRSI of the prostate1. The Multivariate Curve Resolution (MCR) method provides an easily interpretable model to reconstruct the relative intensities of spectral profiles of individual chemical components within a sample2. Previously, we demonstrated the feasibility of applying the data-driven MCR method to prostate MRSI data for rapid automated localization and classification of cancer and healthy tissue in a small cohort of patients3. In this work, we apply the MCR method to multi-center 3D 1H MRSI data of over 100 patients with prostate cancer and assess its potential to classify MR spectra according to prostate cancer aggressiveness.Methods
In this study we included multi-center prostate cancer 3D PRESS localized 1H MRSI data (TE 145 ms, TR 750 ms) from 8 centers4,5 participating in the PCaMAP trail acquired on 3T MR systems (MAGNETOM Trio and Skyra, Siemens Healthcare, Erlangen, Germany) with a body coil for transmission and external spine and body array coils for signal reception. This cohort was supplemented with 14 patients with higher-grade tumors of patients suspicious of harboring nodal metastases5. MR spectra were quality controlled. Data from 63 patients (6 centers), were used as a training set and data from 43 subjects (8 centers) as a test set. Tumors from all grade groups were included in both the training and test set. In previous work, expert radiologists (blinded for spectra) identified and assigned voxel positions as definitely cancerous or benign in all patients, on the basis of histopathology slides of resected prostates visually matched with T2-weighted images using anatomical landmarks6. This combination of voxel location and histopathological assignment was used as the gold standard.Magnitude spectra (n=49776) in the spectral range of interest(2-4ppm) of the patients from the train set were used to perform MCR, which models the data X as a linear mixture of components: X=CS, where C and S are matrices of the pure components’ relative abundances and their respective spectral profiles. These profiles are obtained by imposing mathematical constraints based on physicochemical principles (i.e. non-negativity). The number of components selected for the model was estimated with Singular Value Decomposition(SVD) and initialized by entropy minimization7. The initial profiles were iteratively optimized using the MCR-Alternating Least Squares(MCR-ALS) method2, imposing a non-negativity constraint.
The relative intensities of each component for each voxel were normalized across all voxels from the patients in the test set, and mapped slice-by-slice for qualitative validation of the model, using the histopathology reports as gold standard. The model’s components were assigned to patterns of in-vivo spectroscopic shapes for prostate tissue types1. The component with the highest intensity in the Choline ppm region (Figure 1a -S5) was employed as the most suspicious for the presence of tumor tissue.
A t-test statistical comparison was performed according to the relative intensity of the MCR-identified tumorous component (S5) between benign and tumor voxels, to investigate any significant difference between the two groups.
Finally, an ANOVA statistical analysis was performed within the tumor-assigned voxels, separating them into three groups according to the Gleason Grade Group of the tumors8 (Low/Very Low risk-GG 1, Intermediate risk-GG 2 and 3, High/Very High risk-GG 4 and 5), as derived from the histopathology reports. The aim was to investigate any correlation of the relative intensity of the tumorous component with the Grade Group.
Results and Discussion
The optimal number of components, as assessed by SVD, was 5 for the training set (Fig.1a). We assigned the spectroscopic profiles of S1 and S2, with relatively high intensity in the Cit ppm range, to spectra for benign tissue (Fig.1b). The spectroscopic profile of S5 (Fig. 1a), with elevated intensity in the Cho ppm range, was deemed representative for tumor spectra (Fig.1c).Examples of relative intensity maps of the components are presented for a slice in a patient with a Grade Group 1 tumor (Fig.2) and for a patient with a Grade Group 5 tumor (Fig.3). Qualitatively in the patients included in the test set the regions of increased levels of S5 seemed to correlate with histopathologically tumorous tissue regions. A quantitative assessment of the relative intensity of tumorous component S5 significantly (p<0.05) discriminates between the gold standard voxels with benign and tumorous tissue (Fig 4).Then, separating the tumor-assigned voxels in three risk groups according to their Grade Group an ANOVA statistical analysis was performed, and a significant difference was found between the three risk groups (Fig.5) showing a correlation between the relative intensity of the S5 component with tumor aggressiveness.
The strength of the MCR approach is reflected in its ability to discern similar components in data from patients from many different centers. These data have been acquired with the same MRSI acquisition protocol, but can still differ in spectral quality, which could be a reason why the identified components have relatively broad spectral shapes. In the multi-center data voxel assignment, great care was taken in identifying the voxel locations on the basis of anatomical landmarks in T2-weighted imaging as well as on the whole-mount histopathological slides from the corresponding patients, avoiding bias towards spectral shapes.
Conclusion
MCR-ALS can be used for the extraction of common spectroscopic components without a need of prior knowledge. The components, extracted from multi-center data, can be used to classify prostate spectra as benign and tumorous. We also demonstrate that the method can assess tumor aggressiveness. Altogether, our approach can be considered as a step towards the development of an automated tool for classification of prostate MRSI spectra as tumorous and benign, as well as to assess tumor aggressiveness.Acknowledgements
This work is supported by the Marie-Sklodowska-Curie Grant #813120 (Inspire-Med), We thank the PCaMAP consortium for part of the MRSI data (additional reference in list below).
References
1. Stamatelatou A, Scheenen TWJ, Heerschap A. Developments in proton MR spectroscopic imaging of prostate cancer. Magn Reson Mater Physics, Biol Med. Published online 2022. doi:https://doi.org/10.1007/s10334-022-01011-9Figures
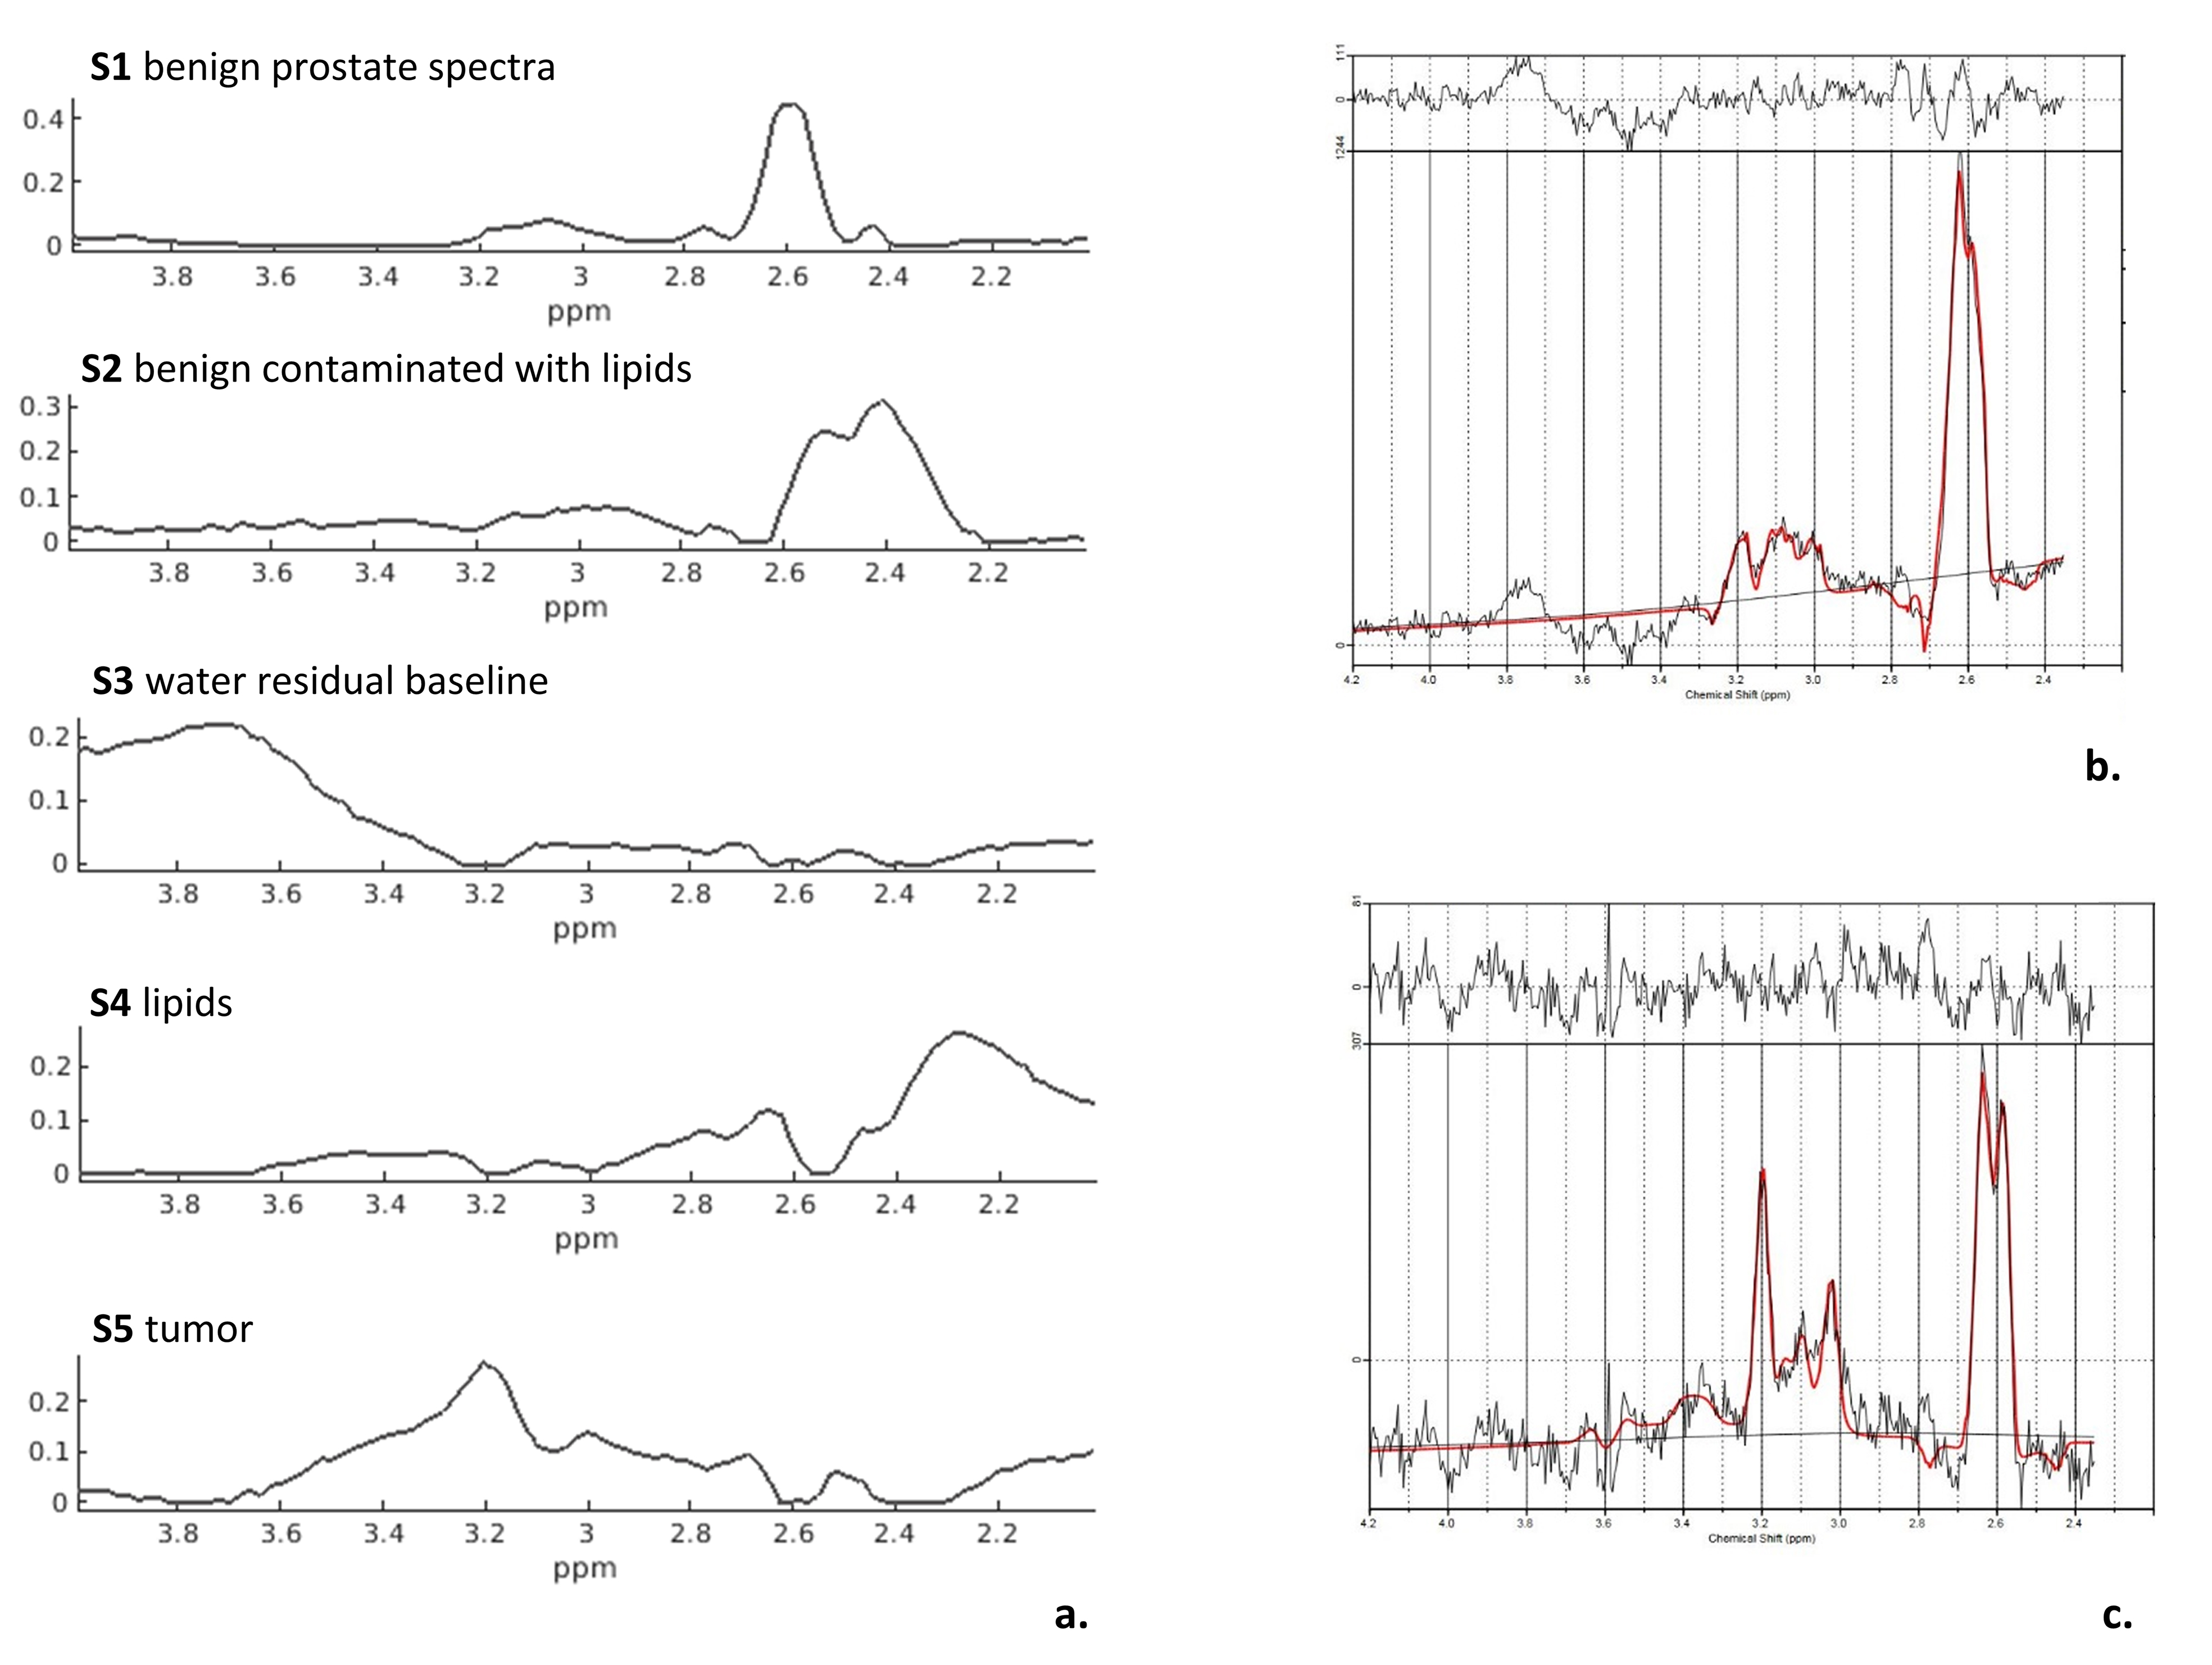
Figure1. a. Spectroscopic profiles of the components extracted with MCR-ALS from 63 prostate cancer patients. b. LCModel output of a healthy spectrum with high citrate levels that are also present in components S1 and S2. c. LCModel output of a spectrum of cancerous tissue, with an elevated choline signal at 3.2 ppm that can be observed in component S5.
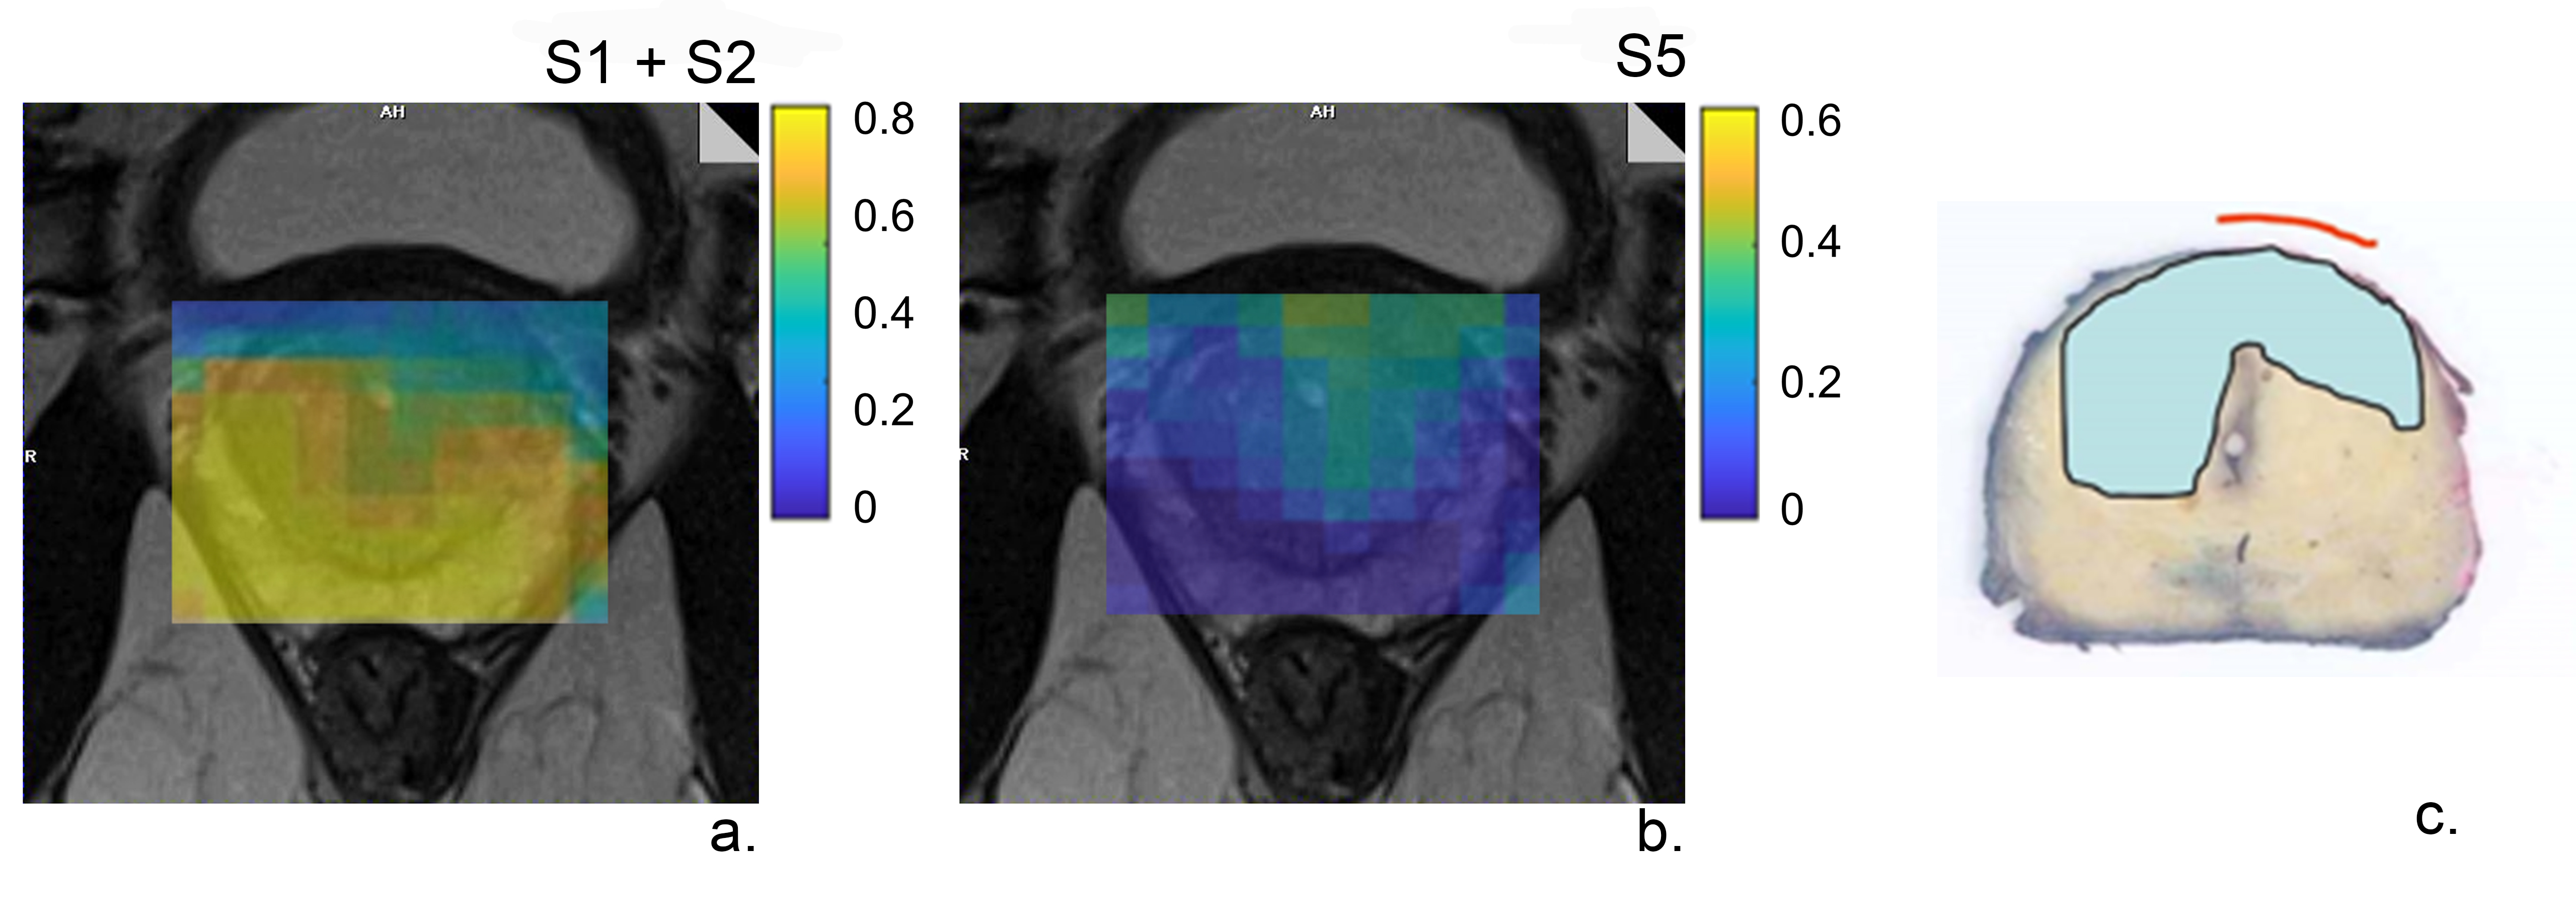
Figure 2. The relative intensity maps of a slice including a non-aggressive tumor a. benign components S1+S2 and b. the tumorous component S5 c. Histopathology of the closest matching slice. A tumor lesion is present with Grade Group 1.
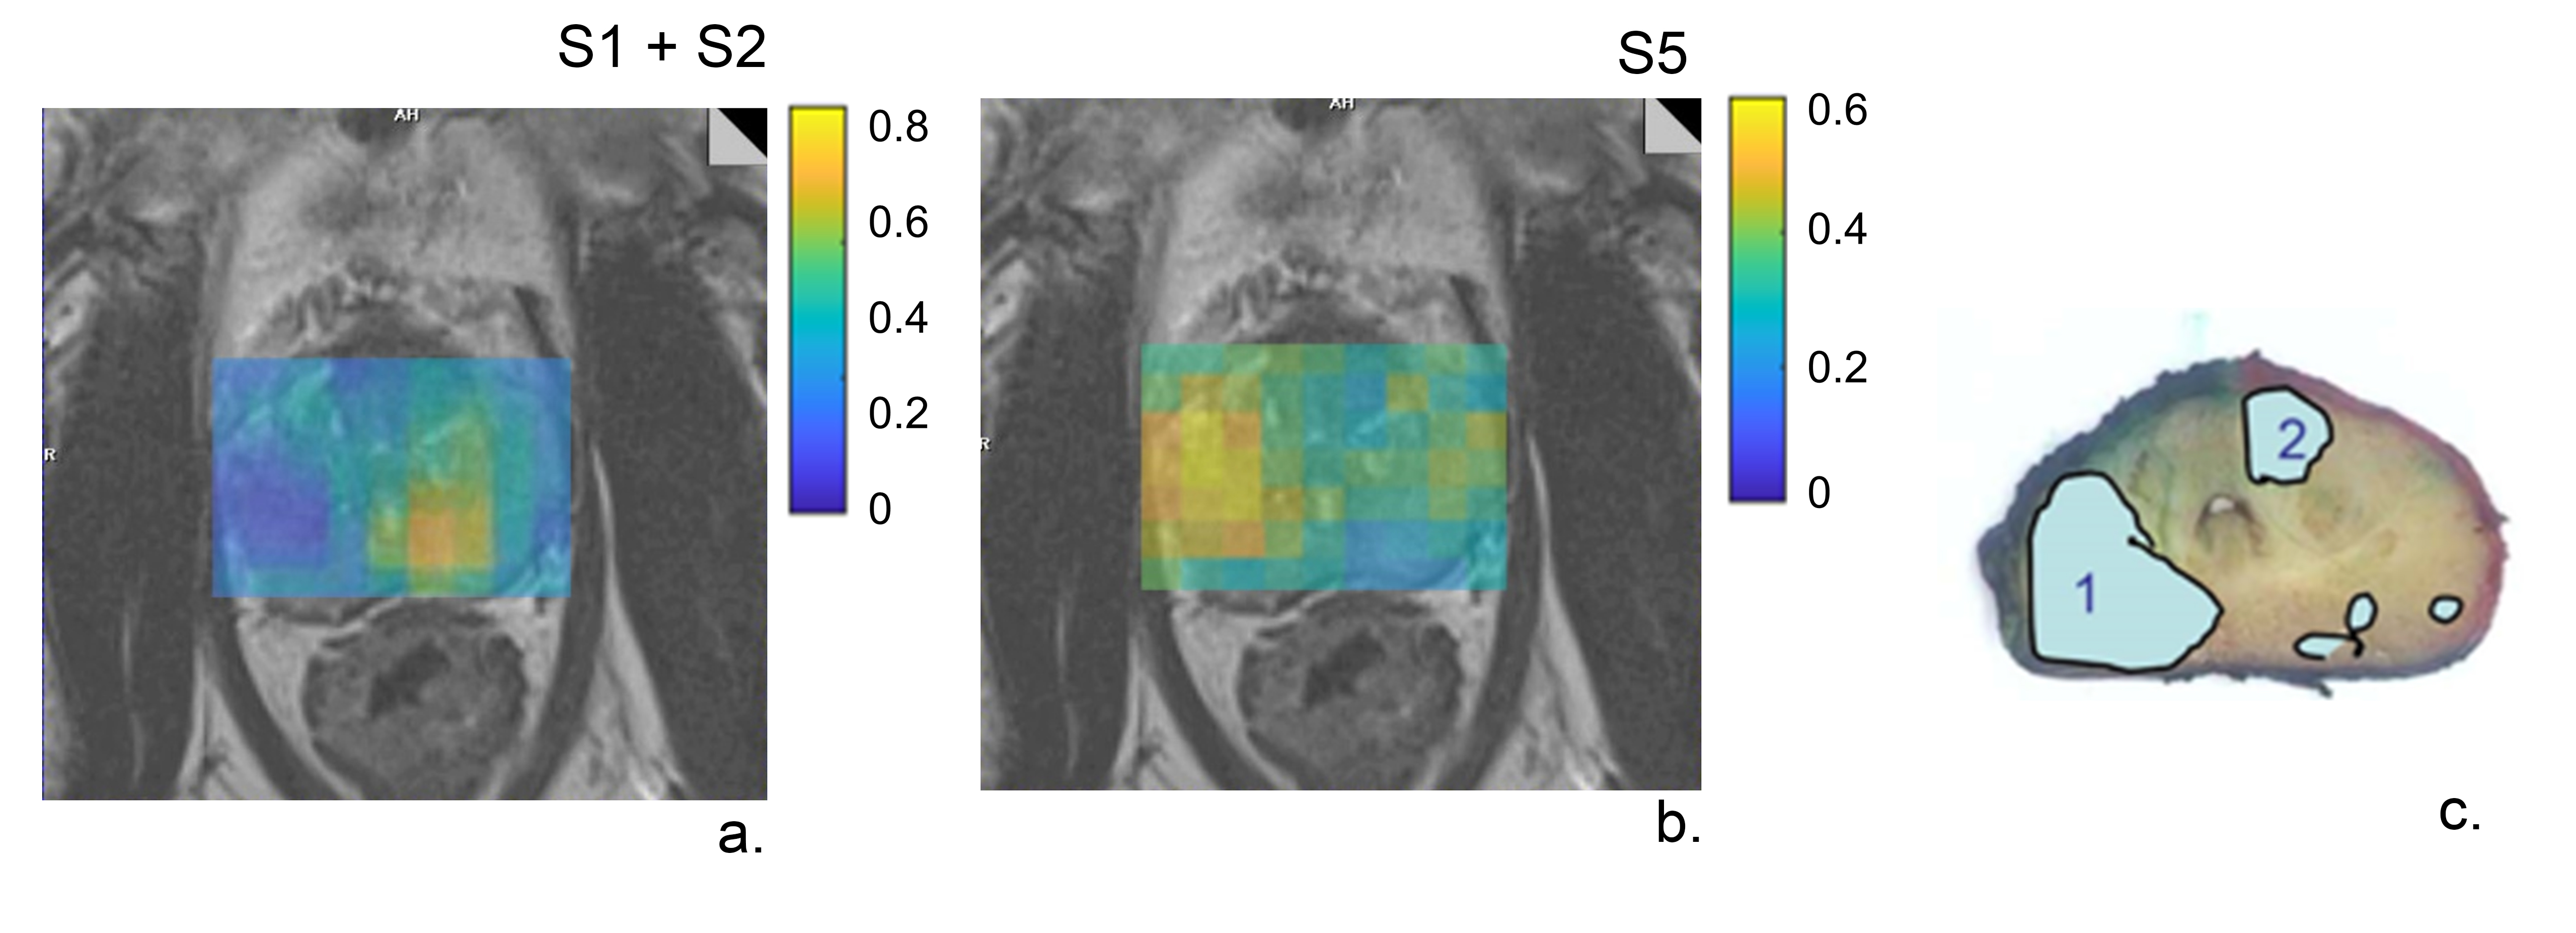
Figure 3. Relative intensity maps of a slice including an aggressive tumor a. benign components S1+S2 and b. the tumorous component S5 c. Histopathology of the closest matching slice. Lesion 1 is a Grade Group 5 tumor and lesion 2 is a Grade Group 1 tumor.
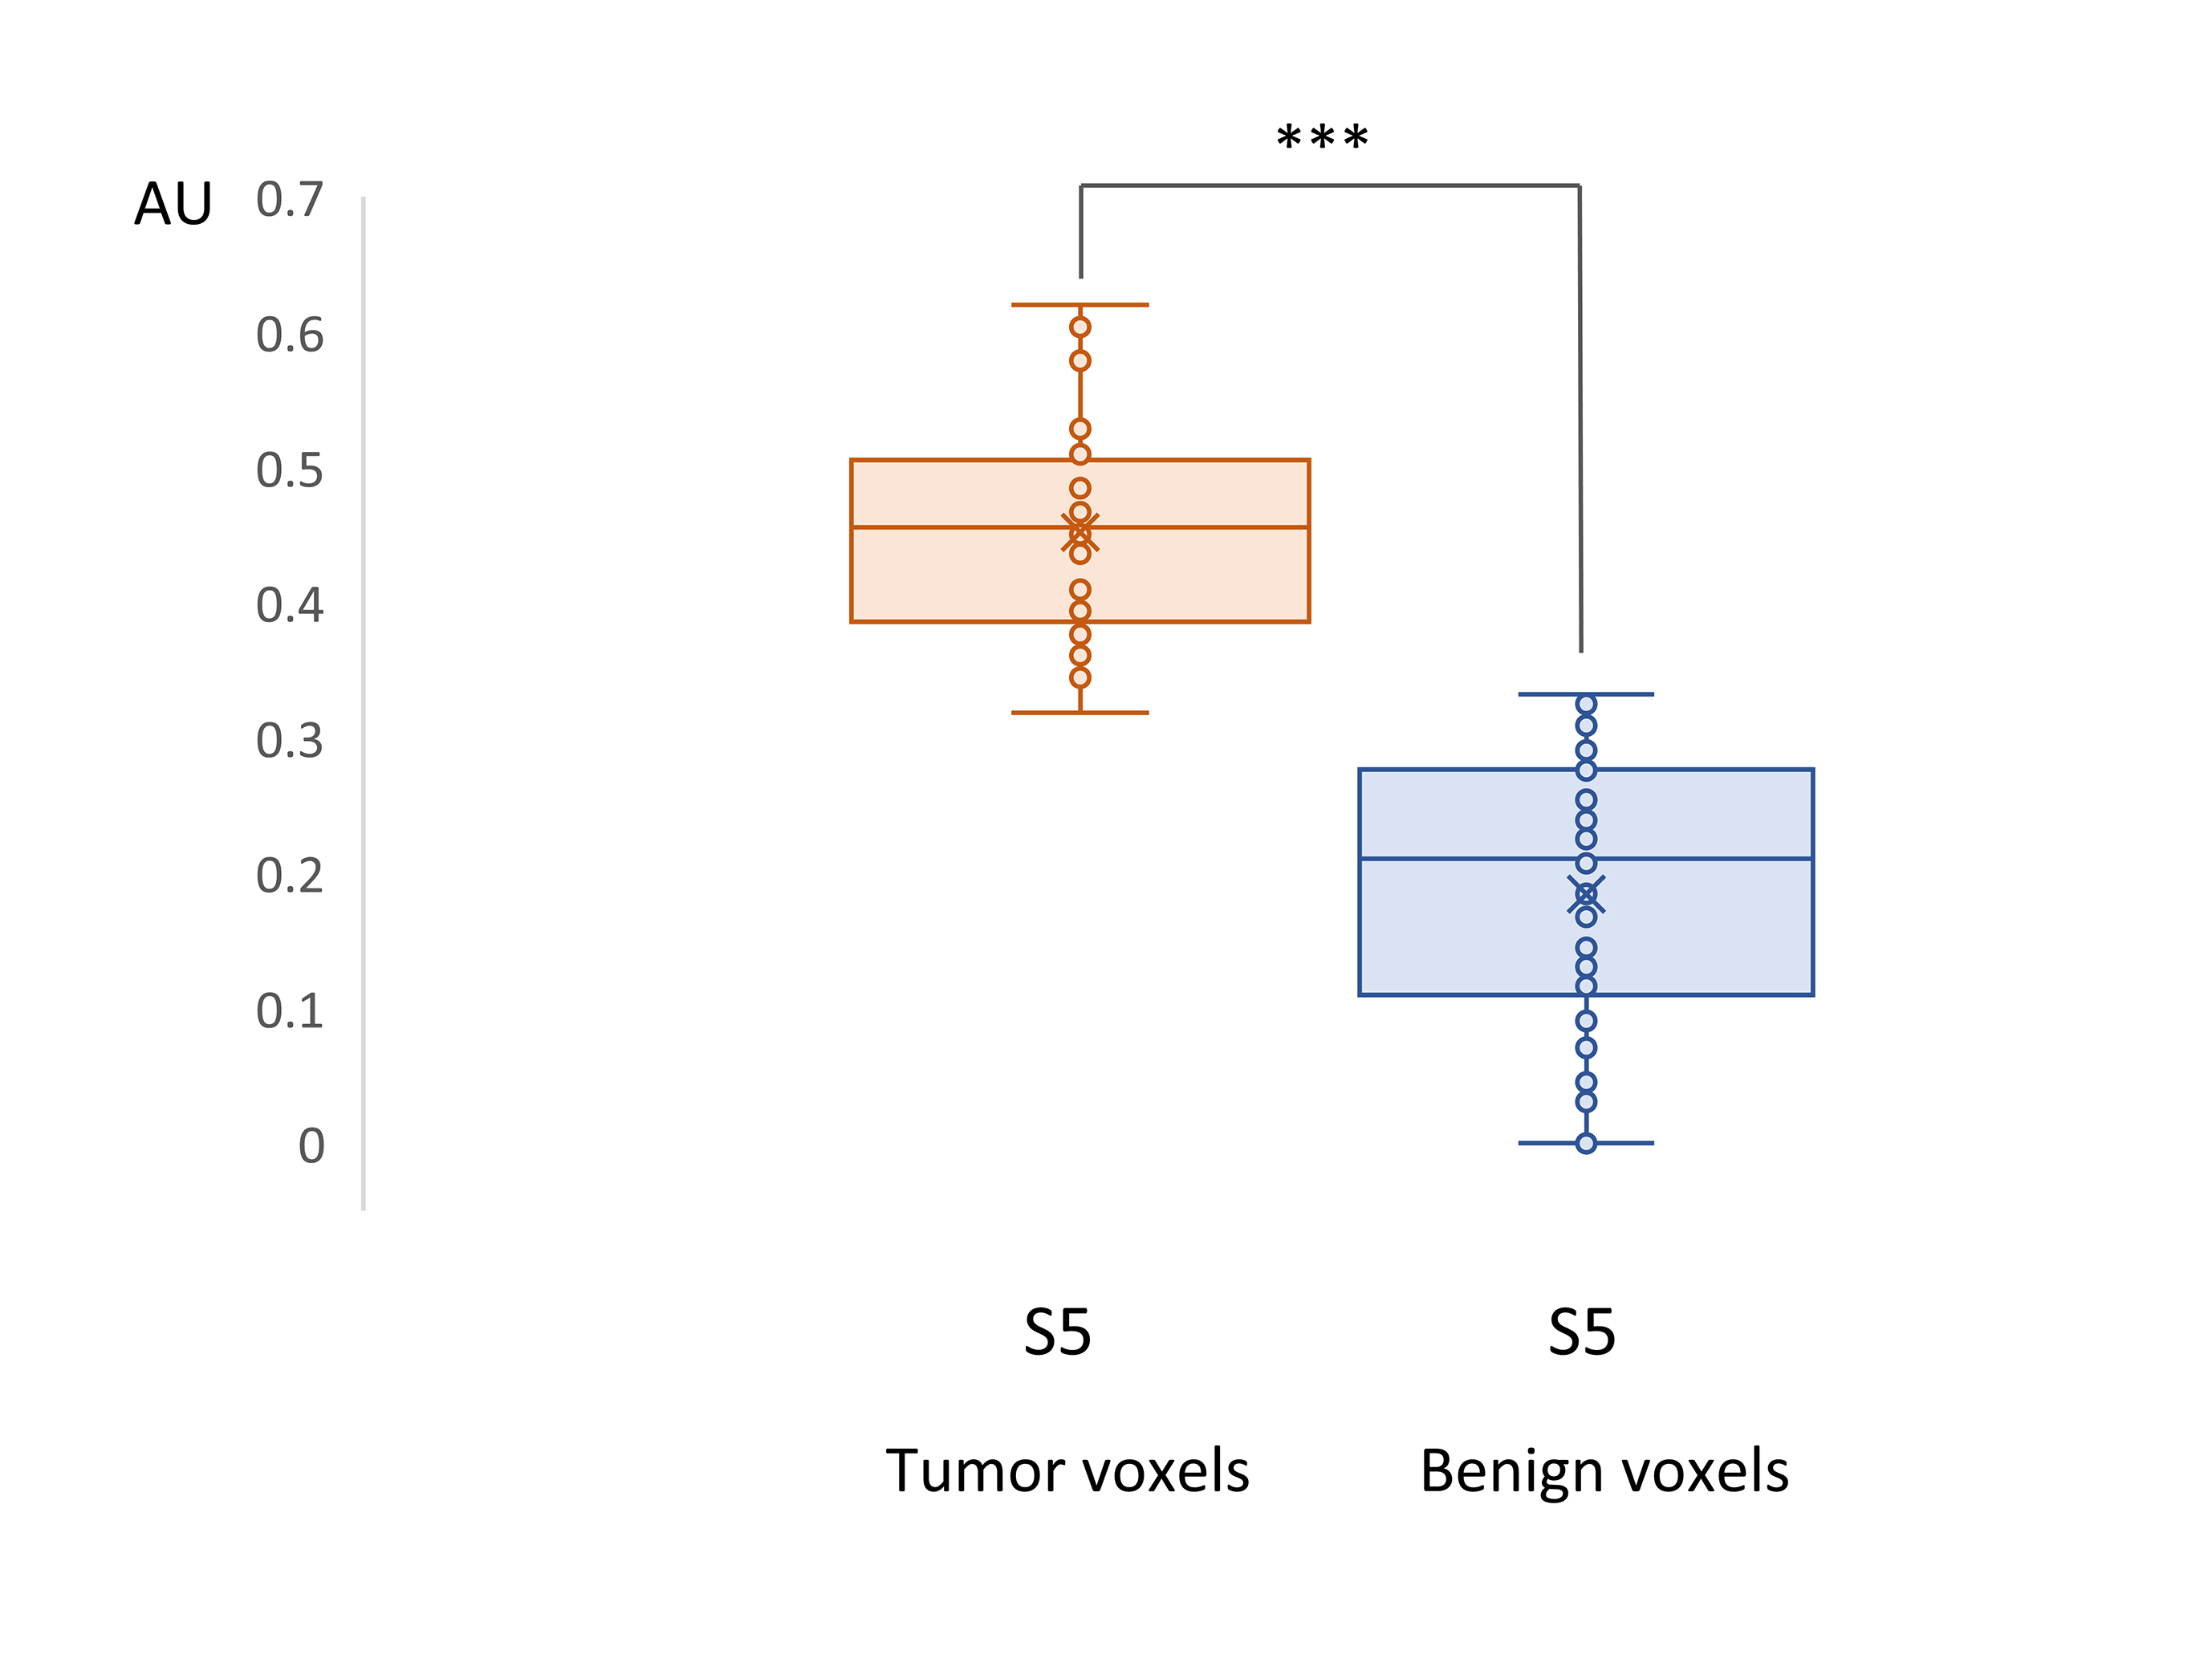
Figure 4. Box plot of the relative intensity of the tumorous component S5 in tumorous assigned voxels (N=38) and in benign assigned voxels (N=62) of patients in the test set. The data differ highly significantly at *** p<0.001 level.
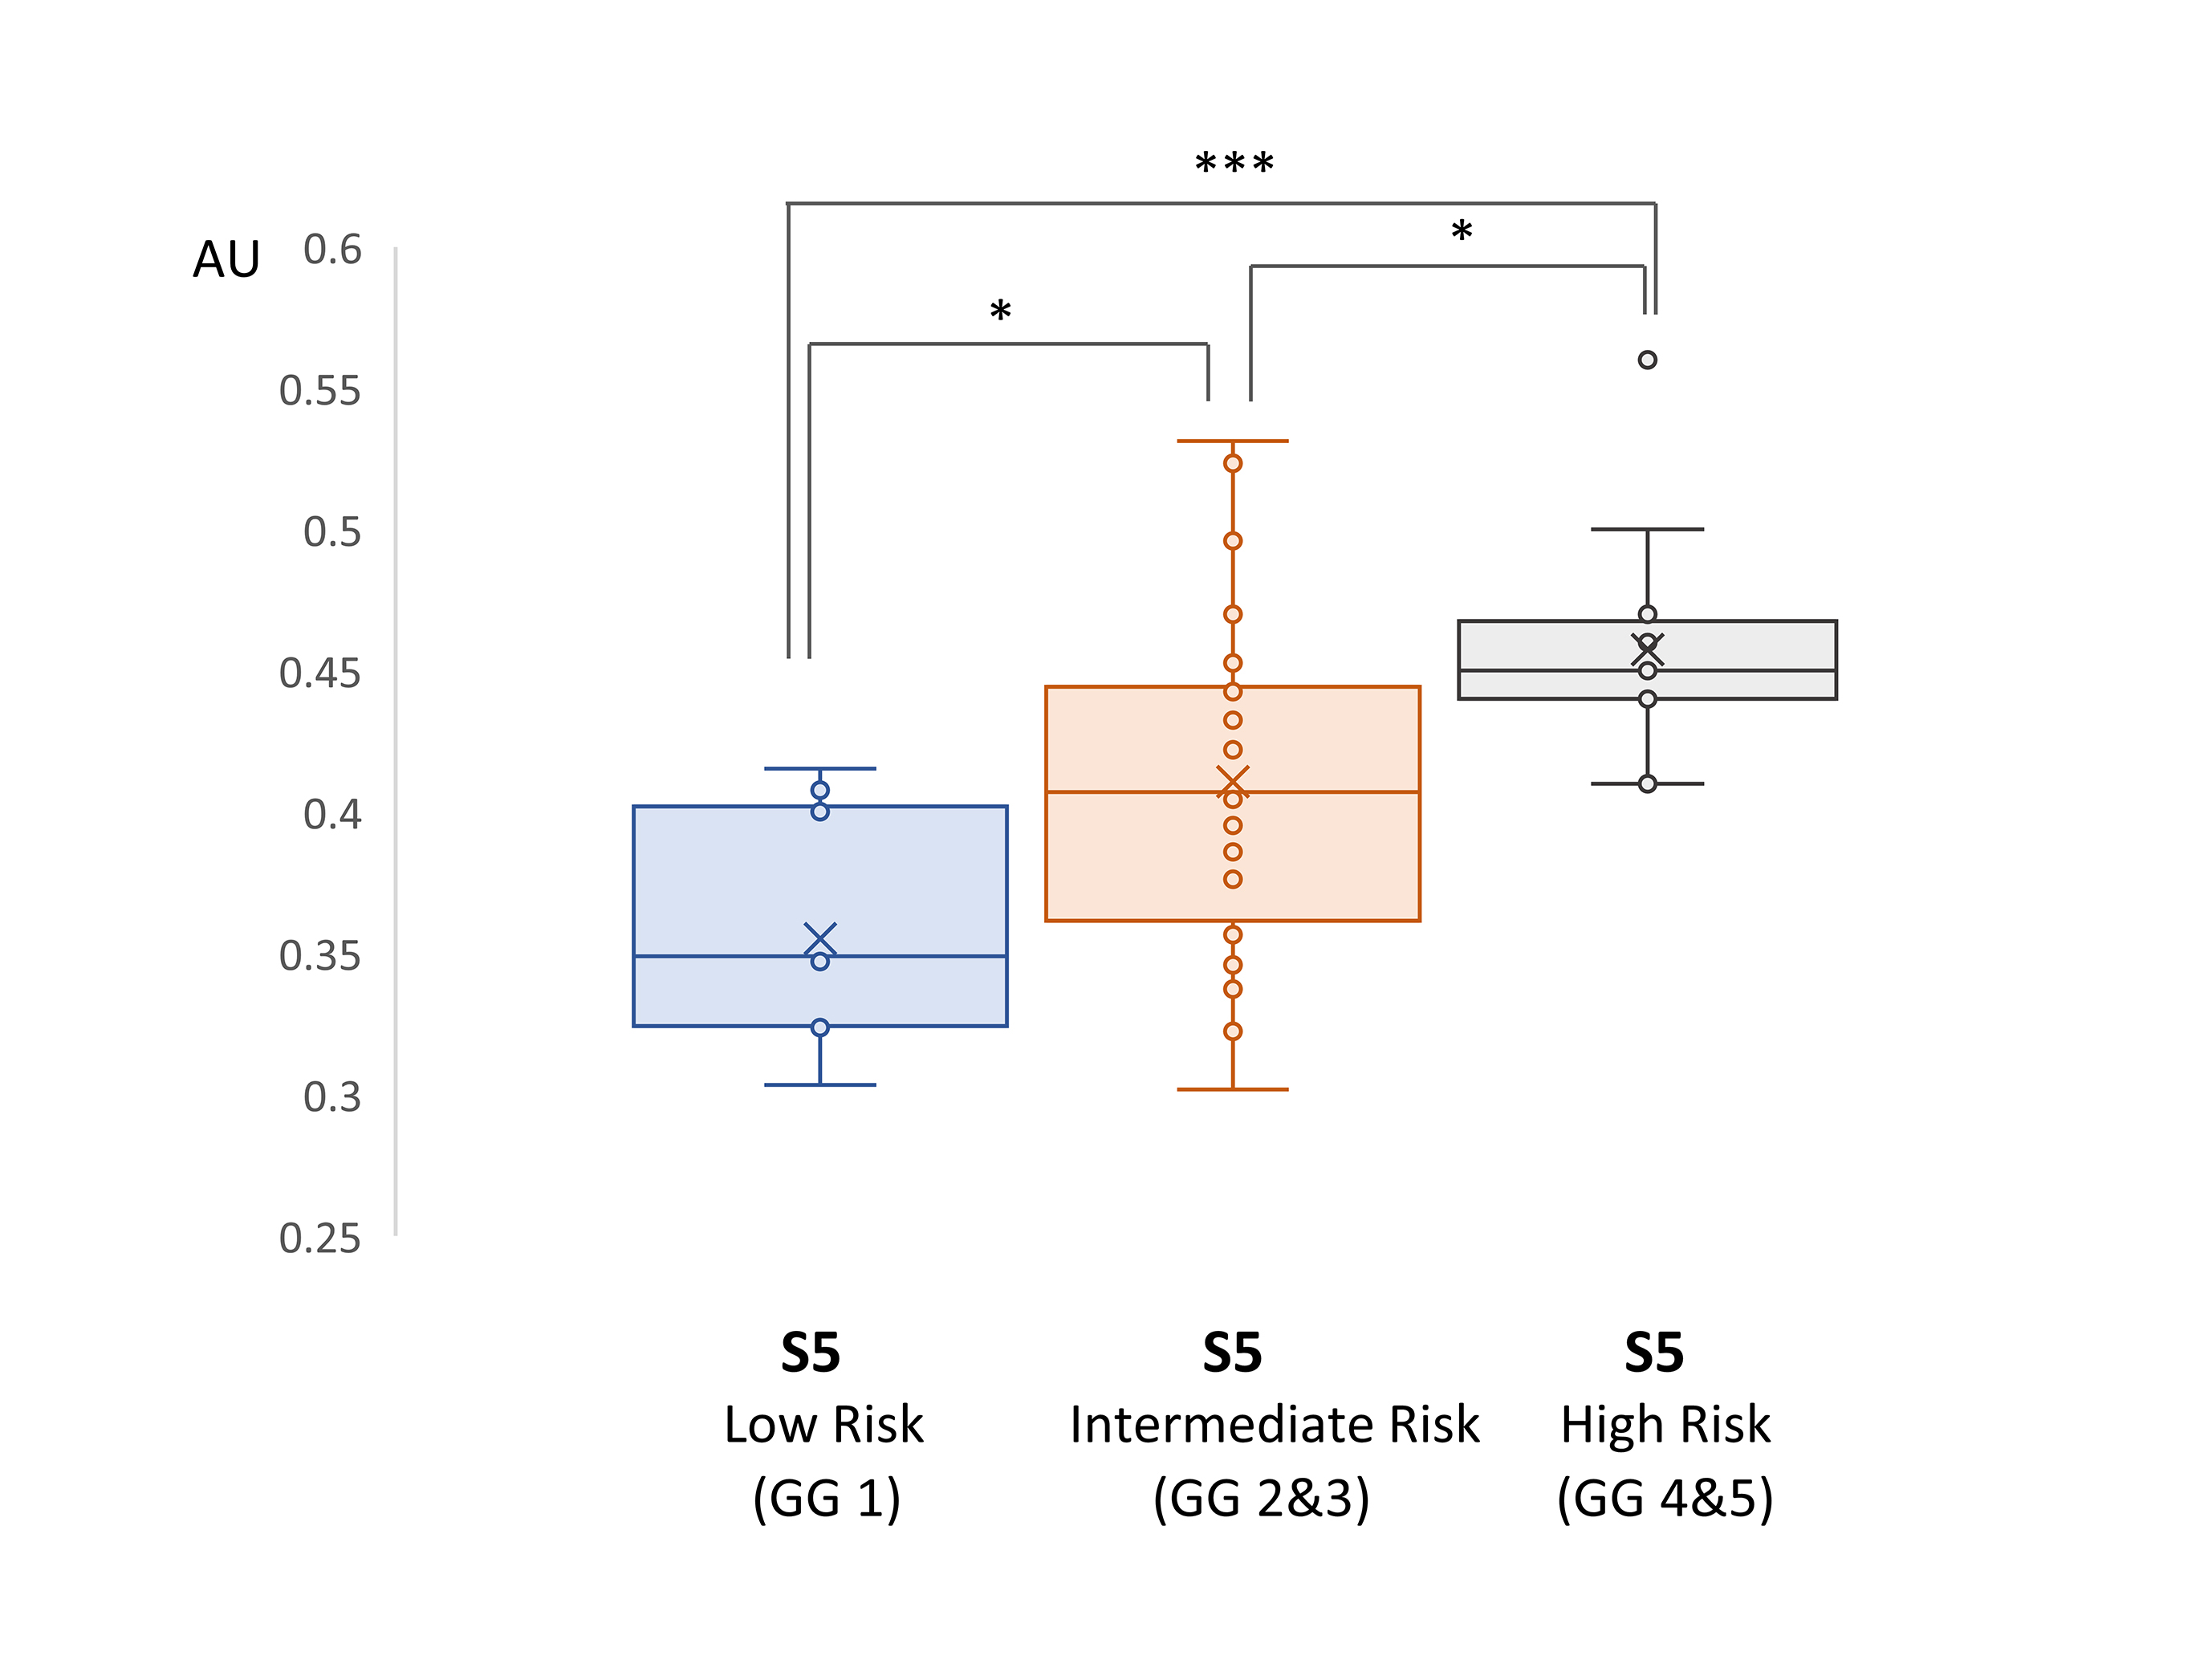
Figure 5. Box plot of the tumorous component S5 in tumorous assigned voxels in tumors of different Grade Groups of 43 patients in the test set. The data sets are significantly different at different levels: * p<0.05, *** p<0.001