0323
Background prostate tissue is quantitatively abnormal on T2-weighted MRI in patients with clinically significant prostate cancer1Department of Radiology, University of California San Diego, La Jolla, CA, United States, 2Department of Radiation Medicine and Applied Sciences, University of California San Diego, La Jolla, CA, United States, 3School of Medicine, University of California San Diego, La Jolla, CA, United States, 4Department of Bioengineering, University of California San Diego, La Jolla, CA, United States, 5Department of Biology, San Diego State University, San Diego, CA, United States, 6Department of Pathology, University of California San Diego, La Jolla, CA, United States, 7Department of Urology, University of California San Diego, La Jolla, CA, United States, 8Department of Medicine, University of California San Diego, La Jolla, CA, United States, 9Department of Neurosciences, University of California San Diego, La Jolla, CA, United States, 10Halıcıoğlu Data Science Institute, University of California San Diego, La Jolla, CA, United States
Synopsis
Keywords: Prostate, Cancer, T2-weighted MRI; Background prostate; Benign-appearing prostate
In this study, we examined whether patients with clinically significant prostate cancer (csPCa) have abnormal T2-weighted signal in prostate tissue outside of index lesions identified on MRI—i.e., in the background prostate (BP). In two independent patient cohorts, normalized T2-weighted signal was systematically lower in the BP of subjects with csPCa compared to those without. Reduced T2-weighted BP signal indicated the presence of csPCa with accuracy comparable to lesion-based measurements. Consideration of T2-weighted signal in the whole prostate improved patient-level detection of csPCa over DWI alone, suggesting that it provides complementary diagnostic value.Introduction
While many studies have established the value of T2 for detection of clinically significant prostate cancer (csPCa)1–6, these have primarily focused on characterizing T2 within radiographically visible lesions. The present study seeks to determine whether patients with csPCa have abnormal T2-weighted signal in prostate tissue outside of the index lesions identified on MRI—i.e., in the background prostate (BP). Identifying patients with abnormal MRI features outside visible lesions might complement lesion-level features and be useful in deciding which patients need to undergo prostate biopsy.Here, we examine two independent patient cohorts for a systematic decrease in T2-weighted BP signal of patients with csPCa and investigate some potential causes for the observed reduction in T2-weighted signal. We then test whether T2-weighted BP signal can complement diffusion-weighted MRI (DWI) to improve csPCa detection.
Methods
Two cohorts of patients with suspected prostate cancer were included in this study, independent in time and MRI acquisition protocol. From cohort 1, 46 patients (age: 64±10 years; PSA: 10.8±17.2 ng/mL) were included. From cohort 2, 151 patients were included (age: 65±8 years; PSA: 11.8±13.9 ng/mL).MRI acquisition
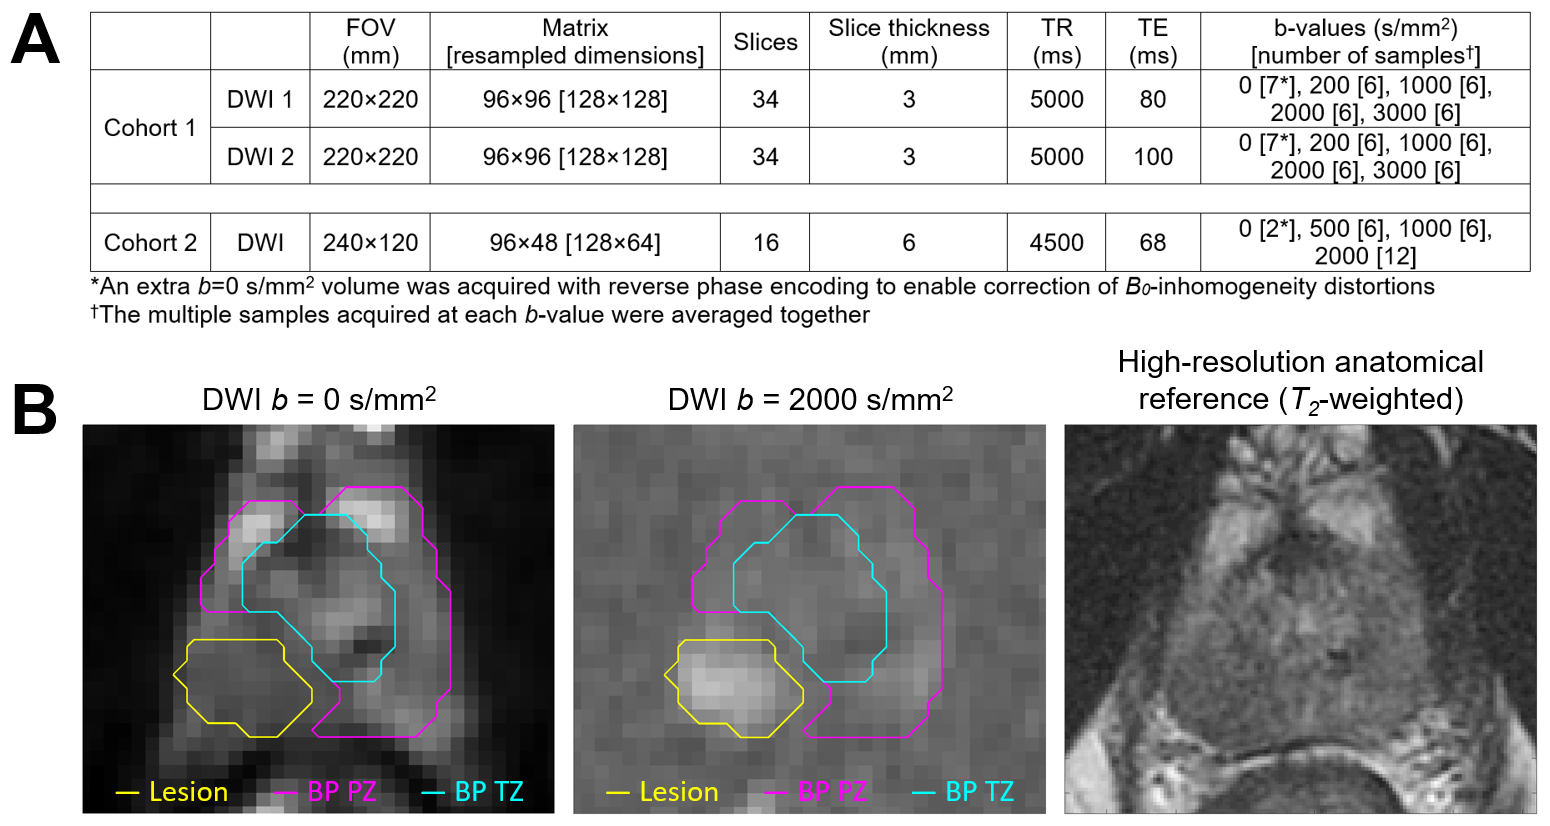
MR imaging was performed on 3T clinical scanners (Discovery MR750; GE Healthcare), using a 32-channel phased-array body coil. Acquisition details are summarized in Figure 1A. For cohort 1, two axial DWI volumes were separately acquired for each patient using different echo times (TEs) but with other parameters held constant. For cohort 2, a single axial DWI volume was acquired for each patient.
MRI post-processing
Post-processing and analysis were performed using MATLAB (MathWorks, Inc). Diffusion data were first corrected for B0 inhomogeneity, gradient nonlinearity, and eddy current distortions7–9. Registration10 was applied to correct for motion between the separately-acquired DWI volumes of cohort 1. All DWI volumes were normalized by the median signal intensity of urine in the bladder at b=0 s/mm2 to account for arbitrary signal-intensity scaling between acquisitions11.
Quantitative T2 mapping was performed for cohort 1 by fitting the signal values from the two b=0 s/mm2 volumes acquired at different TEs with the T2-weighted signal decay formula: $$$S(TE)=S_0e^{-TE/T_2}$$$, where S(TE) is the signal measured at a particular TE and S0 is the initial signal magnitude (proportional to proton density12). Voxel-wise maps of T2 and S0 were recorded for each patient.
Regions of interest (ROIs) were defined for the whole prostate (WP), peripheral zone (PZ), and transition zone (TZ) using MIM (MIM Software, Inc). ROIs were also defined over any cancerous or benign lesions identified by radiologists using PI-RADS v2.1. Cancerous lesions were those confirmed as csPCa (grade group ≥2) on biopsy or prostatectomy.
T2-weighted signal examination
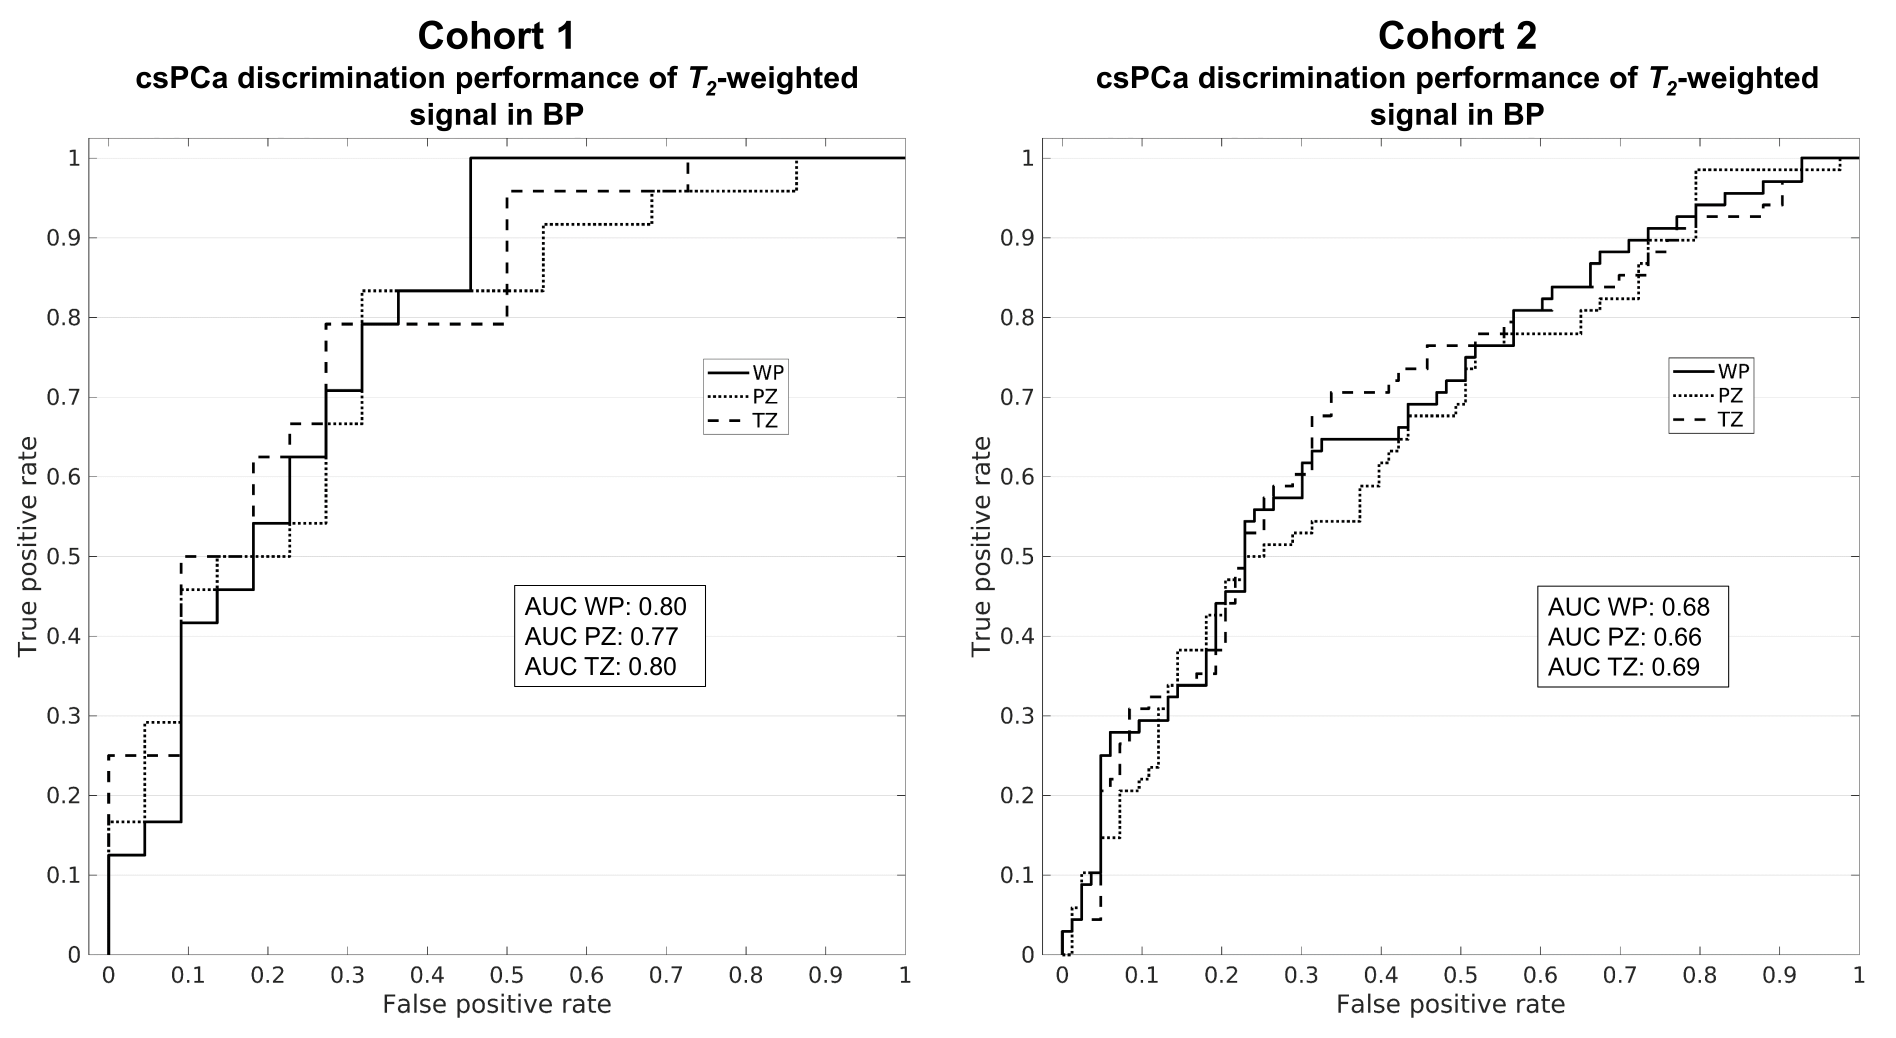
Median signal intensity on urine-normalized b=0 s/mm2 (T2-weighted) volumes was computed for all ROIs in BP, i.e., excluding lesions plus a surrounding 5mm margin (Figure 1B). Receiver operating characteristic (ROC) curves were generated at the patient level, using median BP signal as the predictor to determine the presence of csPCa on clinical biopsy. Area under the ROC curve (AUC) was computed to evaluate csPCa discrimination performance.
Median T2 and S0 were computed for all BP ROIs. Pearson correlation was computed between patient age and T2. Median T2 was recomputed multiple times with increasingly large margins of excluded voxels around the csPCa lesion ROI, ranging from 0 to 30mm.
T2-weighted signal intensity, T2, and S0 measurements were compared between patients with and without csPCa using two-sample t-tests to assess statistical significance (α=0.05).
Complementing DWI with T2-weighted signal
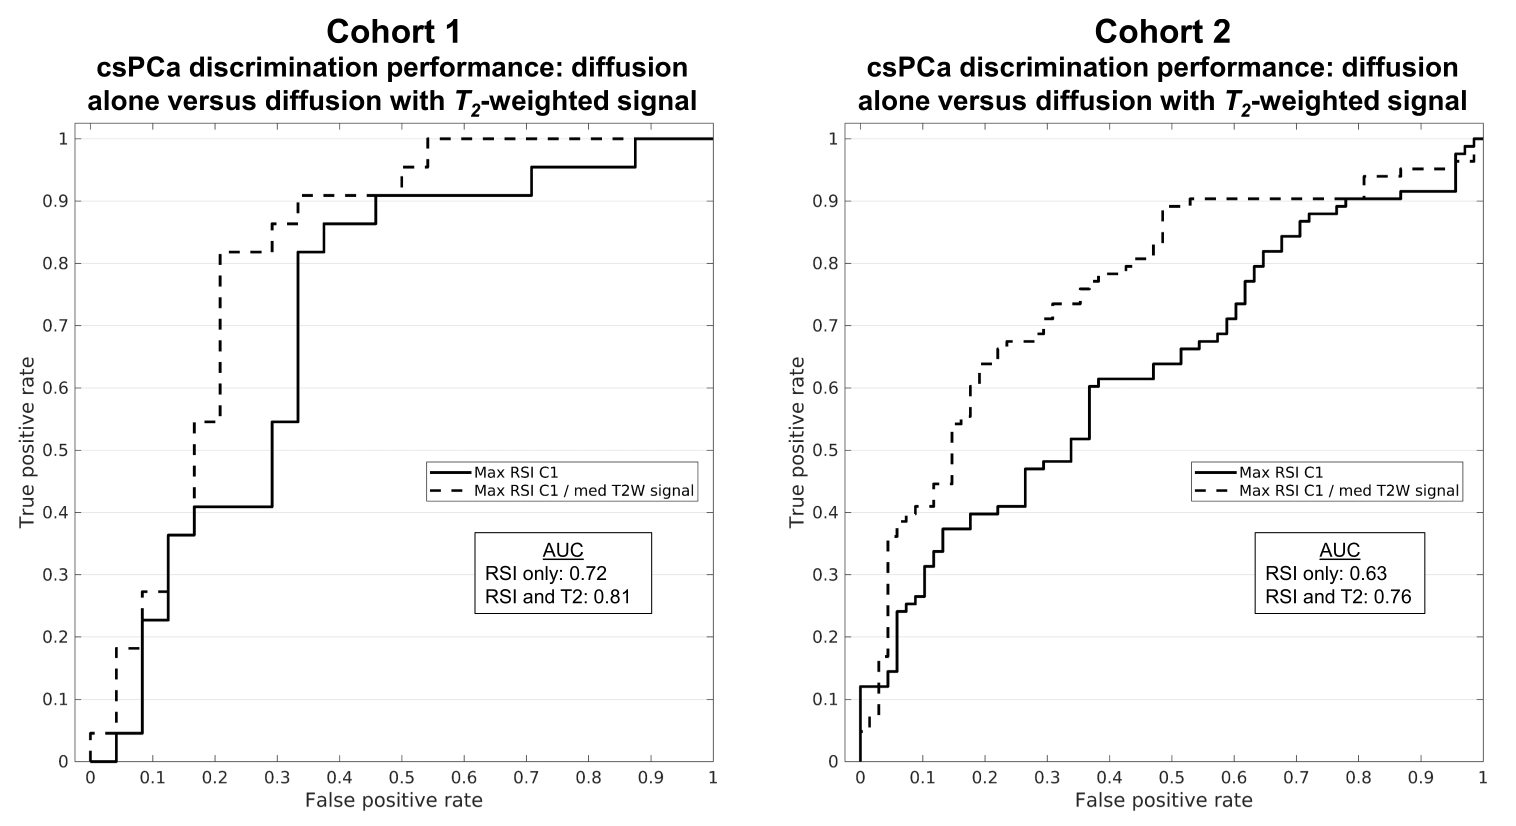
Prior studies have employed Restriction Spectrum Imaging (RSI) C1 (RSI C1) as a diffusion-based indicator of prostate cancer13,14. RSI C1 was computed by fitting the DWI data with a previously-described 4-compartment RSI model13,15. ROC curves were generated to compare csPCa discrimination performance between two predictors: maximum RSI C1, and maximum RSI C1 normalized by median T2-weighted signal in the whole prostate.
Results
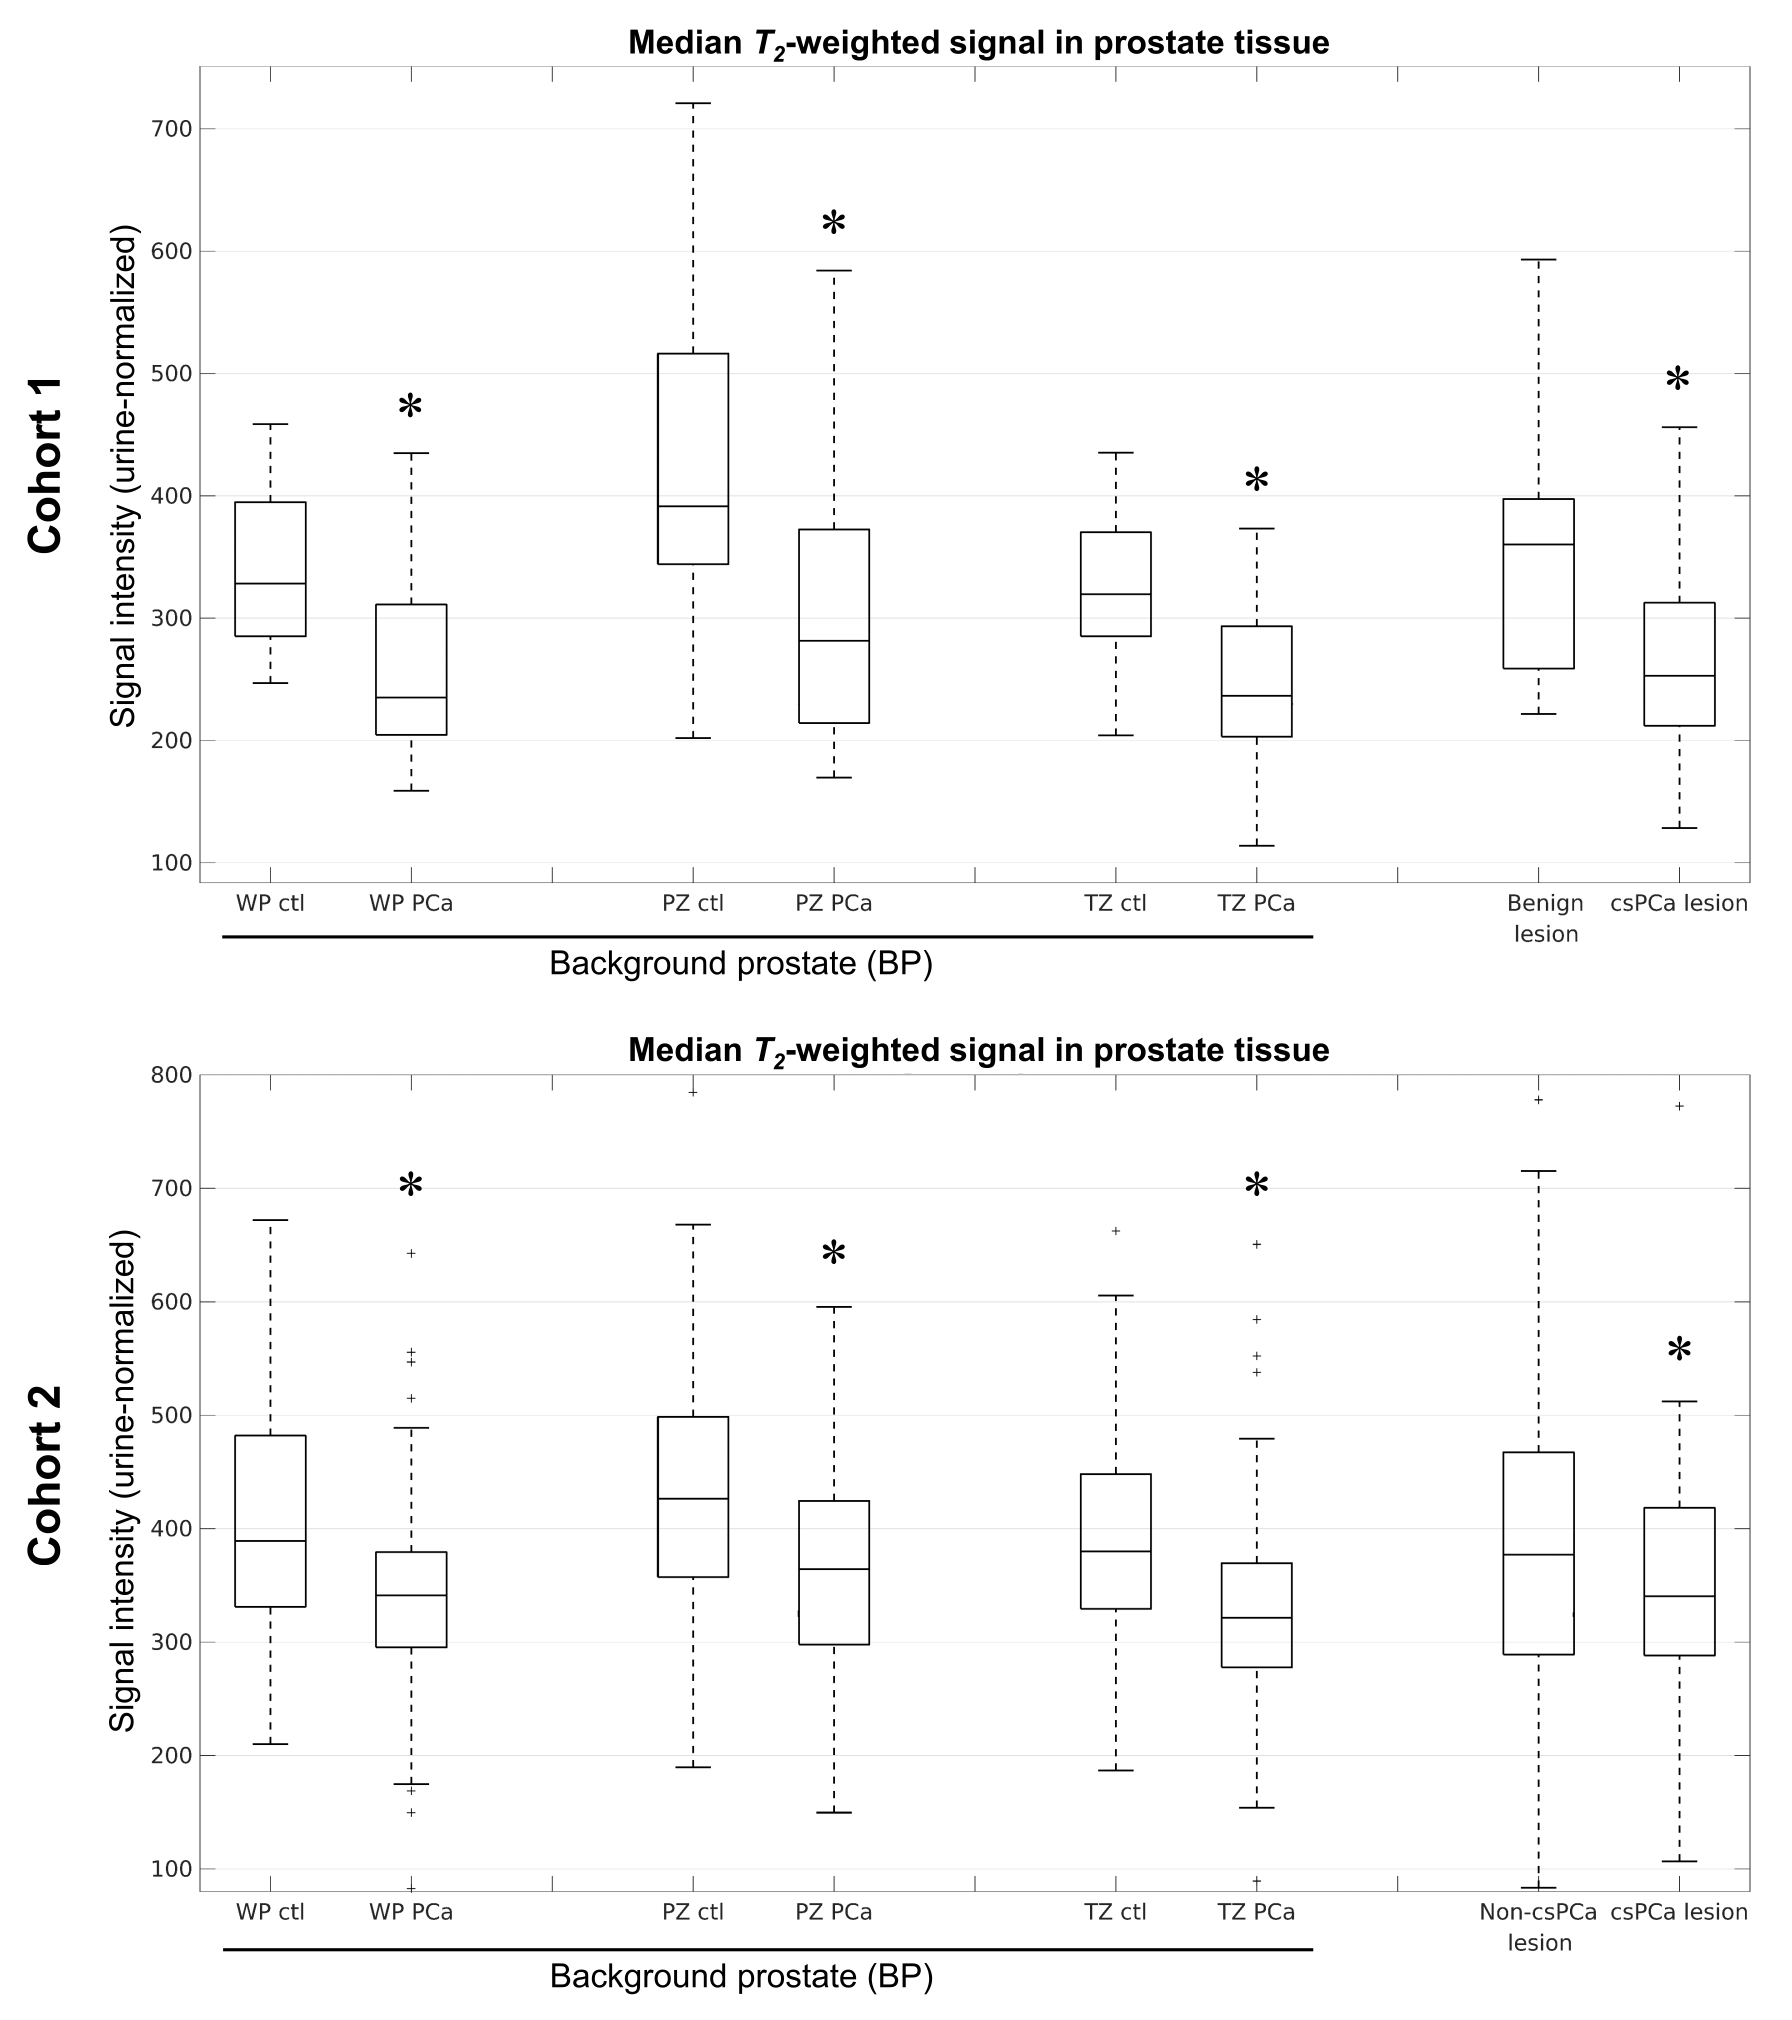
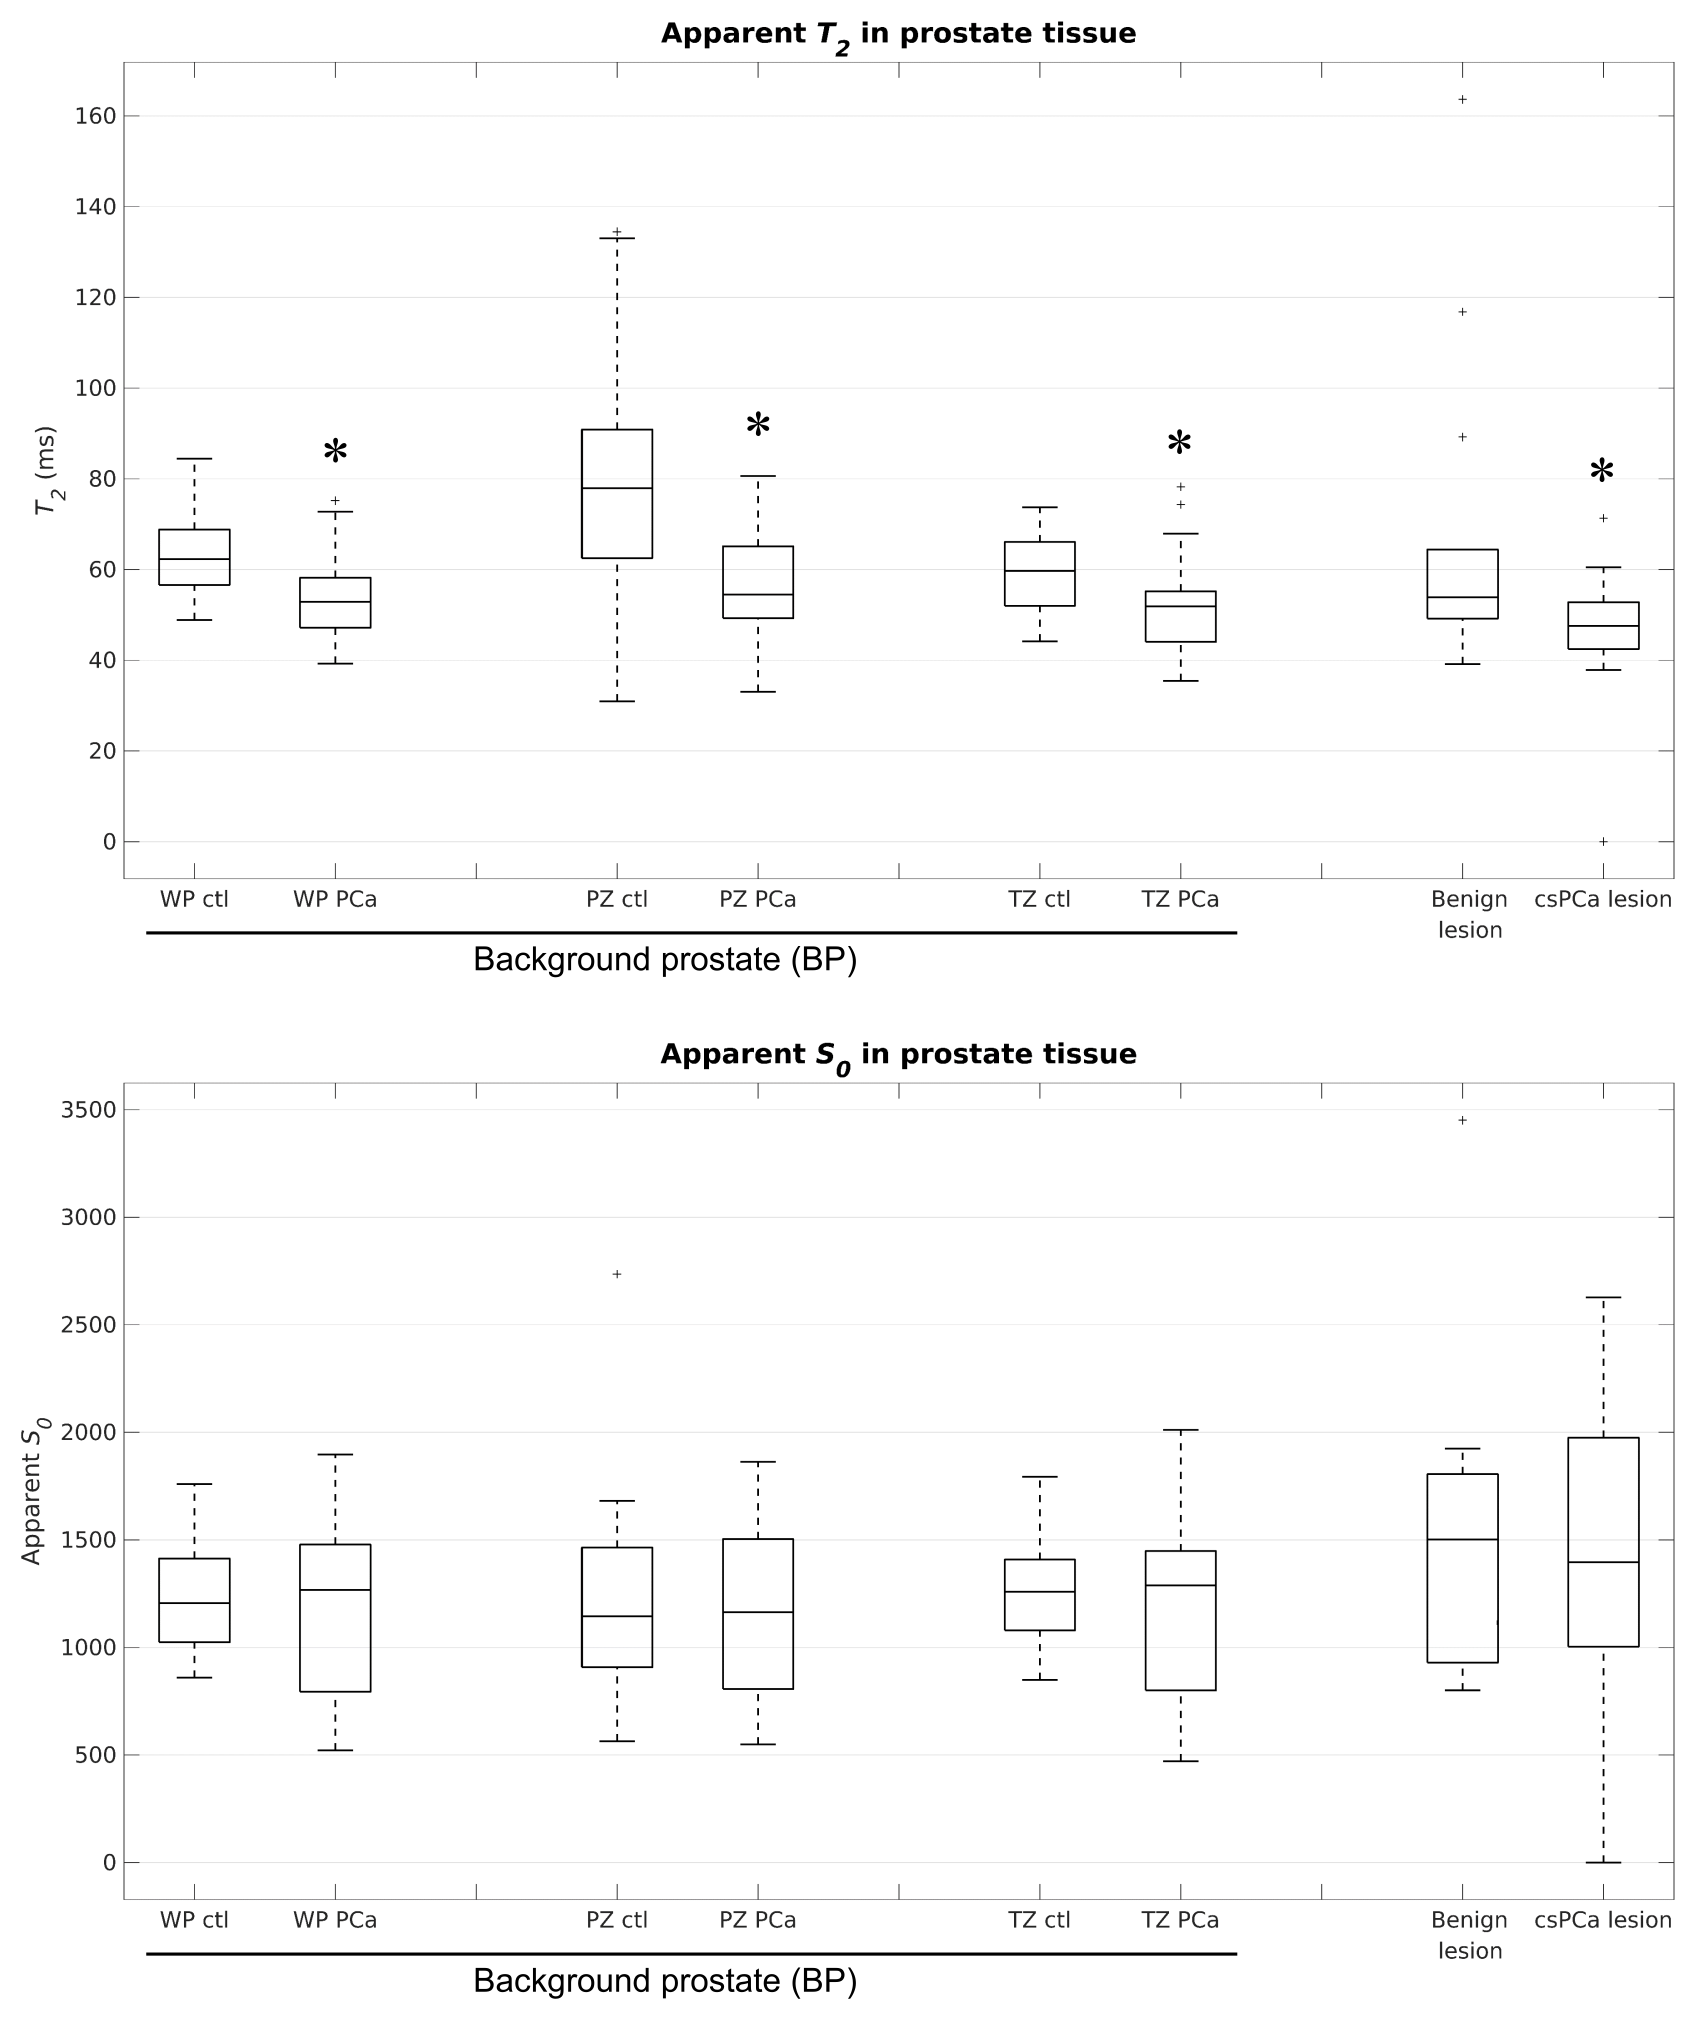
Figure 2 summarizes the T2-weighted signal characteristics of prostate tissue. Median urine-normalized T2-weighted signal was systematically lower in subjects with csPCa compared to those without, even in BP (p≤0.03). The csPCa discrimination performance of BP signal is quantified by the ROC curves in Figure 3.Figure 4 summarizes T2 and S0 of prostate tissue from cohort 1. T2 was significantly lower in BP of patients with csPCa compared to those without (p≤0.01), while S0 was not (p≥0.30). BP T2 was not significantly correlated with patient age in any zone: WP: r=-0.02, PZ: r=-0.15, TZ: r=0.16. BP T2 values were stable to within 5% for all lesion-ROI margin sizes (maximum T2 change in WP: 4.3%, PZ: 3.0%, TZ: -4.1%).
Consideration of T2-weighted signal improved cancer discrimination performance compared to RSI C1 alone (Figure 5).
Discussion
T2-weighted BP signal was systematically lower in patients with csPCa, and it indicated the presence of csPCa with accuracy comparable to lesion-based assessments16–18. Decreased T2, rather than proton density, appears to be driving the reduction in T2-weighted BP signal. Decreased BP T2 was not linked to normal aging of the prostate or csPCa adjacent to the visible lesion, and might reflect pre-cancerous inflammation and/or modifications in local gene expression19. Consideration of T2-weighted BP signal improved csPCa detection over RSI C1 alone, suggesting that it provides diagnostic value complementary to DWI.Acknowledgements
This work was supported by funded from the Prostate Cancer Foundation, the American Society for Radiation Oncology, and the National Institutes of Health (#K08EB026503, #UL1TR000100)References
1. Mai J, Abubrig M, Lehmann T, et al. T2 Mapping in Prostate Cancer. Investigative Radiology. 2019;54(3):146–152.
2. Sabouri S, Chang SD, Savdie R, et al. Luminal Water Imaging: A New MR Imaging T2 Mapping Technique for Prostate Cancer Diagnosis. Radiology. 2017;284(2):451–459.
3. Metzger GJ, Kalavagunta C, Spilseth B, et al. Detection of Prostate Cancer: Quantitative Multiparametric MR Imaging Models Developed Using Registered Correlative Histopathology. Radiology. 2016;279(3):805–816.
4. Hoang Dinh A, Souchon R, Melodelima C, et al. Characterization of prostate cancer using T2 mapping at 3T: A multi-scanner study. Diagnostic and Interventional Imaging. 2015;96(4):365–372.
5. Roebuck JR, Haker SJ, Mitsouras D, et al. Carr-Purcell-Meiboom-Gill imaging of prostate cancer: quantitative T2 values for cancer discrimination. Magnetic Resonance Imaging. 2009;27(4):497–502.
6. Hoang Dinh A, Melodelima C, Souchon R, et al. Quantitative Analysis of Prostate Multiparametric MR Images for Detection of Aggressive Prostate Cancer in the Peripheral Zone: A Multiple Imager Study. Radiology. 2016;280(1):117–127.
7. Holland D, Kuperman JM, Dale AM. Efficient correction of inhomogeneous static magnetic field-induced distortion in Echo Planar Imaging. NeuroImage. 2010;50(1):175–183.
8. White NS, McDonald CR, Farid N, et al. Diffusion-Weighted Imaging in Cancer: Physical Foundations and Applications of Restriction Spectrum Imaging. Cancer Res. 2014;74(17):4638–4652.
9. Zhuang J, Hrabe J, Kangarlu A, et al. Correction of Eddy-Current Distortions in Diffusion Tensor Images Using the Known Directions and Strengths of Diffusion Gradients. J Magn Reson Imaging. 2006;24(5):1188–1193.
10. Paquin D, Levy D, Schreibmann E, et al. Multiscale Image Registration. Mathematical Biosciences & Engineering. 2006;3(2):389.
11. Sunoqrot MRS, Nketiah GA, Selnæs KM, et al. Automated reference tissue normalization of T2-weighted MR images of the prostate using object recognition. Magn Reson Mater Phy. 2021;34(2):309–321.
12. Bloch F. Nuclear Induction. Phys. Rev. 1946;70(7–8):460–474.
13. Feng CH, Conlin CC, Batra K, et al. Voxel-level Classification of Prostate Cancer on Magnetic Resonance Imaging: Improving Accuracy Using Four-Compartment Restriction Spectrum Imaging. Journal of Magnetic Resonance Imaging. 2021;54(3):975–984.
14. Zhong AY, Digma LA, Hussain T, et al. Patient-level detection of grade group ≥2 prostate cancer using quantitative diffusion MRI. medRxiv. 2021:2021.05.24.21256461.
15. Conlin CC, Feng CH, Rodriguez‐Soto AE, et al. Improved Characterization of Diffusion in Normal and Cancerous Prostate Tissue Through Optimization of Multicompartmental Signal Models. Journal of Magnetic Resonance Imaging. 2021;53(2):628–639.
16. Bajgiran AM, Mirak SA, Sung K, et al. Apparent Diffusion Coefficient (ADC) Ratio Versus Conventional ADC for Detecting Clinically Significant Prostate Cancer With 3-T MRI. American Journal of Roentgenology. 2019;213(3):W134–W142.
17. Singh S, Rogers H, Kanber B, et al. Avoiding Unnecessary Biopsy after Multiparametric Prostate MRI with VERDICT Analysis: The INNOVATE Study. Radiology. 2022:212536.
18. Lee GH, Chatterjee A, Karademir I, et al. Comparing Radiologist Performance in Diagnosing Clinically Significant Prostate Cancer with Multiparametric versus Hybrid Multidimensional MRI. Radiology. 2022:211895.
19. Schillaci O, Scimeca M, Trivigno D, et al. Prostate cancer and inflammation: A new molecular imaging challenge in the era of personalized medicine. Nuclear Medicine and Biology. 2019;68–69:66–79.
Figures