0317
Amide Proton Transfer Weighted Imaging to differentiate prostate suspicious nodules: Comparison with PI-RADS v2.1 score1Peking University Shenzhen Hospital, Shenzhen, China, 2Clinical & Technical Support, Philips Healthcare (Shenzhen) Ltd, Shenzhen, China
Synopsis
Keywords: Prostate, CEST & MT, APT
Diagnosis of prostate cancer (PCa) remains a challenge since PCa often occurs simultaneously with benign prostatic hyperplasia and has similar nodule appearance on T2-weighted imaging and diffusion weighted imaging. Amide proton transfer weighted (APTw) imaging is an endogenous biomarker to detect proteins and peptides in tissues non-invasively. Results of this study indicate the APTw ratio (rAPTw) values of PCa were significantly higher than those of prostate benign nodules. Therefore, rAPTw value is potentially a promising and valuable non-invasive biomarker in differentiating PCa from benign nodules.Introduction
Prostate cancer (PCa) is the second most common cancer in men and the second leading cause of cancer death1. Prostate cancer often occurs simultaneously with benign prostatic hyperplasia and has similar nodule appearance on T2-weighted imaging (T2WI) and Diffusion weighted imaging (DWI). For patients with prostate disease PI-RADS 3, 4 or 5, the probability of detecting clinically significant cancer is 12%, 23% and 60% respectively2. Amide proton transfer weighted imaging (APTw) is a new technique based on chemical exchange saturation transfer imaging. APT is a novel endogenous contrast mechanism for MRI by detecting low-concentration solutes such as mobile proteins and peptides in tissues or tumors that contain abundant amide (–NH) chemical constituents3. Previous studies have shown that APT is valuable in evaluating the brain tumor4. This study aims to determine whether APTw imaging could provide increased accuracy in differentiating prostate nodules comparing with Prostate Imaging Reporting and Data System (PI-RADS) v2.1 score.Methods
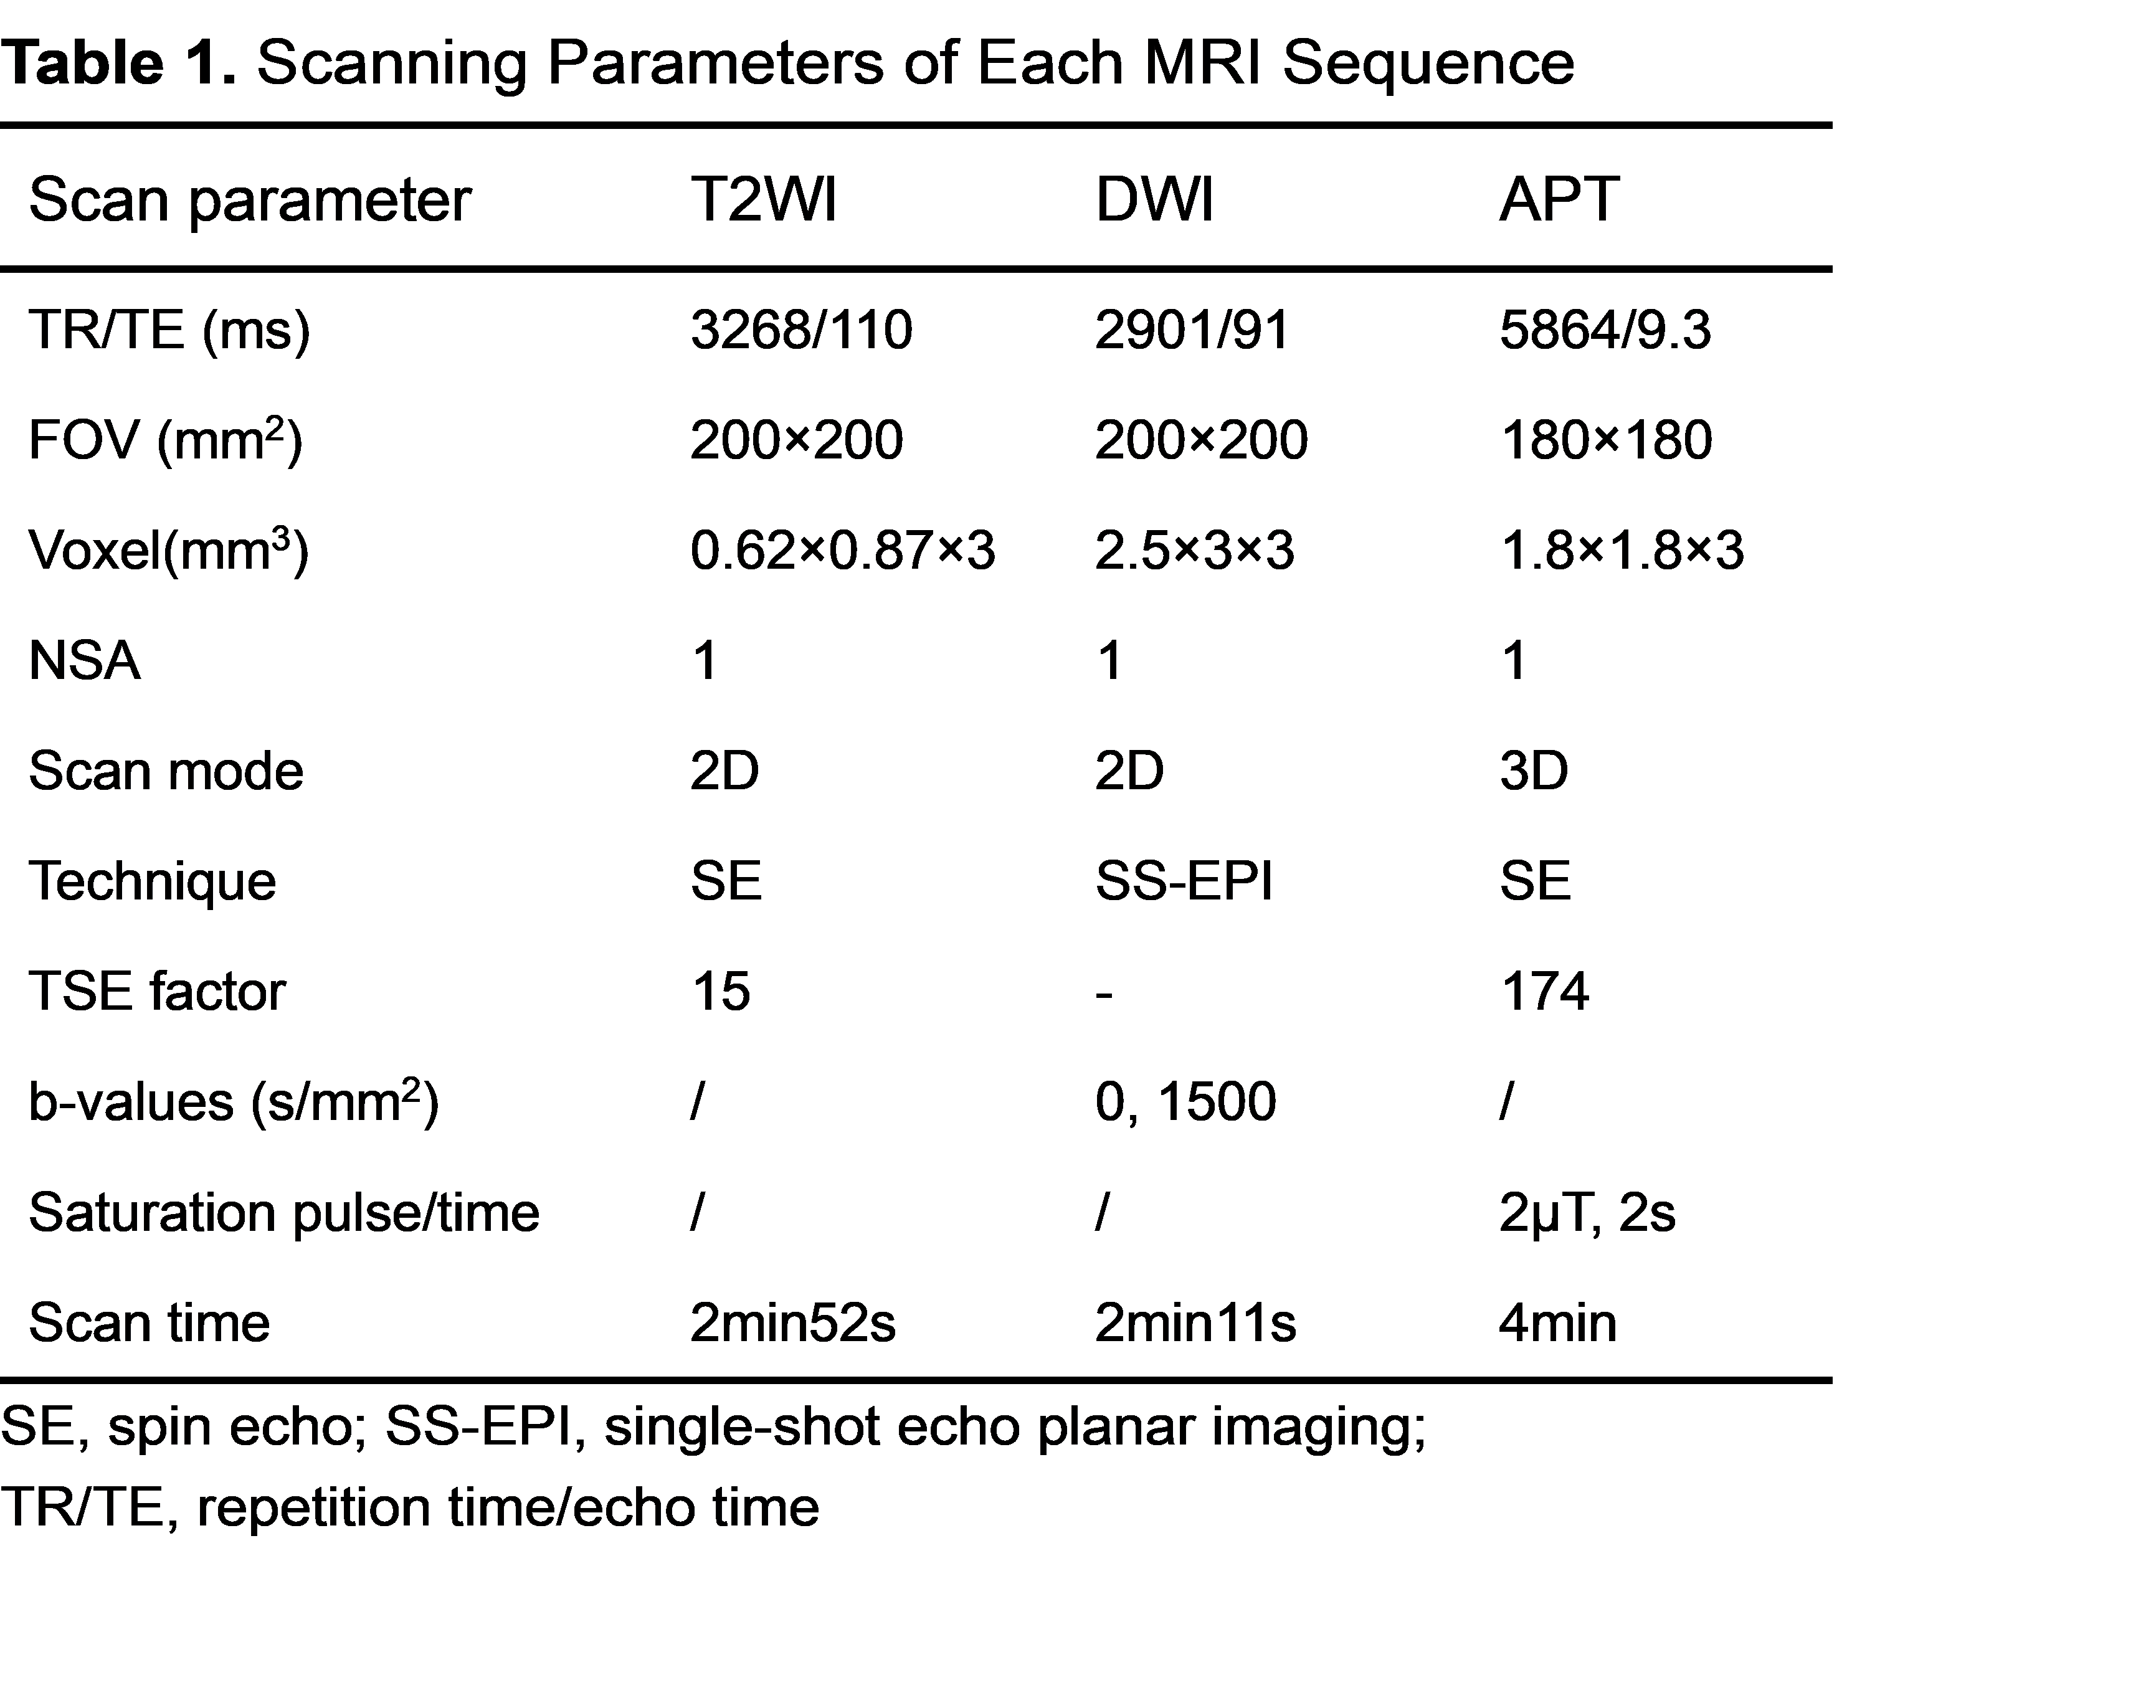
This retrospective study was approved by the institutional review board and included 54 patients [age: 67(56-82)years old, PSA: 11.935 (4-1000)ng/ml]. All patients were scanned using a 3.0 T MR scanner (Ingenia 3.0T, Philips Healthcare, the Netherlands) with an abdomen 32 channel coil. The Sequences and parameters were listed in table 1. Patients underwent targeted transrectal US fusion–guided prostate biopsy after MRI examination. All of prostate nodules were classified as malignant (n = 23) or benign (n = 31) based on pathology. For the quantitative analysis of APT parameters, ROIs were drawn on the APTw map by referring to the T2-weighted images in visible prostate nodules. The ROIs were placed on the APTw map by using the drawing tool to encompass as much of the inner aspect of the lesion as possible without contacting the edges and avoid cystic change, necrosis, calcification and urethra. The ratio of amide proton transfer weight (rAPTw) was obtained by dividing the APT value of a suspicious nodule ROI by the APT value of an area of normal tissue similar in size to the cancer ROI(rAPTw = APTnodule / APTnormal )in the same prostate zone (i.e., peripheral or transition) in mirror position to the tumor5. The rAPTw values of suspicious target nodule were analyzed by Mann Whitney U test to identify prostate benign and malignant lesions. The diagnostic efficacy of rAPTw values and PI-RADS v2.1 scores was compared using receiver operating characteristic (ROC) curve analysis to determine whether prostate lesions were benign or malignant. Differences in area under the receiver operating characteristic curve (AUC) were evaluated by using the DeLong method.Results
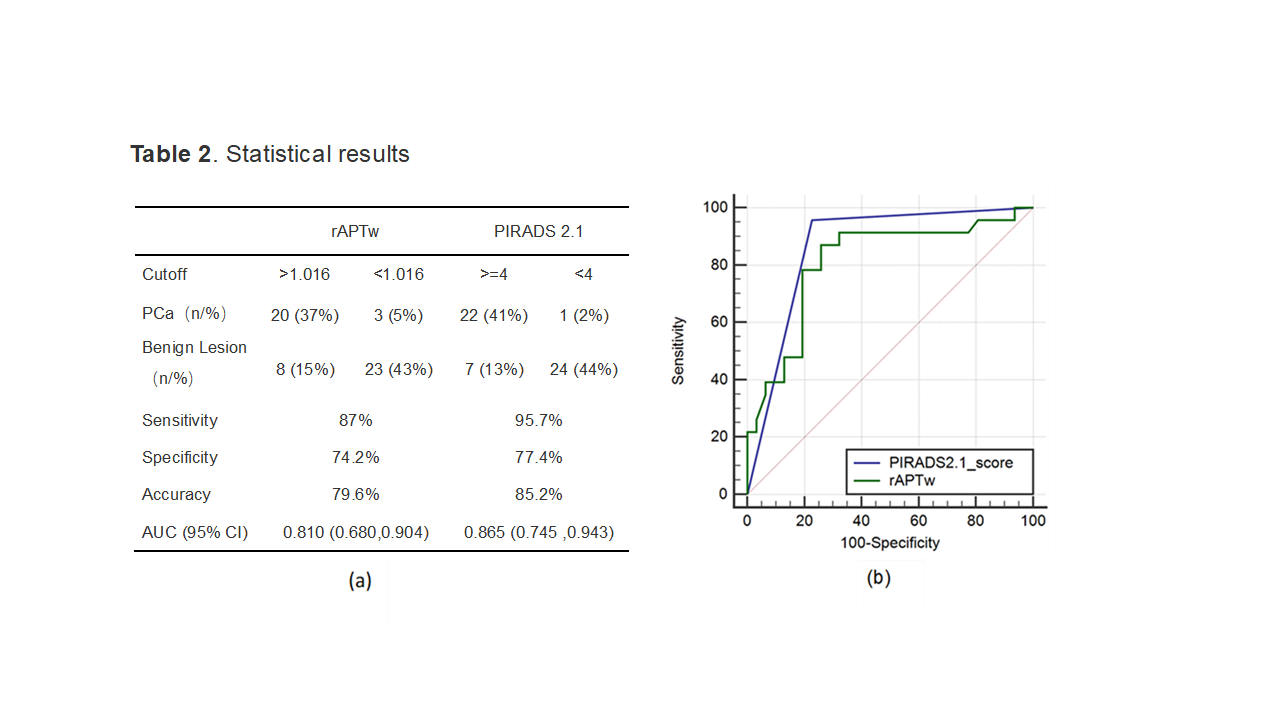
Measurement consistency between the two observers was good (ICC > 0.75), The median rAPTw value of prostate cancers was 1.10 (1.07, 1.26), while that of prostate benign nodules was 0.86 (0.76, 1.04). Additionally, there was a significant difference in the rAPTw values of the two groups (z=-3.867, P < 0.001). The rAPTw value was found to distinguish prostate cancers from benign lesions with a threshold of 1.016, which has sensitivity (87%), specificity (74.2%) and accuracy (85.2%). The ROC curve showed that the AUC value of rAPTw was 0.810 [95% confidence interval, 0.680 to 0.904],while that of PI-RADS v2.1 scores was 0.865 [95% confidence interval, 0.745 to 0.943], but there was no significant difference in AUC values between rAPTw and PI-RADS v2.1 scores (z= 0.803, P =0.4222).Discussion
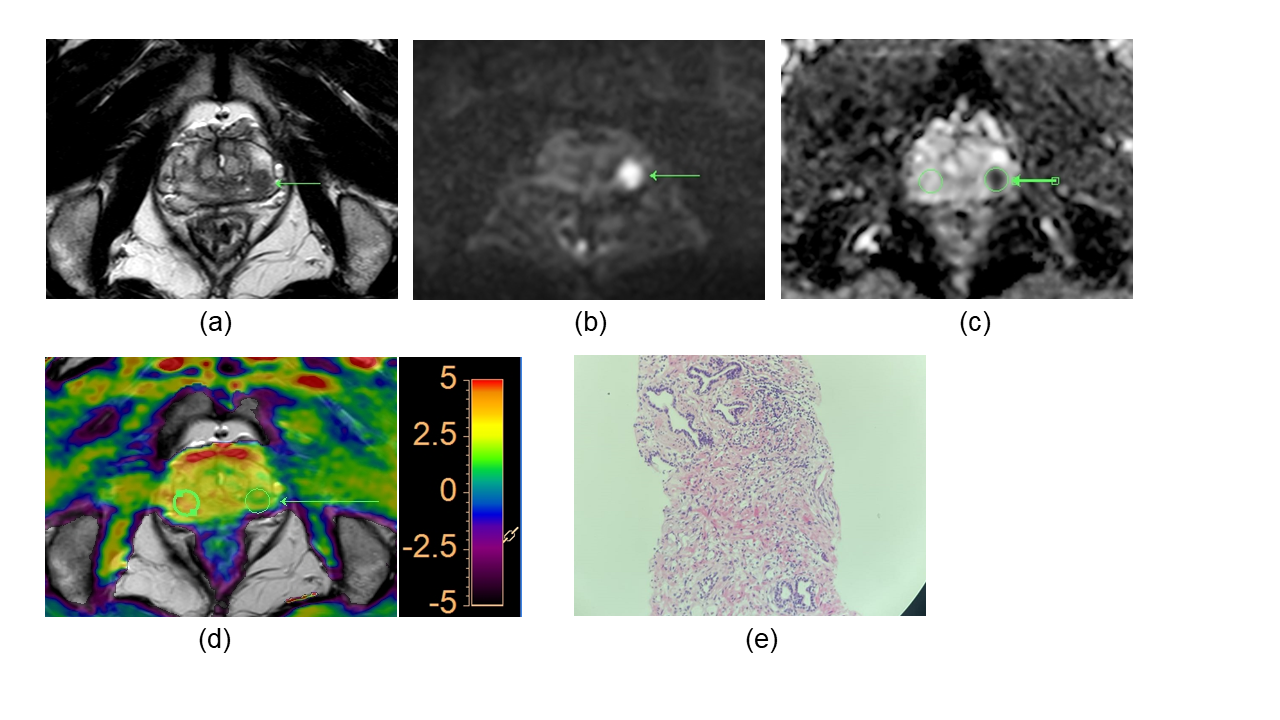
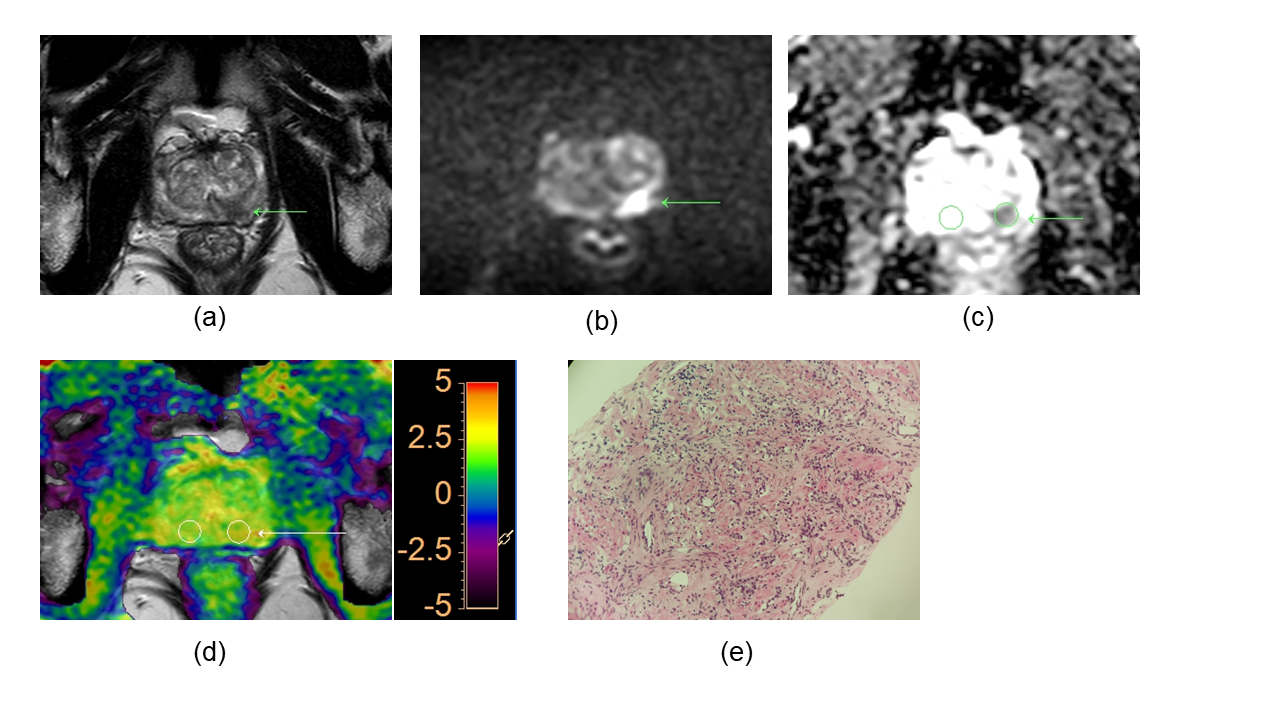
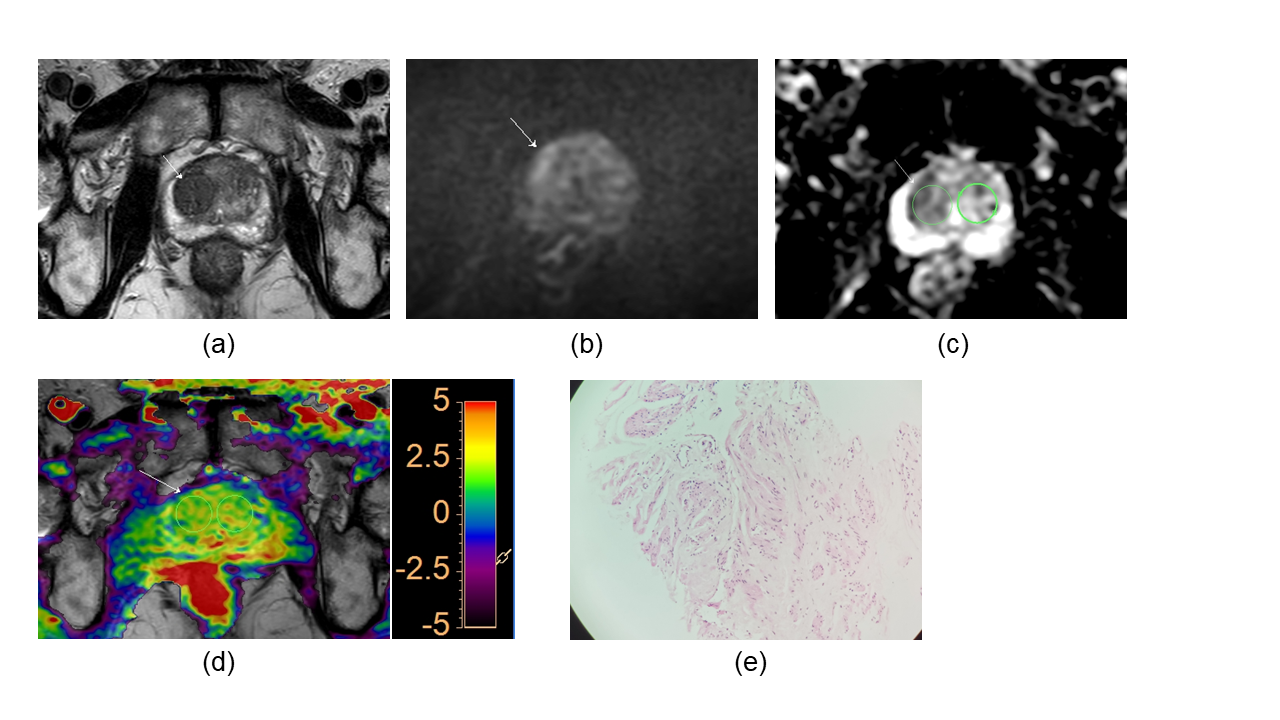
Our results showed that the rAPTw value of prostate cancer is significantly higher than that of the prostate benign nodules, this may indicate prostate cancer cells will secrete with a high mobility protein - androgen regulated six trans membrane protein6 and overexpressed Caveolin-1 protein which plays a role in molecular transport and cell adhesion7. Moreover, because the rAPTw value is not an absolute value and is expressed as a percentage (also including the rAPTw value of healthy tissue), it can be supposed that this parameter may provide a greater standardization and a more intuitive cutoff. Additionally, although there was no significant difference in AUC values between rAPTw and PI-RADS v2.1 scores, rAPTw value may have an advantage over PI-RADS v2.1 scores in discriminating Pca and chronic inflammation nodule in peripheral zone. For instance, both the PI-RADS v2.1 score of the nodules in Figure.1 and Figure.2 are 4, which was greatly suspected to be a cancer, while the rAPTw value of nodule in Figure.1 was less than the threshold of 1.016, indicating a benign lesion, and the rAPTw value of nodule in Figure.2 was above the threshold of 1.016, indicating a malignant lesion, consistently with pathological results. Therefore, the rAPTw value could help doctors in determining the nature of the nodule in this situation.Conclusion
This study evaluated the correlation between rAPTw and PI-RADS v2.1 score on the differentiation of prostate cancer. The results showed that rAPTw values could be used for differentiating prostate benign and malignant nodules as an endogenous biomarker, and its diagnostic efficacy is similar to PI-RADS v2.1 score.Acknowledgements
I would like to express my gratitude to all those who helped me during the writing of this absract.References
1.Fitzmaurice, C., et al., Global, Regional, and National Cancer Incidence, Mortality, Years of Life Lost, Years Lived With Disability, and Disability-Adjusted Life-years for 32 Cancer Groups, 1990 to 2015. JAMA Oncology, 2017. 3(4): p. 524.
2.Kasivisvanathan, V., et al., MRI-Targeted or Standard Biopsy for Prostate-Cancer Diagnosis. New England Journal of Medicine, 2018. 378(19): p. 1767-1777.
3.Zhou, J., et al., Using the amide proton signals of intracellular proteins and peptides to detect pH effects in MRI. Nature medicine, 2003. 9(8): p. 1085-1090.
4.Zhou, J., et al., Review and consensus recommendations on clinical APT-weighted imaging approaches at 3T: Application to brain tumors. Magnetic Resonance in Medicine, 2022. 88(2): p. 546-574.
5.De Cobelli, F., et al., Apparent diffusion coefficient value and ratio as noninvasive potential biomarkers to predict prostate cancer grading: comparison with prostate biopsy and radical prostatectomy specimen. AJR Am J Roentgenol, 2015. 204(3): p. 550-7.
6.Korkmaz, C.G., et al., Molecular cloning and characterization of STAMP2, an androgen-regulated six transmembrane protein that is overexpressed in prostate cancer. Oncogene, 2005. 24(31): p. 4934-45.
7.Yang,
G., et al., Caveolin-1 expression in clinically confined human prostate cancer:
a novel prognostic marker. Cancer Res, 1999. 59(22): p. 5719-23.
Figures