0308
Optimizing Deep Brain Grey Matter T1w Imaging at 0.5T
Andrew T Curtis1, Sofia Chavez1, and Jeff Stainsby1
1Research & Development, Synaptive Medical, Toronto, ON, Canada
1Research & Development, Synaptive Medical, Toronto, ON, Canada
Synopsis
Keywords: Low-Field MRI, Tissue Characterization
We report on protocol optimizations to produce white matter nulled images as well as to optimize visualization of subcortical structures. Quantitative T1 mapping of brain tissue at 0.5T estimated the T1 of white and grey matter as 510 and 760 ms respectively. From this an MPRAGE protocol with optimal subcortical matter contrast was found with TI=415ms. Deep brain grey/white matter visualization can be improved with a white matter nulled protocol using TI=250ms.Introduction
Due to difficulty visualizing certain deep brain structures on typical T1-weighted (T1w) MPRAGE anatomical scans, new T1w methods have been proposed recently. Methods like FGATIR[1] and FLAWS [2] are essentially re-tuning of the more typical T1w MPRAGE inversion times to null white matter (WM) and help visualize the borders of deep grey matter (GM) structures. To the best of our knowledge, optimal protocols with inversion schemes like this have not been proposed for mid field scanners where the T1 times are significantly shorter and more distinct across structures. We report on a protocol optimization driven by quantitative T1 mapping to produce WM nulled images as well as to optimize signal contrast of subcortical GM structures that are otherwise difficult to delineate in regular MPRAGE images. We targeted the following basal ganglia: thalamus, globus pallidus (GP), putamen, as well as the substantia nigra (SN). A longer inversion time (TI) than that which nulls WM signal produced significantly increased contrast for these deep brain regions.Methods
All imaging was performed on a 0.5T head-only small footprint MRI (Synaptive Medical, Toronto, Canada). Scanning of three human volunteers was performed with informed consent provided. Few T1 values have been reported around 0.5T [3,4], so parameter mapping was performed to guide protocolling. A variable flip angle (VFA [5]) T1 mapping scheme was used. Briefly, four 3D SPGR volumes were acquired in a sagittal orientation at 1 mm isotropic resolution with α={5°,15°,25°,35°}. A 3D B1 map was also acquired using a Bloch-Siegert B1 mapping method [6] to scale flip angles in the VFA analysis. ROI analysis of aggregate T1 values was then performed using Freesurfer[7], based on segmenting the 25° SPGR volume. The results of T1 mapping were used to simulate MPRAGE volumes and identify inversion times for targeted contrast, with TI ~ 415 ms appearing optimal to generate peak contrast in subcortical GM structures, whereas a shorter TI ~250 ms was predicted to null WM signal and produce maximized GM/WM contrast, similar to FGATIR, and useful to differentiate GM-WM boundaries. Two Sagittal MPRAGE-like scans were then performed with TIs 250 ms and 415 ms, with other parameters as follows: 1x1x1mm3 resolution, α :8.5°, hard pulse excitation, BW: 40 kHz, TR: 7.5 ms, ETL: 100, IR-IR TR: 1.6 s, centric radially binned phase encode ordering, corner cutting, and 1.4X phase oversampling for a partial averaging effect, total scan time 12 minutes.Results
Sample whole-brain T1 and M0 maps from the VFA fit are shown in Figure 1. B1+ maps (not shown) were very flat as expected at mid field. For our brain structures of interest, ROI analysis yielded average T1 values (see Figure 2). Simulations of potential IR-SPGR contrast generated from the T1 and M0 maps are displayed for different inversion times in Figure 3, providing additional guidance for protocolling. WM-nulled equivalent contrast was predicted at TI ~250 ms, given the IR-to-IR TR of 1.6s. Interestingly, T1 data suggests 415 ms as a reasonable inversion time to optimize absolute contrast between deep brain structures and their surrounding white matter, specifically the putamen, GP, thalamus and SN. MPRAGE images with these TIs are displayed in Figure 4.Discussion
In this work, measurement of T1 differences across brain structures lead to straight forward protocol optimization, yielding both FGATIR-like WM nulling scans, as well as higher contrast intermediate TI image sets. Due to the overall shorter T1s at 0.5T, the early TI time of 250ms was necessary to null WM, and could have utility especially when certain WM-GM borders are useful for structure identification or segmentation. When imaging such short T1s, one must be concerned with long readout trains sampling along a steep recovery curve, and any potential zero crossing of magnetization from low to high k-space. These effects induce artifacts in high frequency edges and blurring from the signal apodization. This is combatted mainly by limiting the MPRAGE “echo train” length and having enough shots that the centric phase encoding reaches the periphery relatively quickly. We were quite interested in the finding that protocolling a WM-nulling approach may not be optimal for deep brain contrast, where the intermediate TI’s yielded significantly more absolute signal differences between regions like the GP, Putamen, SN, and their surrounding white matter. This is suggestive of improved protocols if those regions are to be targeted. This difference in ‘optimal’ TI time is also a result of the greater spread of T1 values between tissues at 21 MHz. While low polarization is a concern for any high-resolution scans at lower field strengths, the raw contrast derived from the T1 differences makes these applications remarkably tractable. Contrast to noise is further aided by the shorter overall T1s resulting in more magnetization regrowth during the MPRAGE dead times.Conclusion
By taking a data driven approach, we have demonstrated several options for optimized deep brain anatomical contrast at 0.5T, in reasonable acquisition times for surgical planning applications. Nulling white matter does not necessarily maximize subcortical structure contrast which can be achieved by intermediate TI times.Acknowledgements
No acknowledgement found.References
- Sudhyadhom et al, NeuroImage, 2009
- Tanner et al, JMRI, 2012
- Imran et al, Magn Reson Imag, 1999
- Campbell-Washburn et al, Radiol, 2019
- HZ Wang et al, Magn Reson Med, 1987
- Sacolick et al, Magn Reson Med, 2010
- Fischl et al., Neuron, 2002
Figures
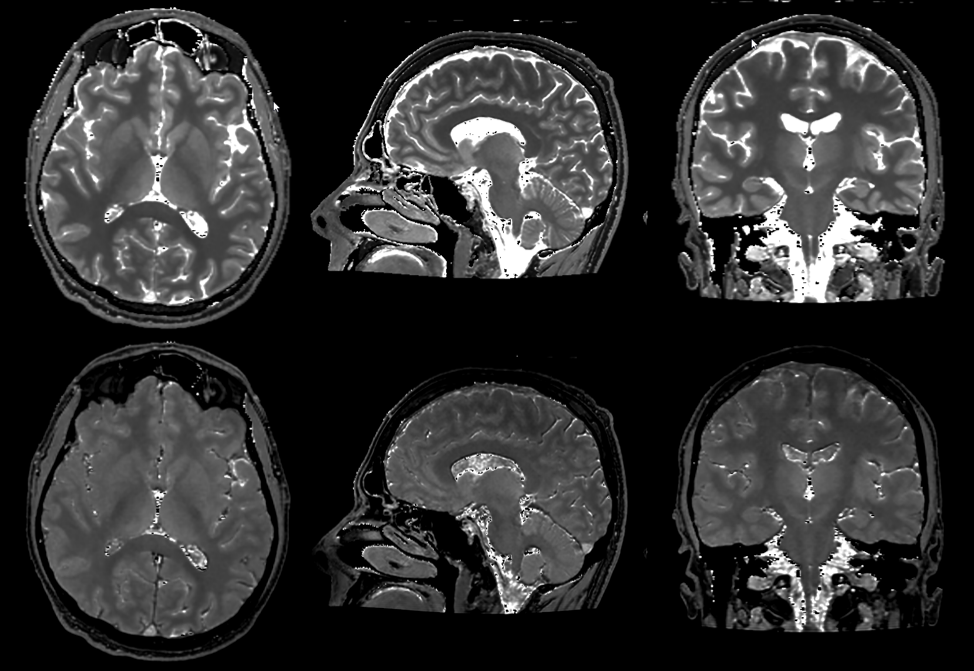
Figure 1: representative T1 (top row) and M0 (bottom row) maps from VFA fitting.
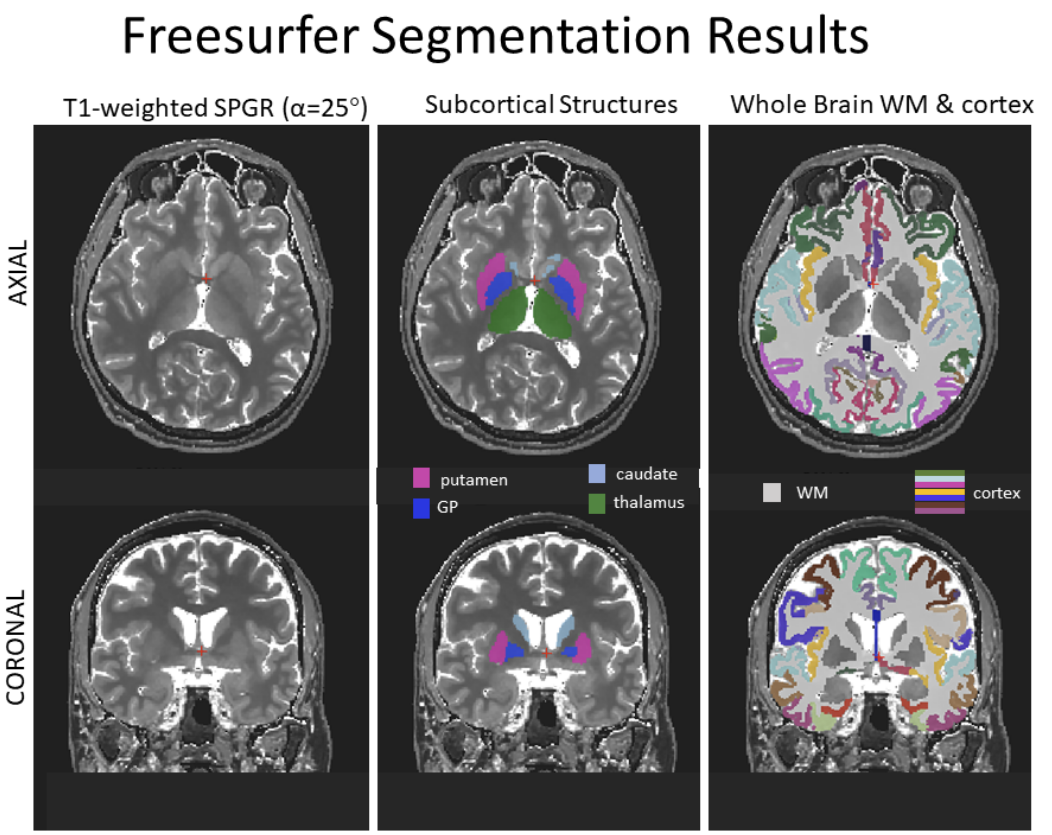
Figure 2: Freesurfer Segmentation results are shown on Subject #1. The T1w SPGR image with α=25° was used. ROIs correspond to Table 1.
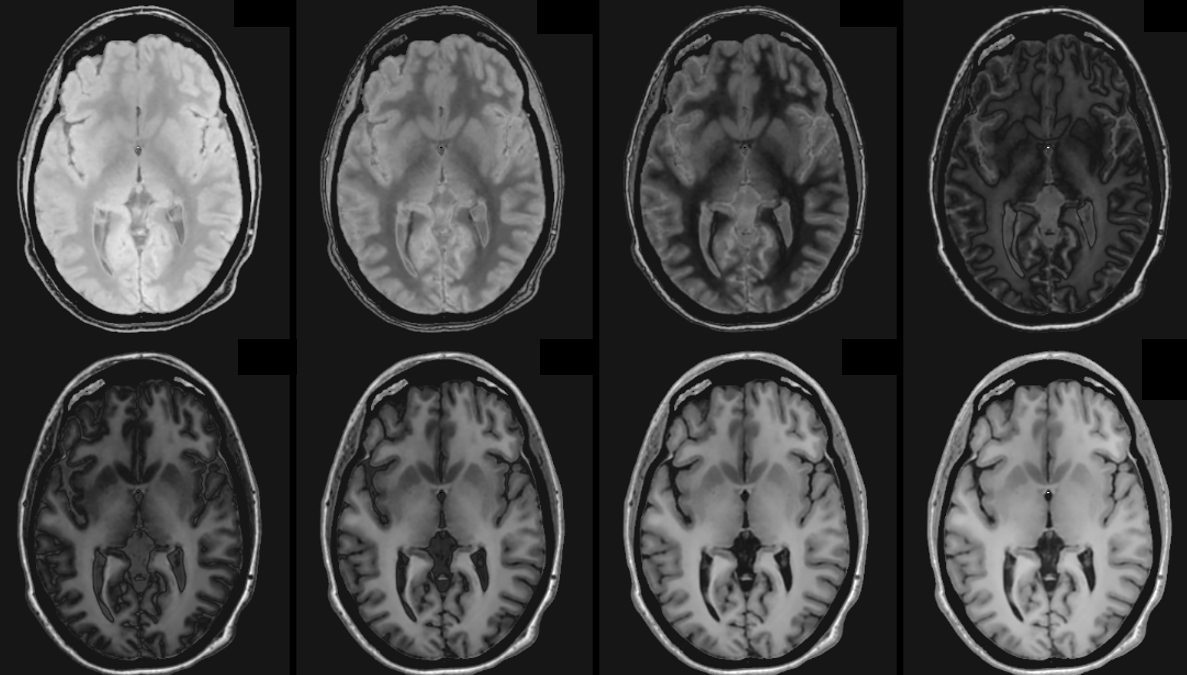
Figure 3: Simulated IR-spgr images with inversion times 50, 150, 250, …, 950 ms.
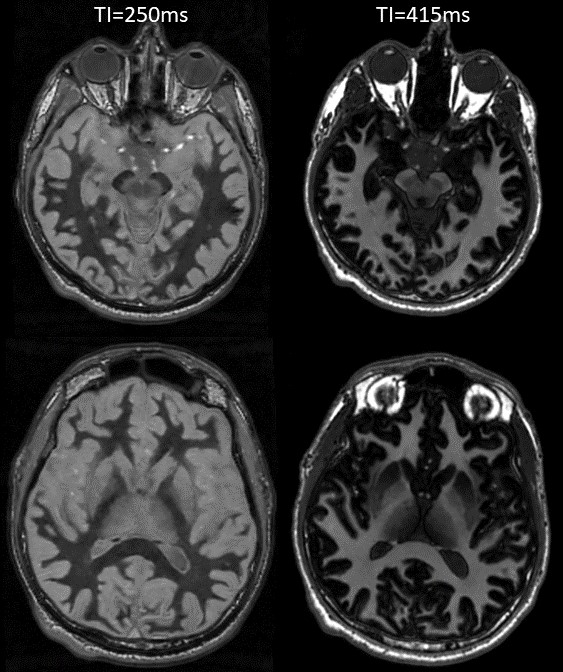
Figure 4, 3d T1 MPRAGE with (left) TI=250 ms WM Null contrast, and (right) TI=415 ms.
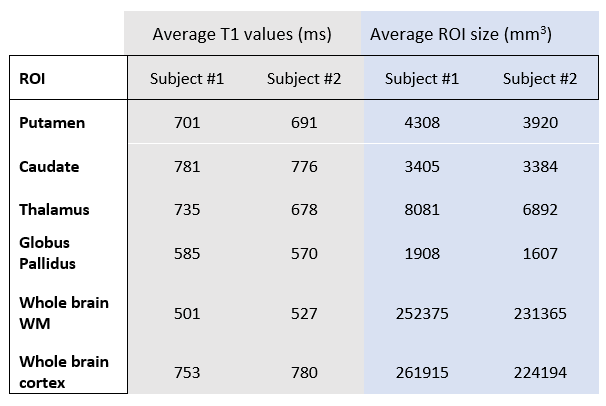
Table 1: ROI average T1 values in selected brain structures in two volunteers.
DOI: https://doi.org/10.58530/2023/0308