0300
T1ρ and magnetization transfer experiments on a point-of-care 46 mT MRI system1Leids Universitair Medisch Centrum, Leiden, Netherlands
Synopsis
Keywords: Low-Field MRI, RF Pulse Design & Fields, Saturation RF pulses
Contrast mechanisms such as T1ρ and MT are interesting for point-of-care (POC) low field systems, to supplement/augment standard T1- and T2- weighting. However they typically require high B0 homogeneity. Here, we use a high homogeneity Halbach-magnet array POC to perform experiments involving either direct on- or off-resonance pulses, and to calculate T1ρ and MT ratio in tissue-mimicking phantoms. T1ρ showed different white matter (WM)/gray matter (GM) contrast compared to T2. The measured magnetization transfer ratio (MTR) showed higher values in the WM than in the GM.Introduction
Point-of-care (POC) MRI has a number of advantages including portability, accessibility and reduced financial costs1, but the magnet intrinsically has a much larger inhomogeneity than clinical systems due to the reduced dimensions. Since obtaining T1 and T2 contrast in the brain is challenging at ultralow field (<0.1T)2, it is interesting to study other mechanisms such as T1ρ and magnetization transfer (MT). T1ρ reflects low-frequency motional processes and could be particularly suited for ultralow field strengths without the SNR penalty of direct measurements at this field. Long on-resonance RF pulses applied after excitation lock the spins, slowing the relaxation process which is determined by T1ρ3. In MT, off-resonance pulses applied before a standard imaging sequence selectively saturate the pool of protons bound to macromolecules, affecting tissue contrast via transfer of magnetization4. Sensitivity to macromolecules such as myelin could improve pathologic specificity in white matter over conventional MRI sequences5.Both spin-locking and MT require relatively high B0 homogeneity for accurate on-resonance and off-resonance (without direct saturation) measurements. Their potential to manipulate tissue contrast for POC imaging has not yet been fully characterized. In this study, we employ a Halbach-magnet array POC system to explore T1ρ and MT in tissue-mimicking phantoms.
Methods
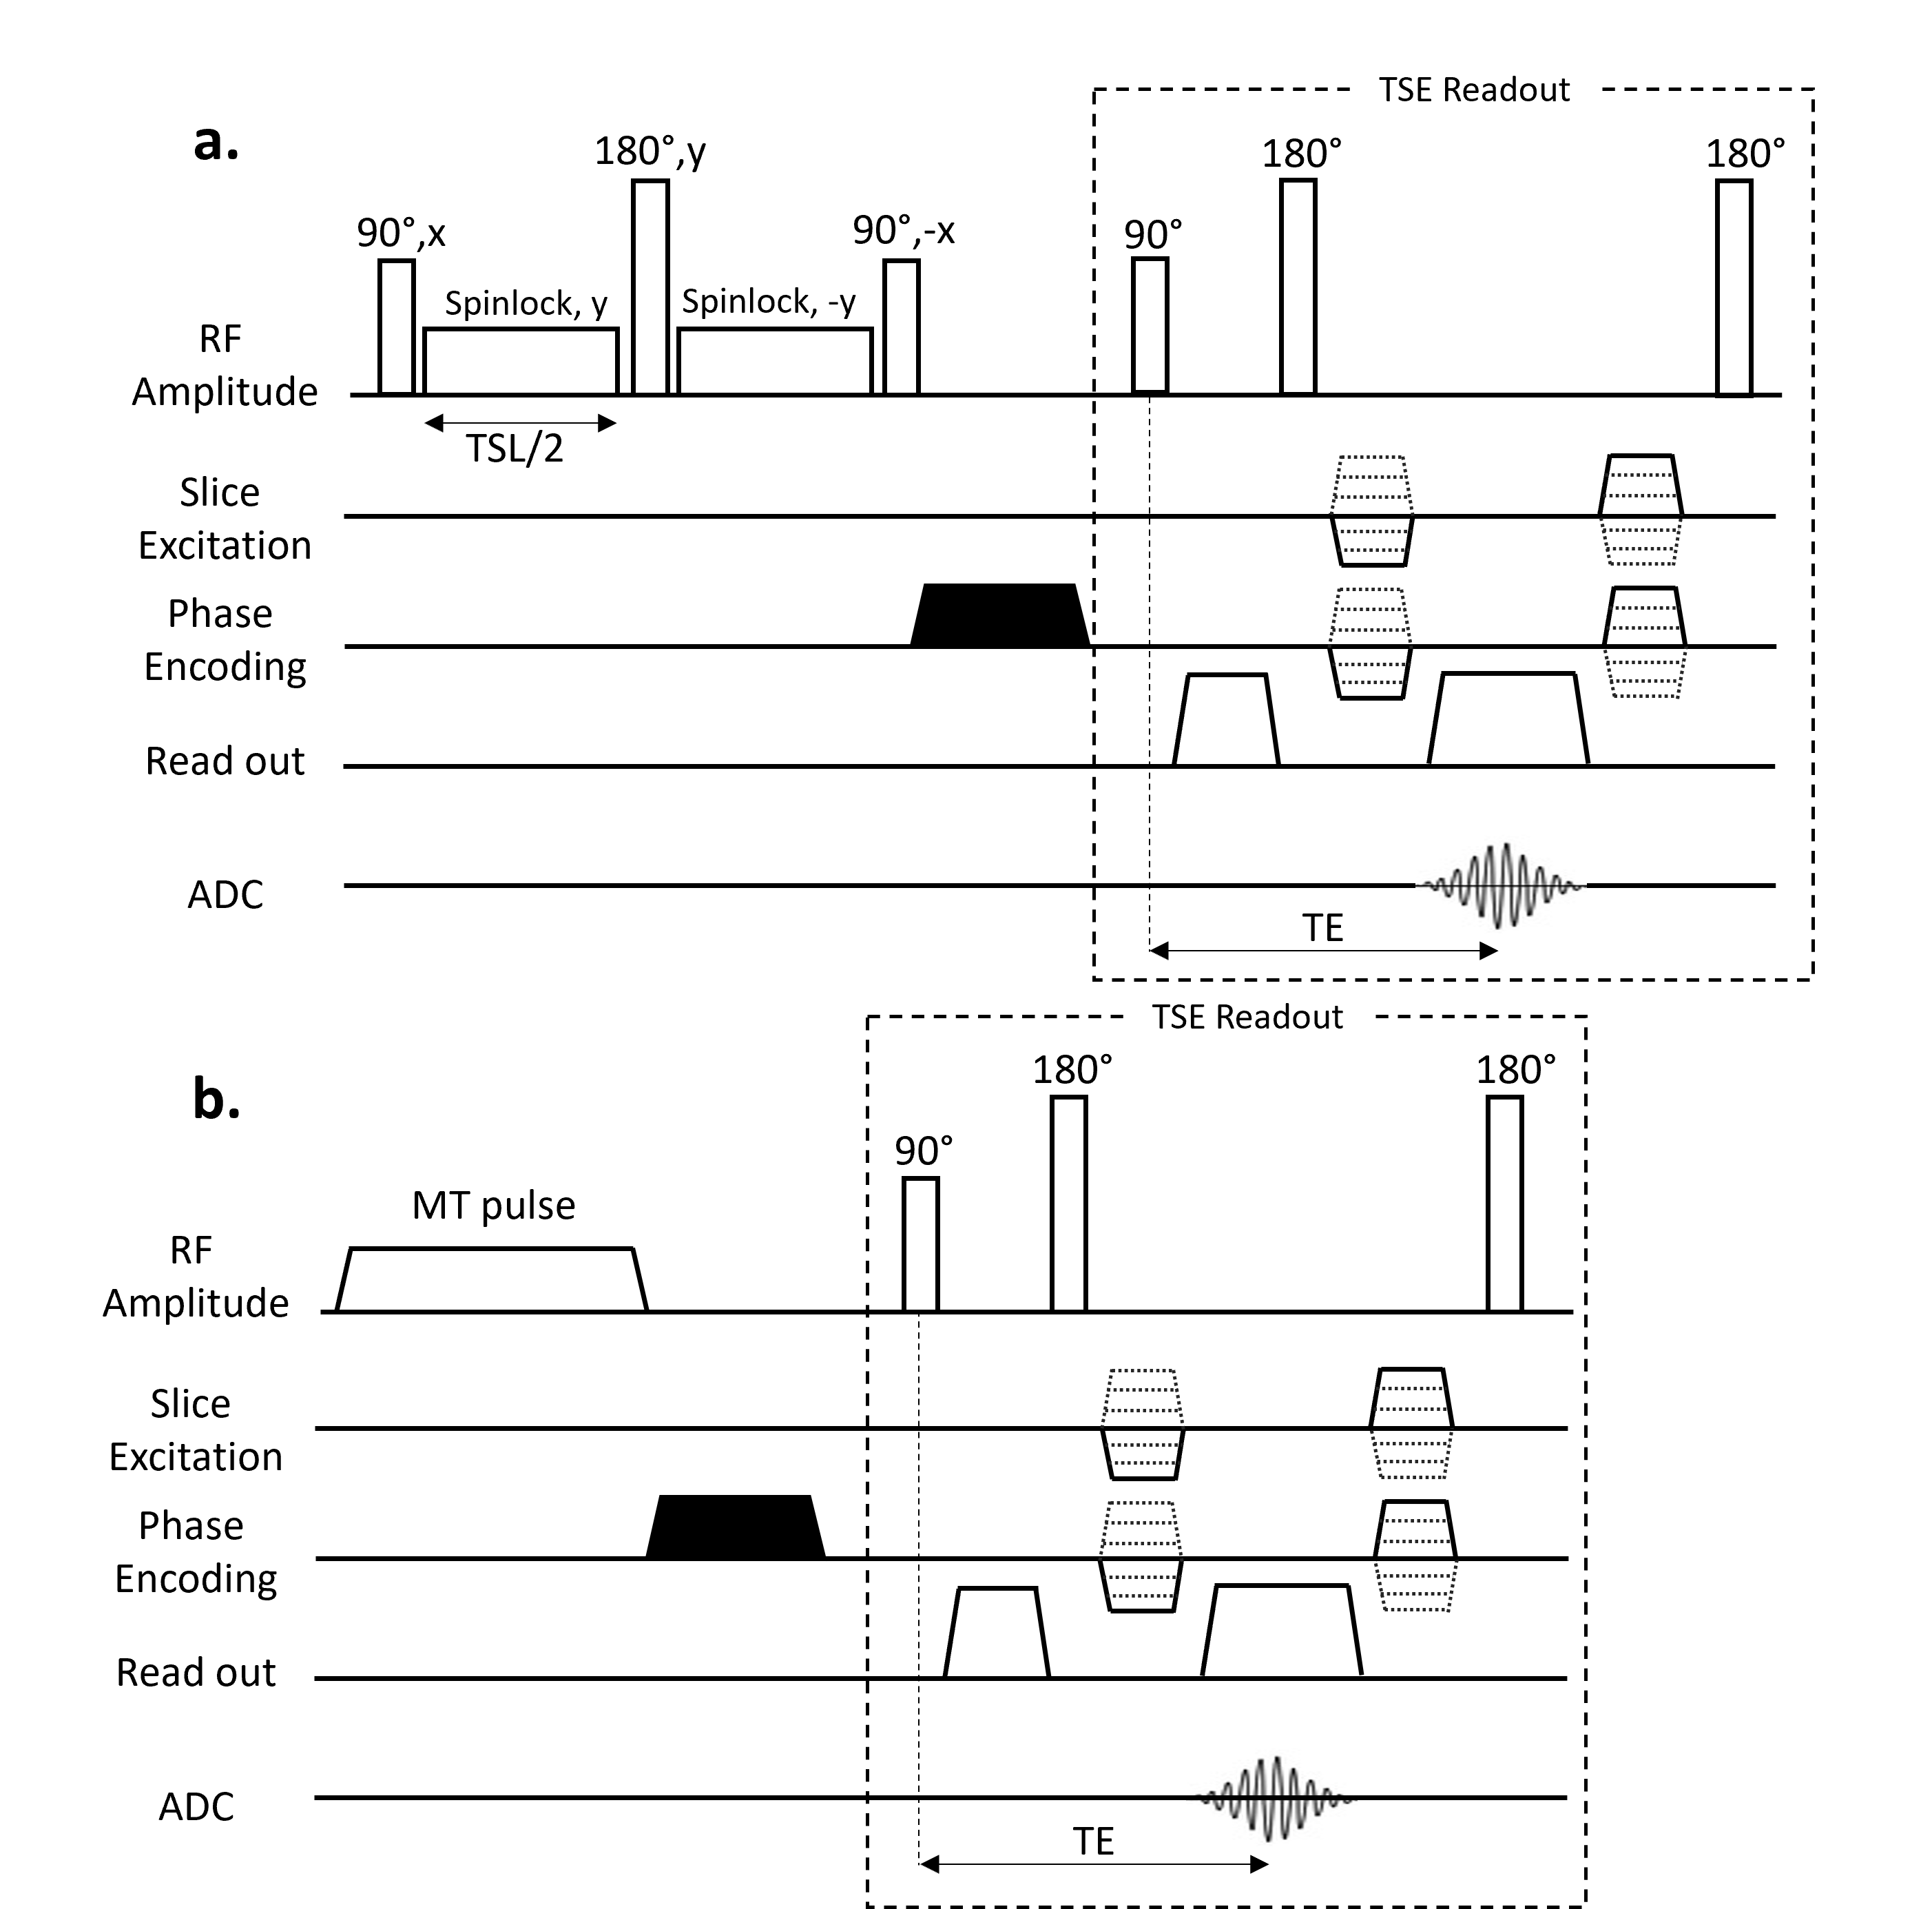
Images were obtained using a 46 mT Halbach-magnet based MRI system using a Magritek Kea2 spectrometer6. For both spin-lock and MT experiments, after magnetization preparation, a 3D turbo spin-echo (TSE) readout was used, with the following parameters: TR/TE: 1250/20 ms, echo train length: 8, 2x2x10 mm3 resolution, and acquisition bandwidth: 20 kHz.For the spin-lock sequence, a preparatory module (Figure 1a.) was used to minimize both artefacts from B0 and B1 inhomogeneities7. Data were acquired with spin-lock durations ranging from 10-80 ms in steps of 10 ms, and were fitted to a monoexponential model to compute T1ρ maps. T1ρ maps at different spin-lock frequency (fSL) were compared with T2 maps acquired with a conventional variable echo time TSE sequence. The phantoms for this study were a 20-mm thick 3D-printed brain-shaped phantom (termed “brain-T1/T2”) and a tube phantom, filled with agarose, copper sulphate and deuterium oxide water to mimic the relaxation times of white matter (WM), grey matter (GM), cerebrospinal fluid (CSF), fat and muscle at 50 mT2. For the MT study, as low field imaging has fewer issues with specific absorption rate, a hard RF pulse with B1=17 μT and Δν=3 kHz was applied continuously for 80 ms (Figure 1b). The amplitude and frequency offset of the MT pulse were optimized to keep the degree of direct saturation of the free protons pool8 below 10%. To calculate the MT ratio (MTR), two scans were acquired, with and without the MT pulse. In this experiment, the brain-shaped phantom was filled with cross-linked bovine serum albumin (BSA)9 and gelatine (termed “brain-MT”) to mimic the ratio T1/T2 and MTR expected in brain at low MR field. For comparison, the same phantom was scanned with a 3T scanner (Philips Achieva), using a clinical MT sequence (sinc-gauss pulse with B1=12 μT, Δν=3 kHz, MT pulse length=16 ms). To calculate the expected MTR, which depends on the ratio of the square root of T1 and T210, the relaxation times of the phantom were measured at both field strengths.
Results
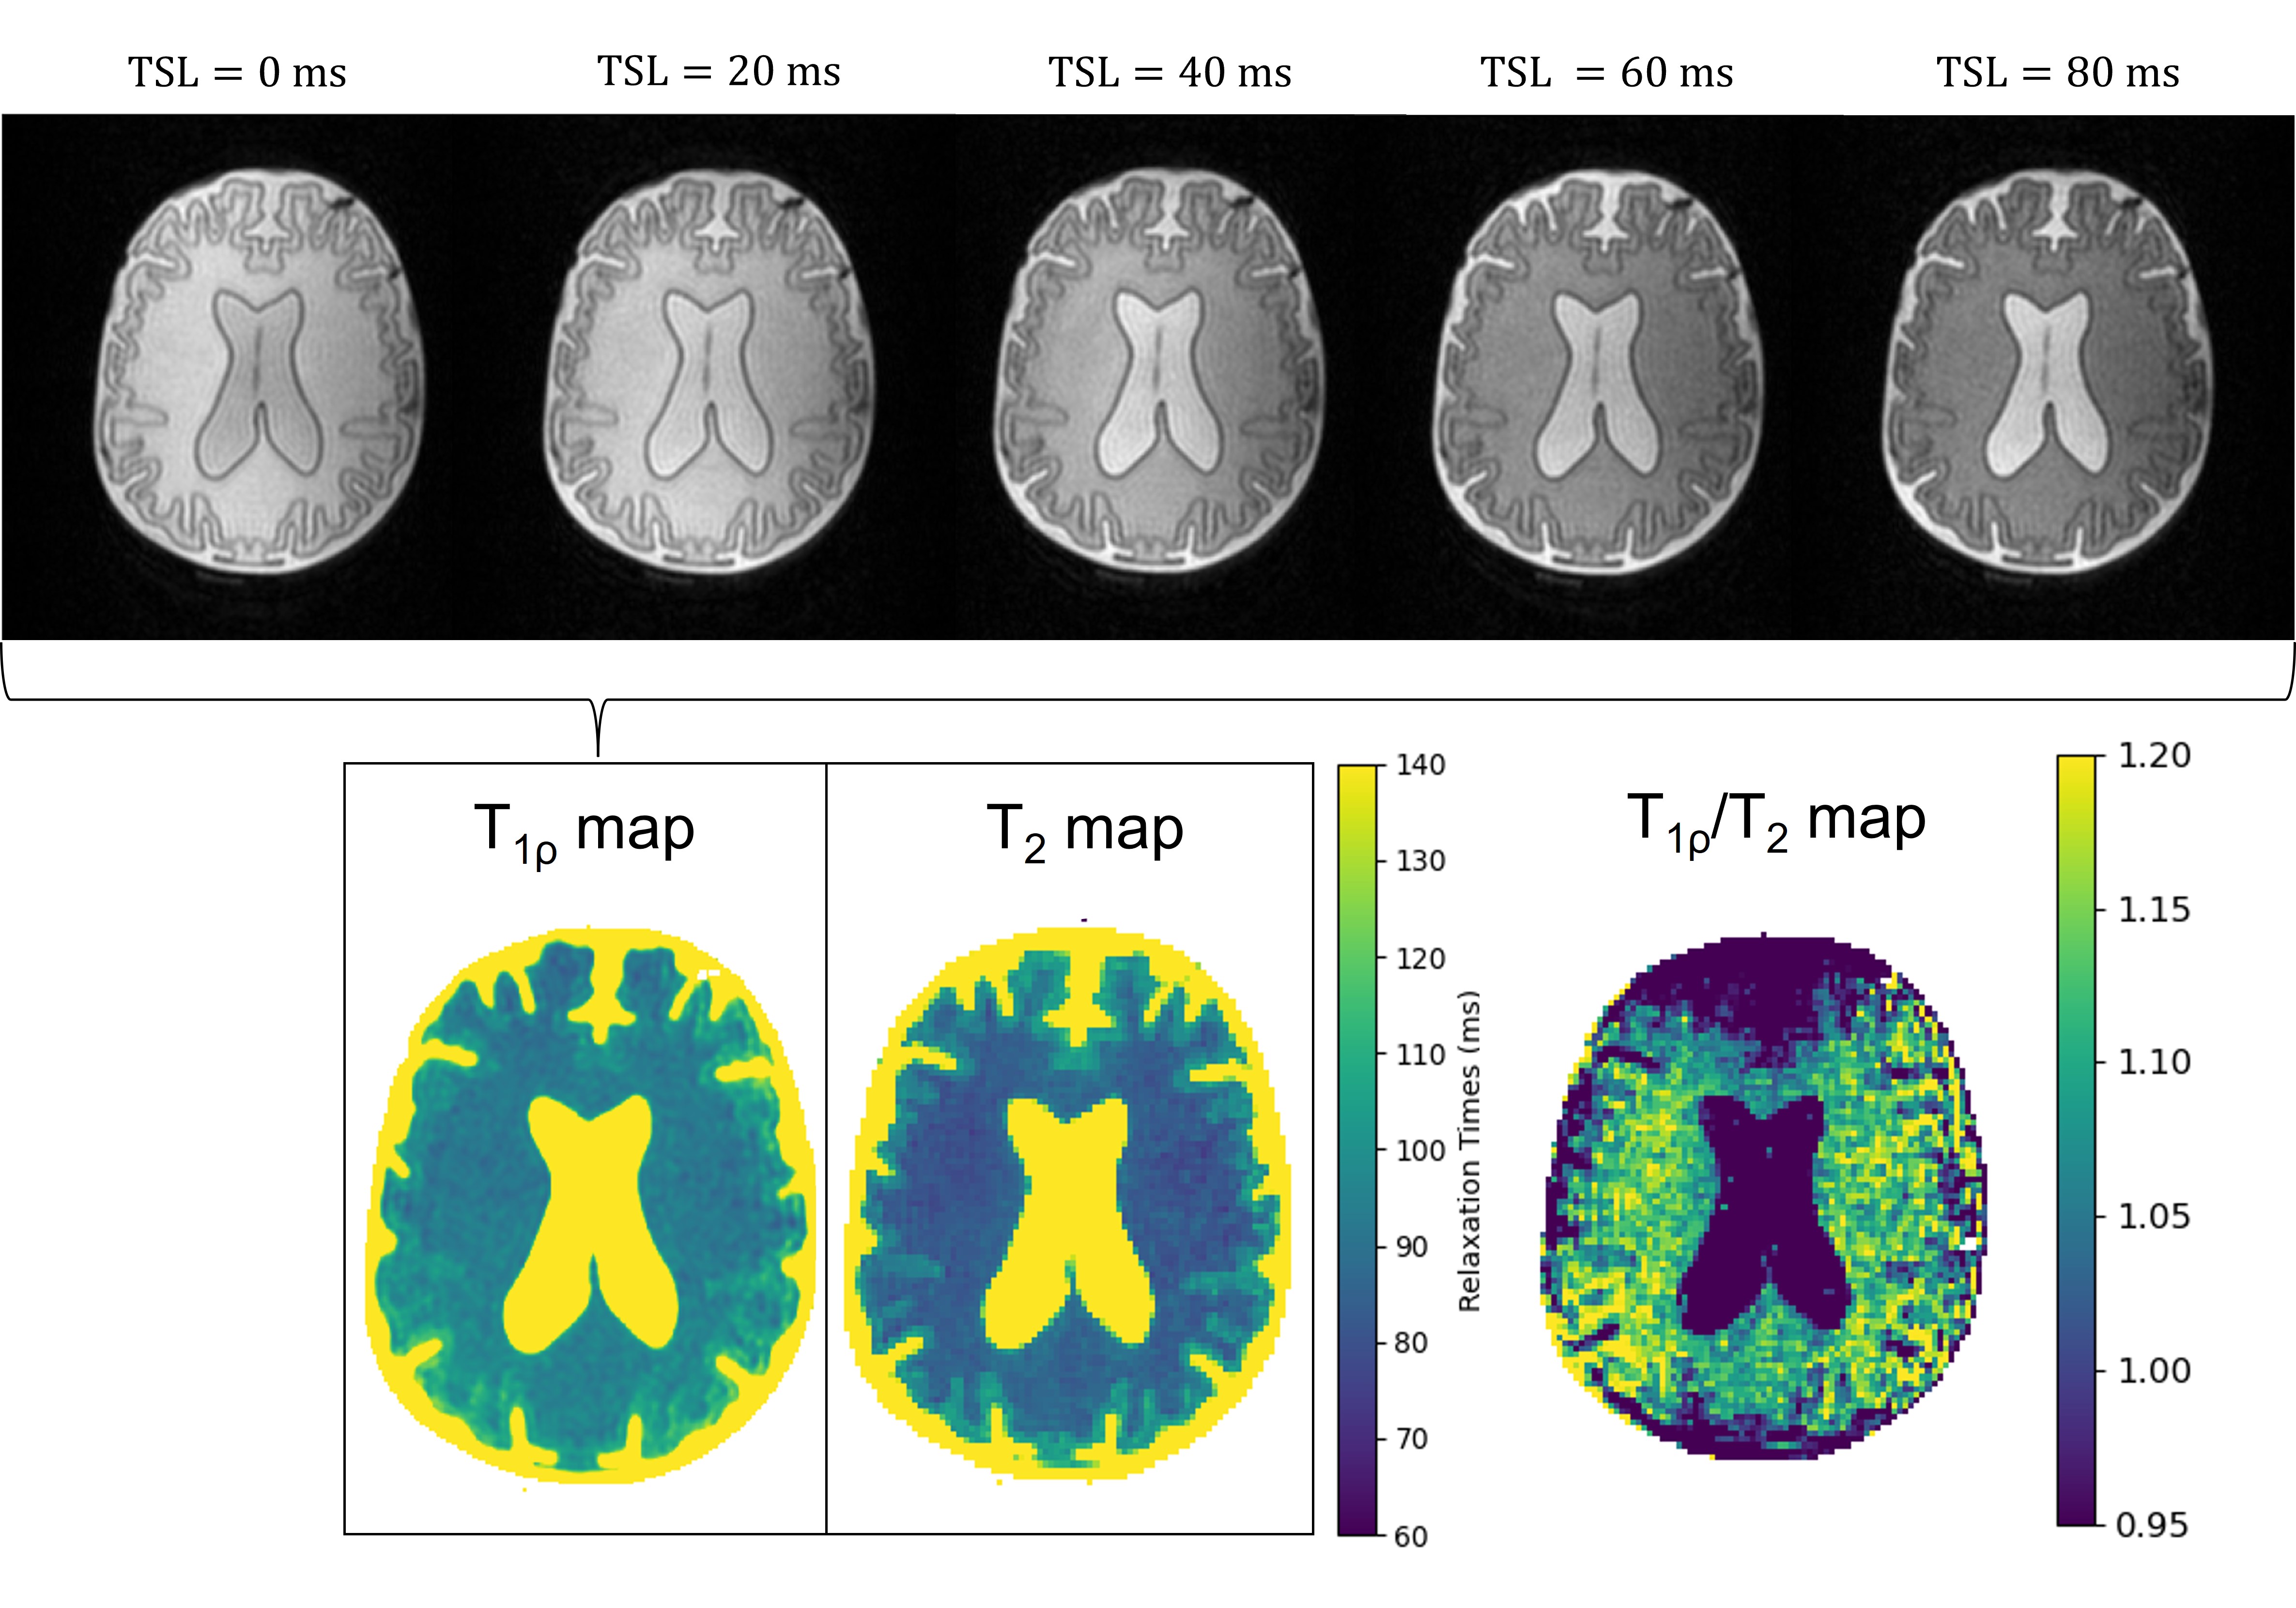
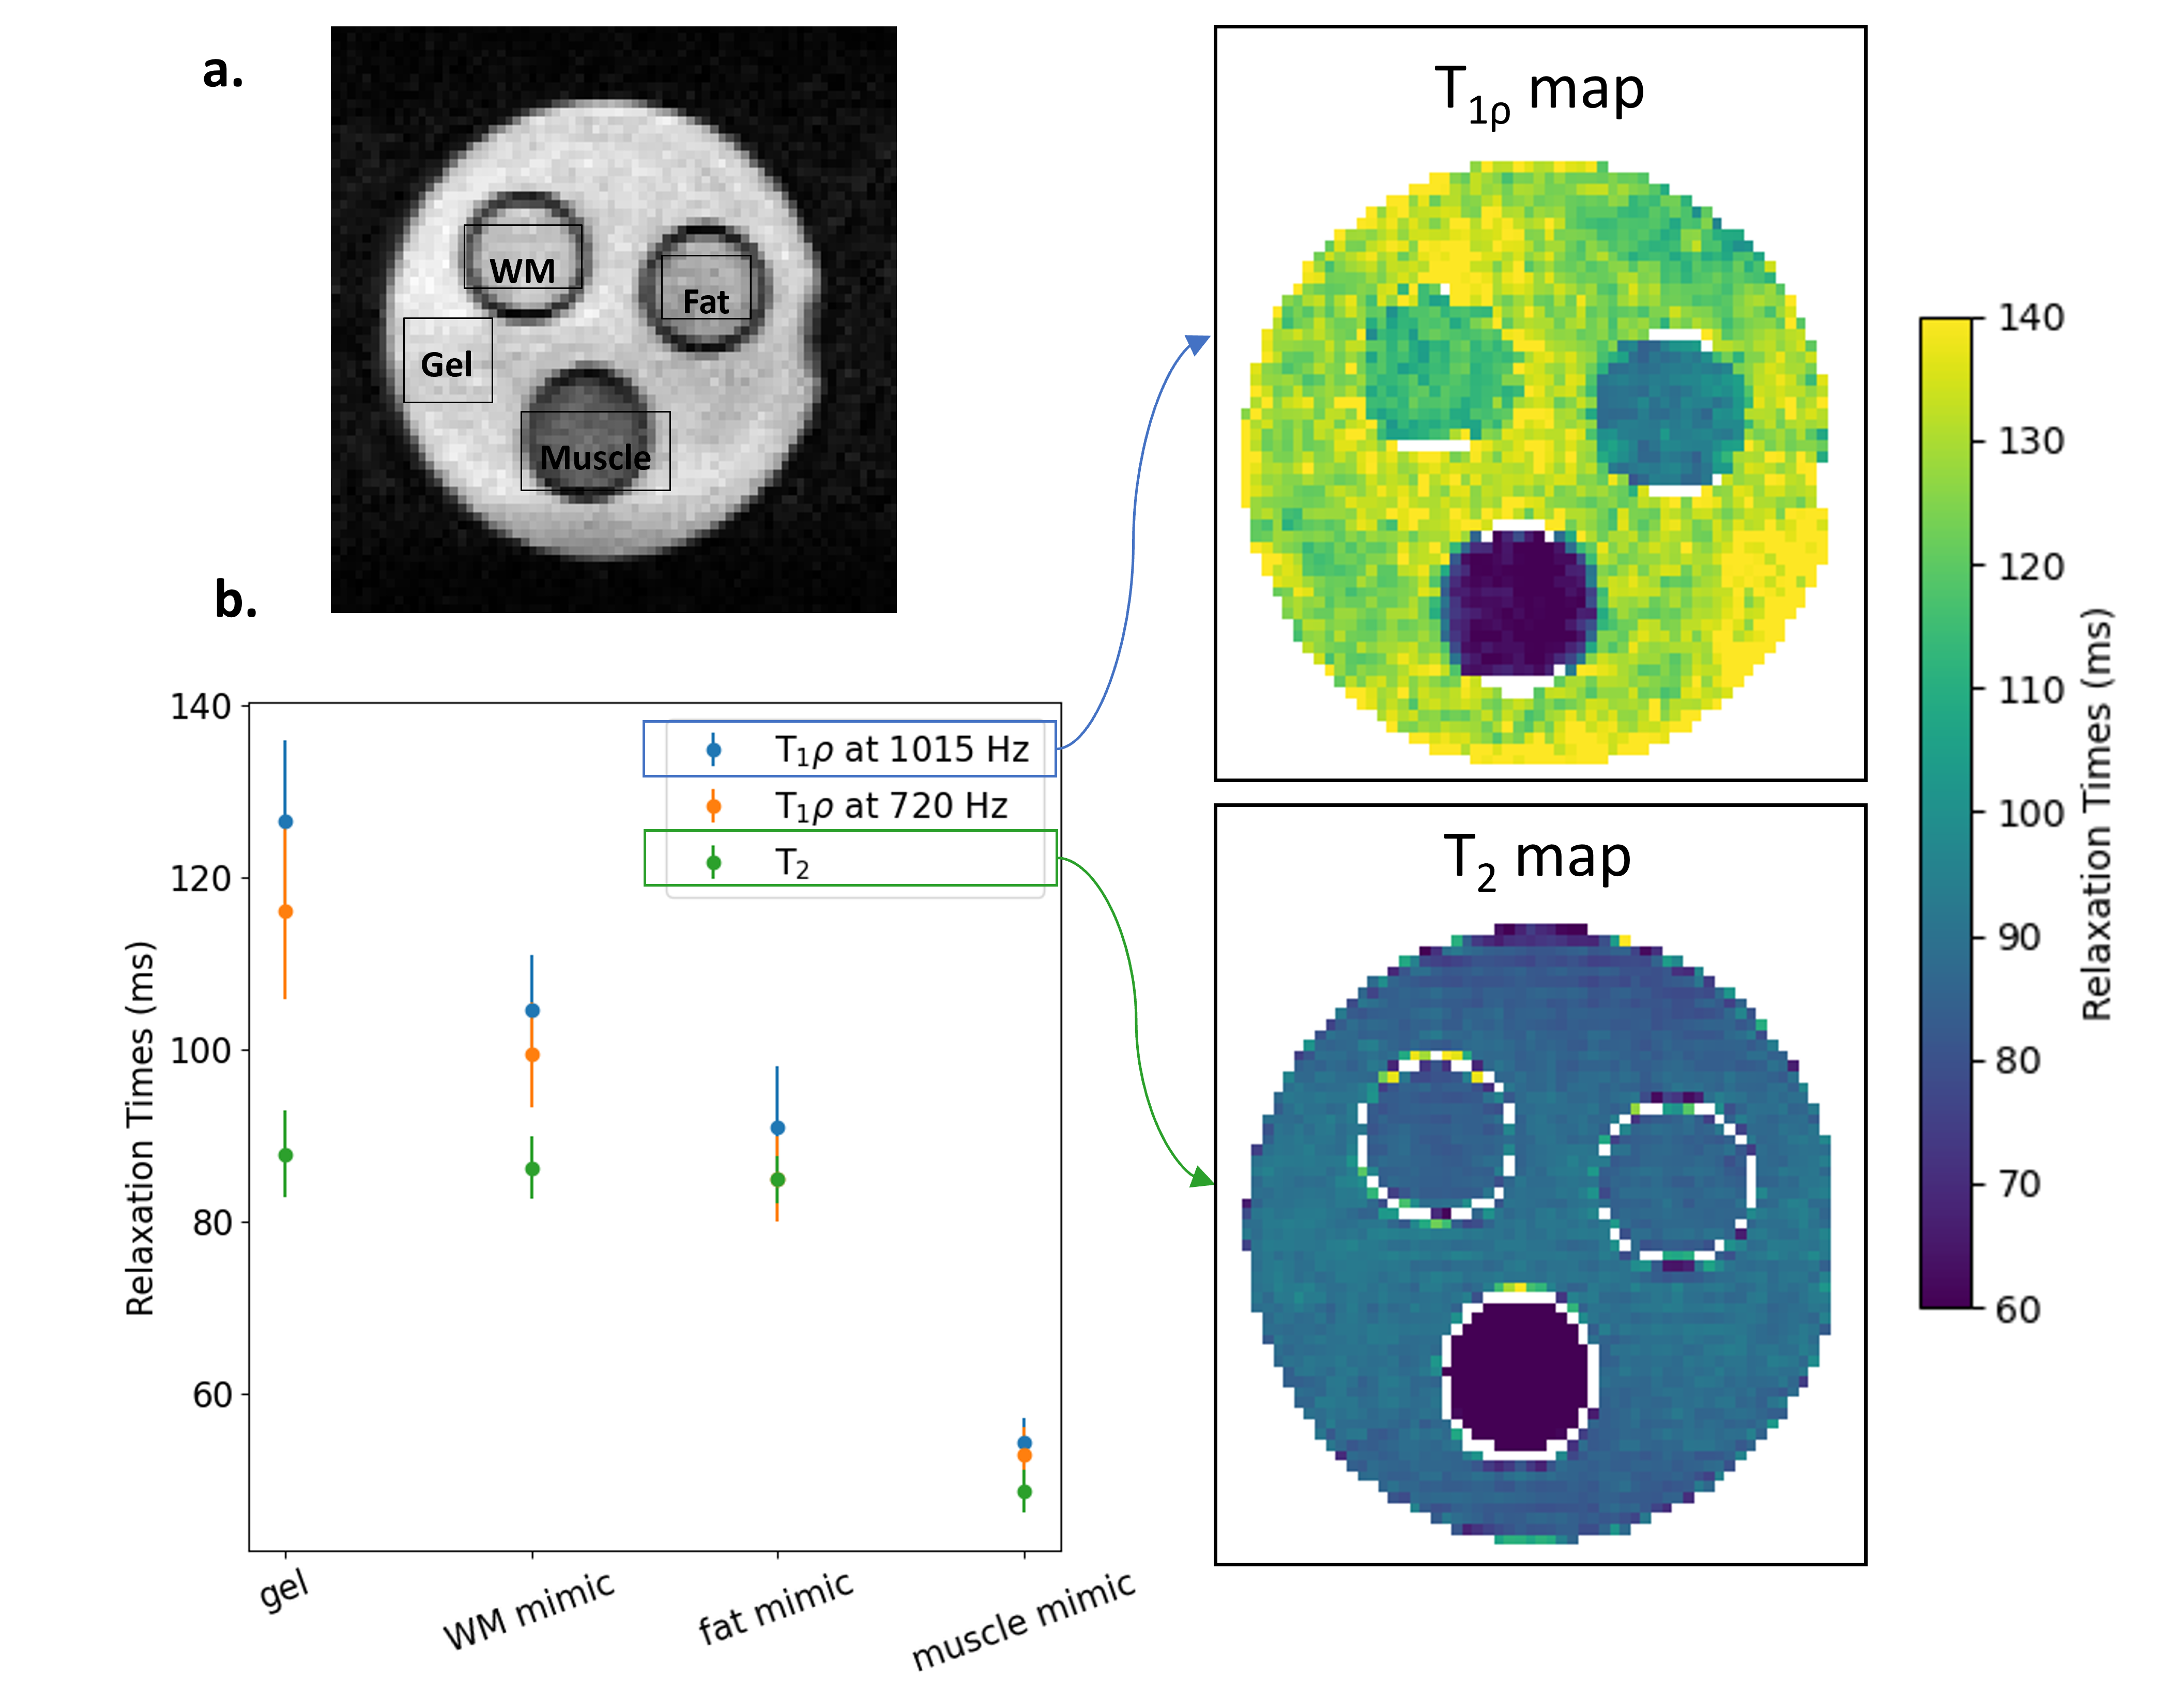
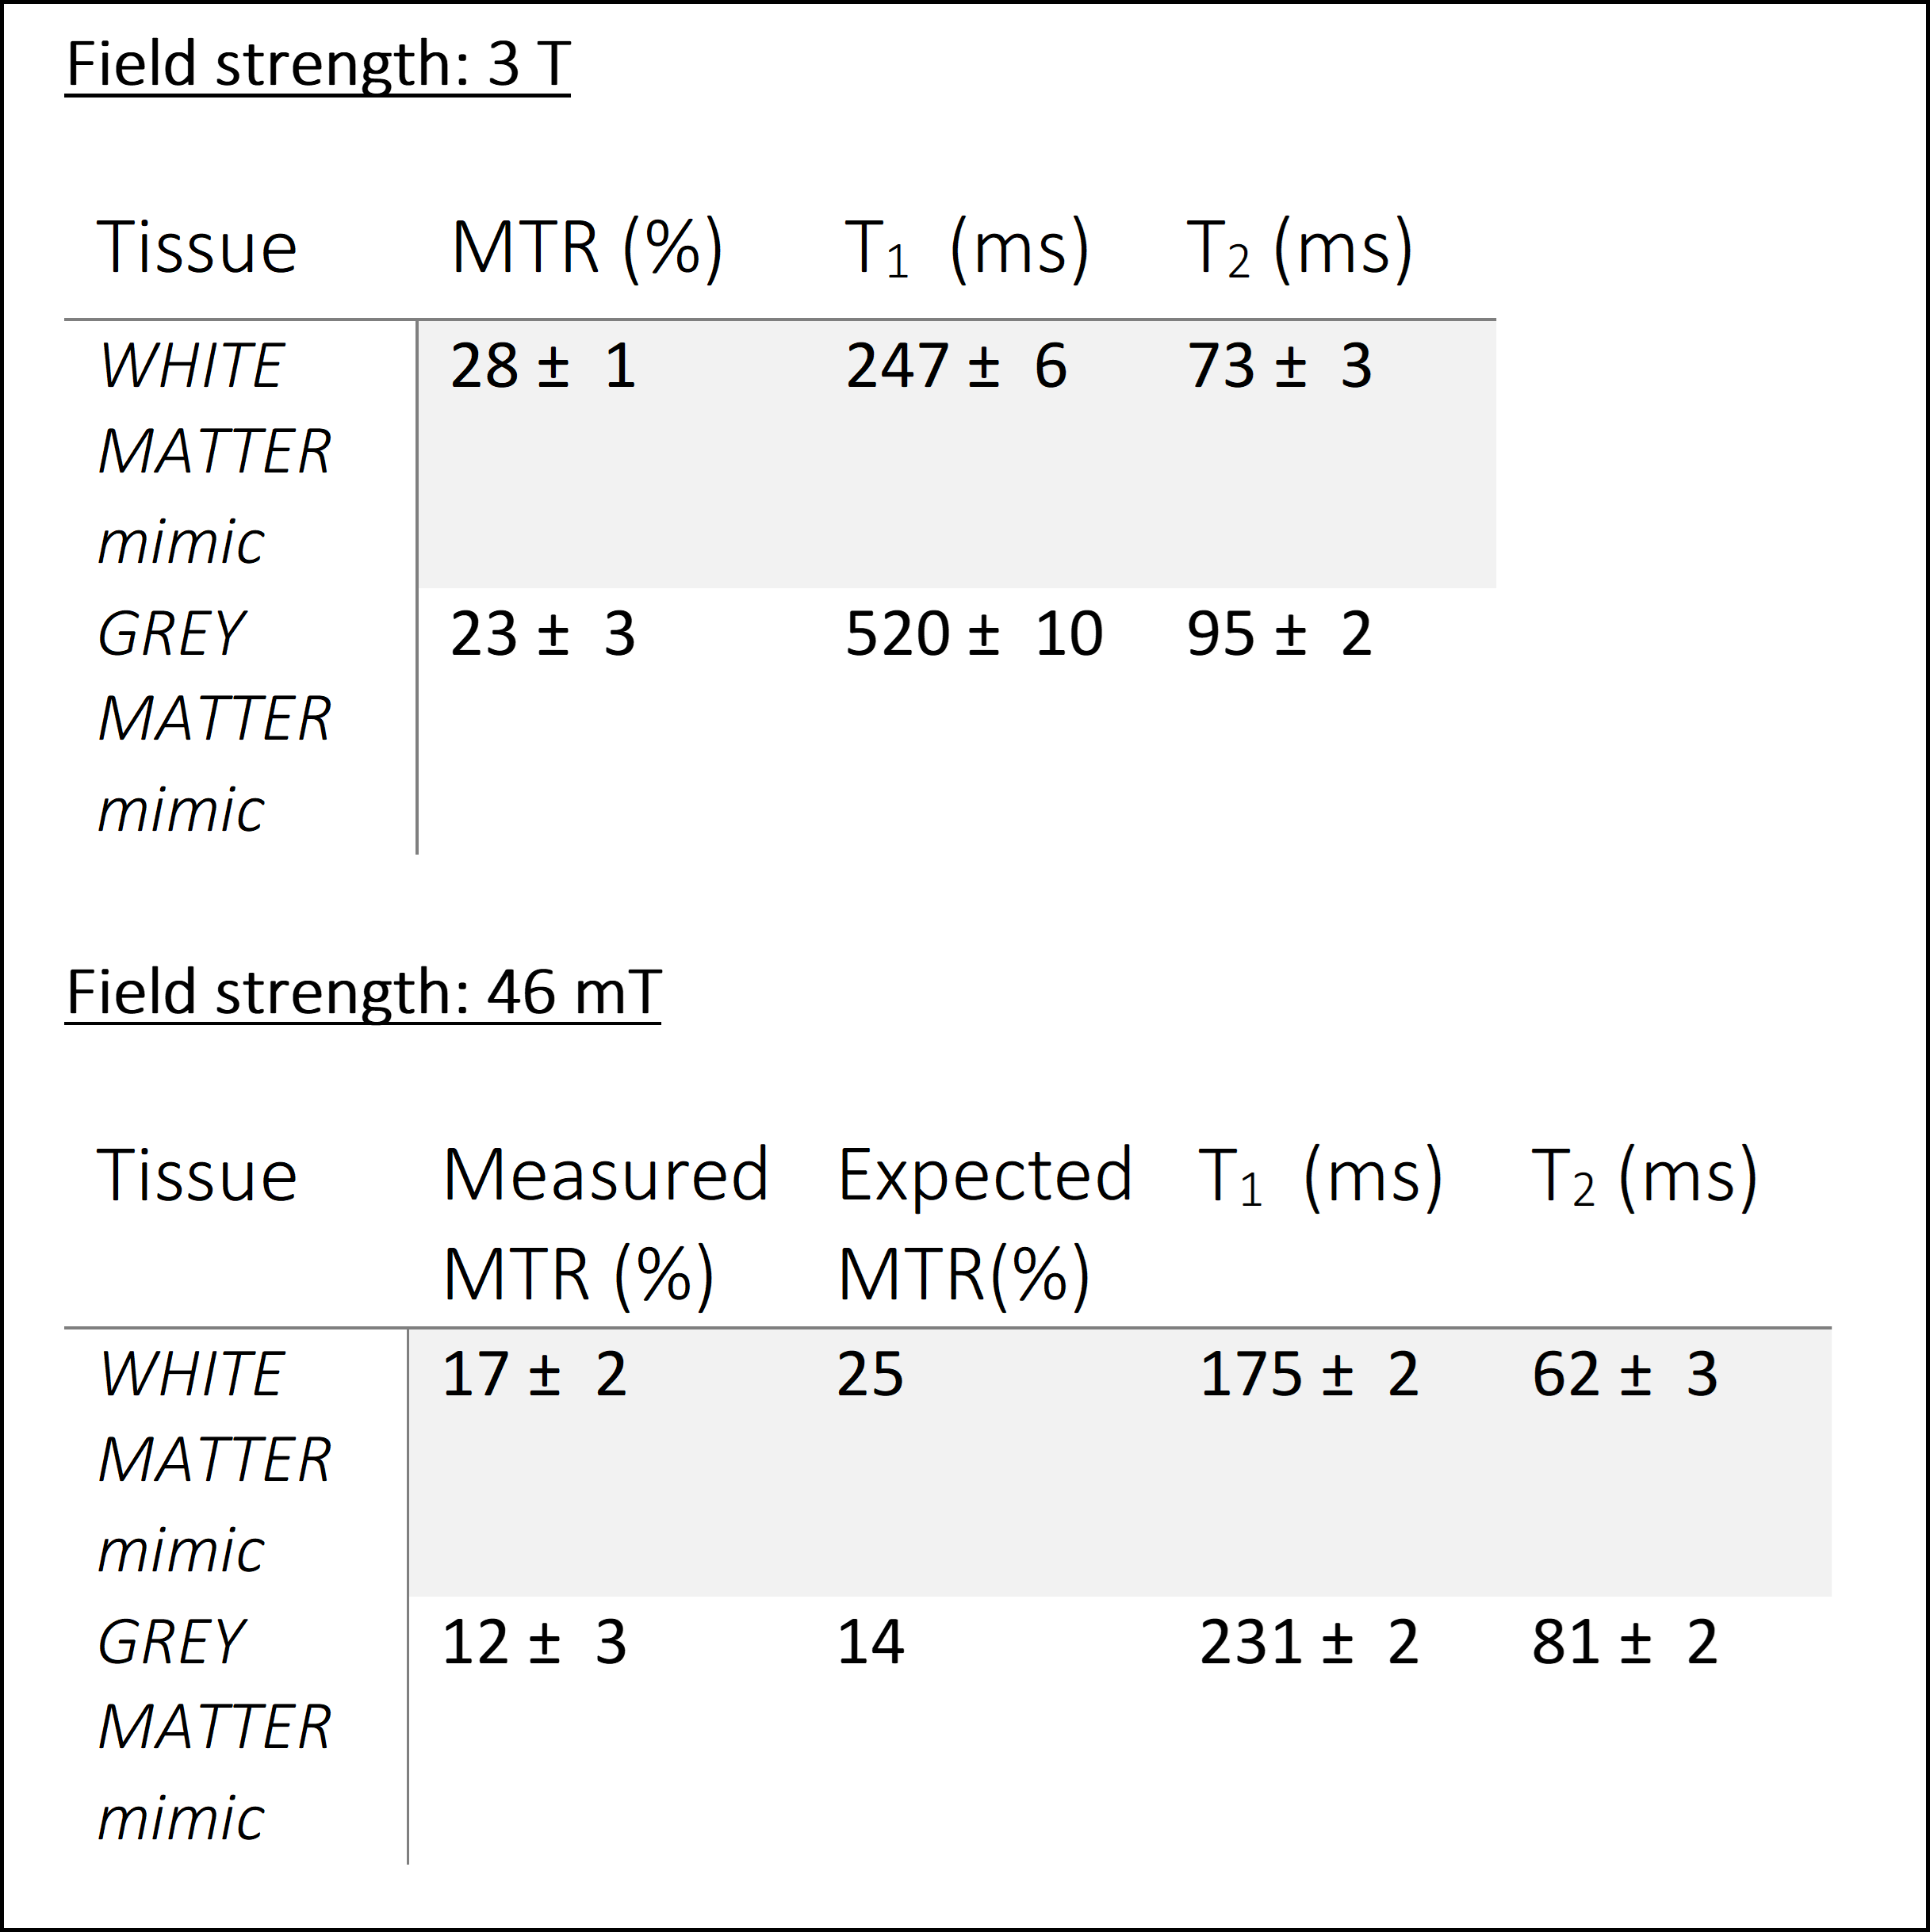
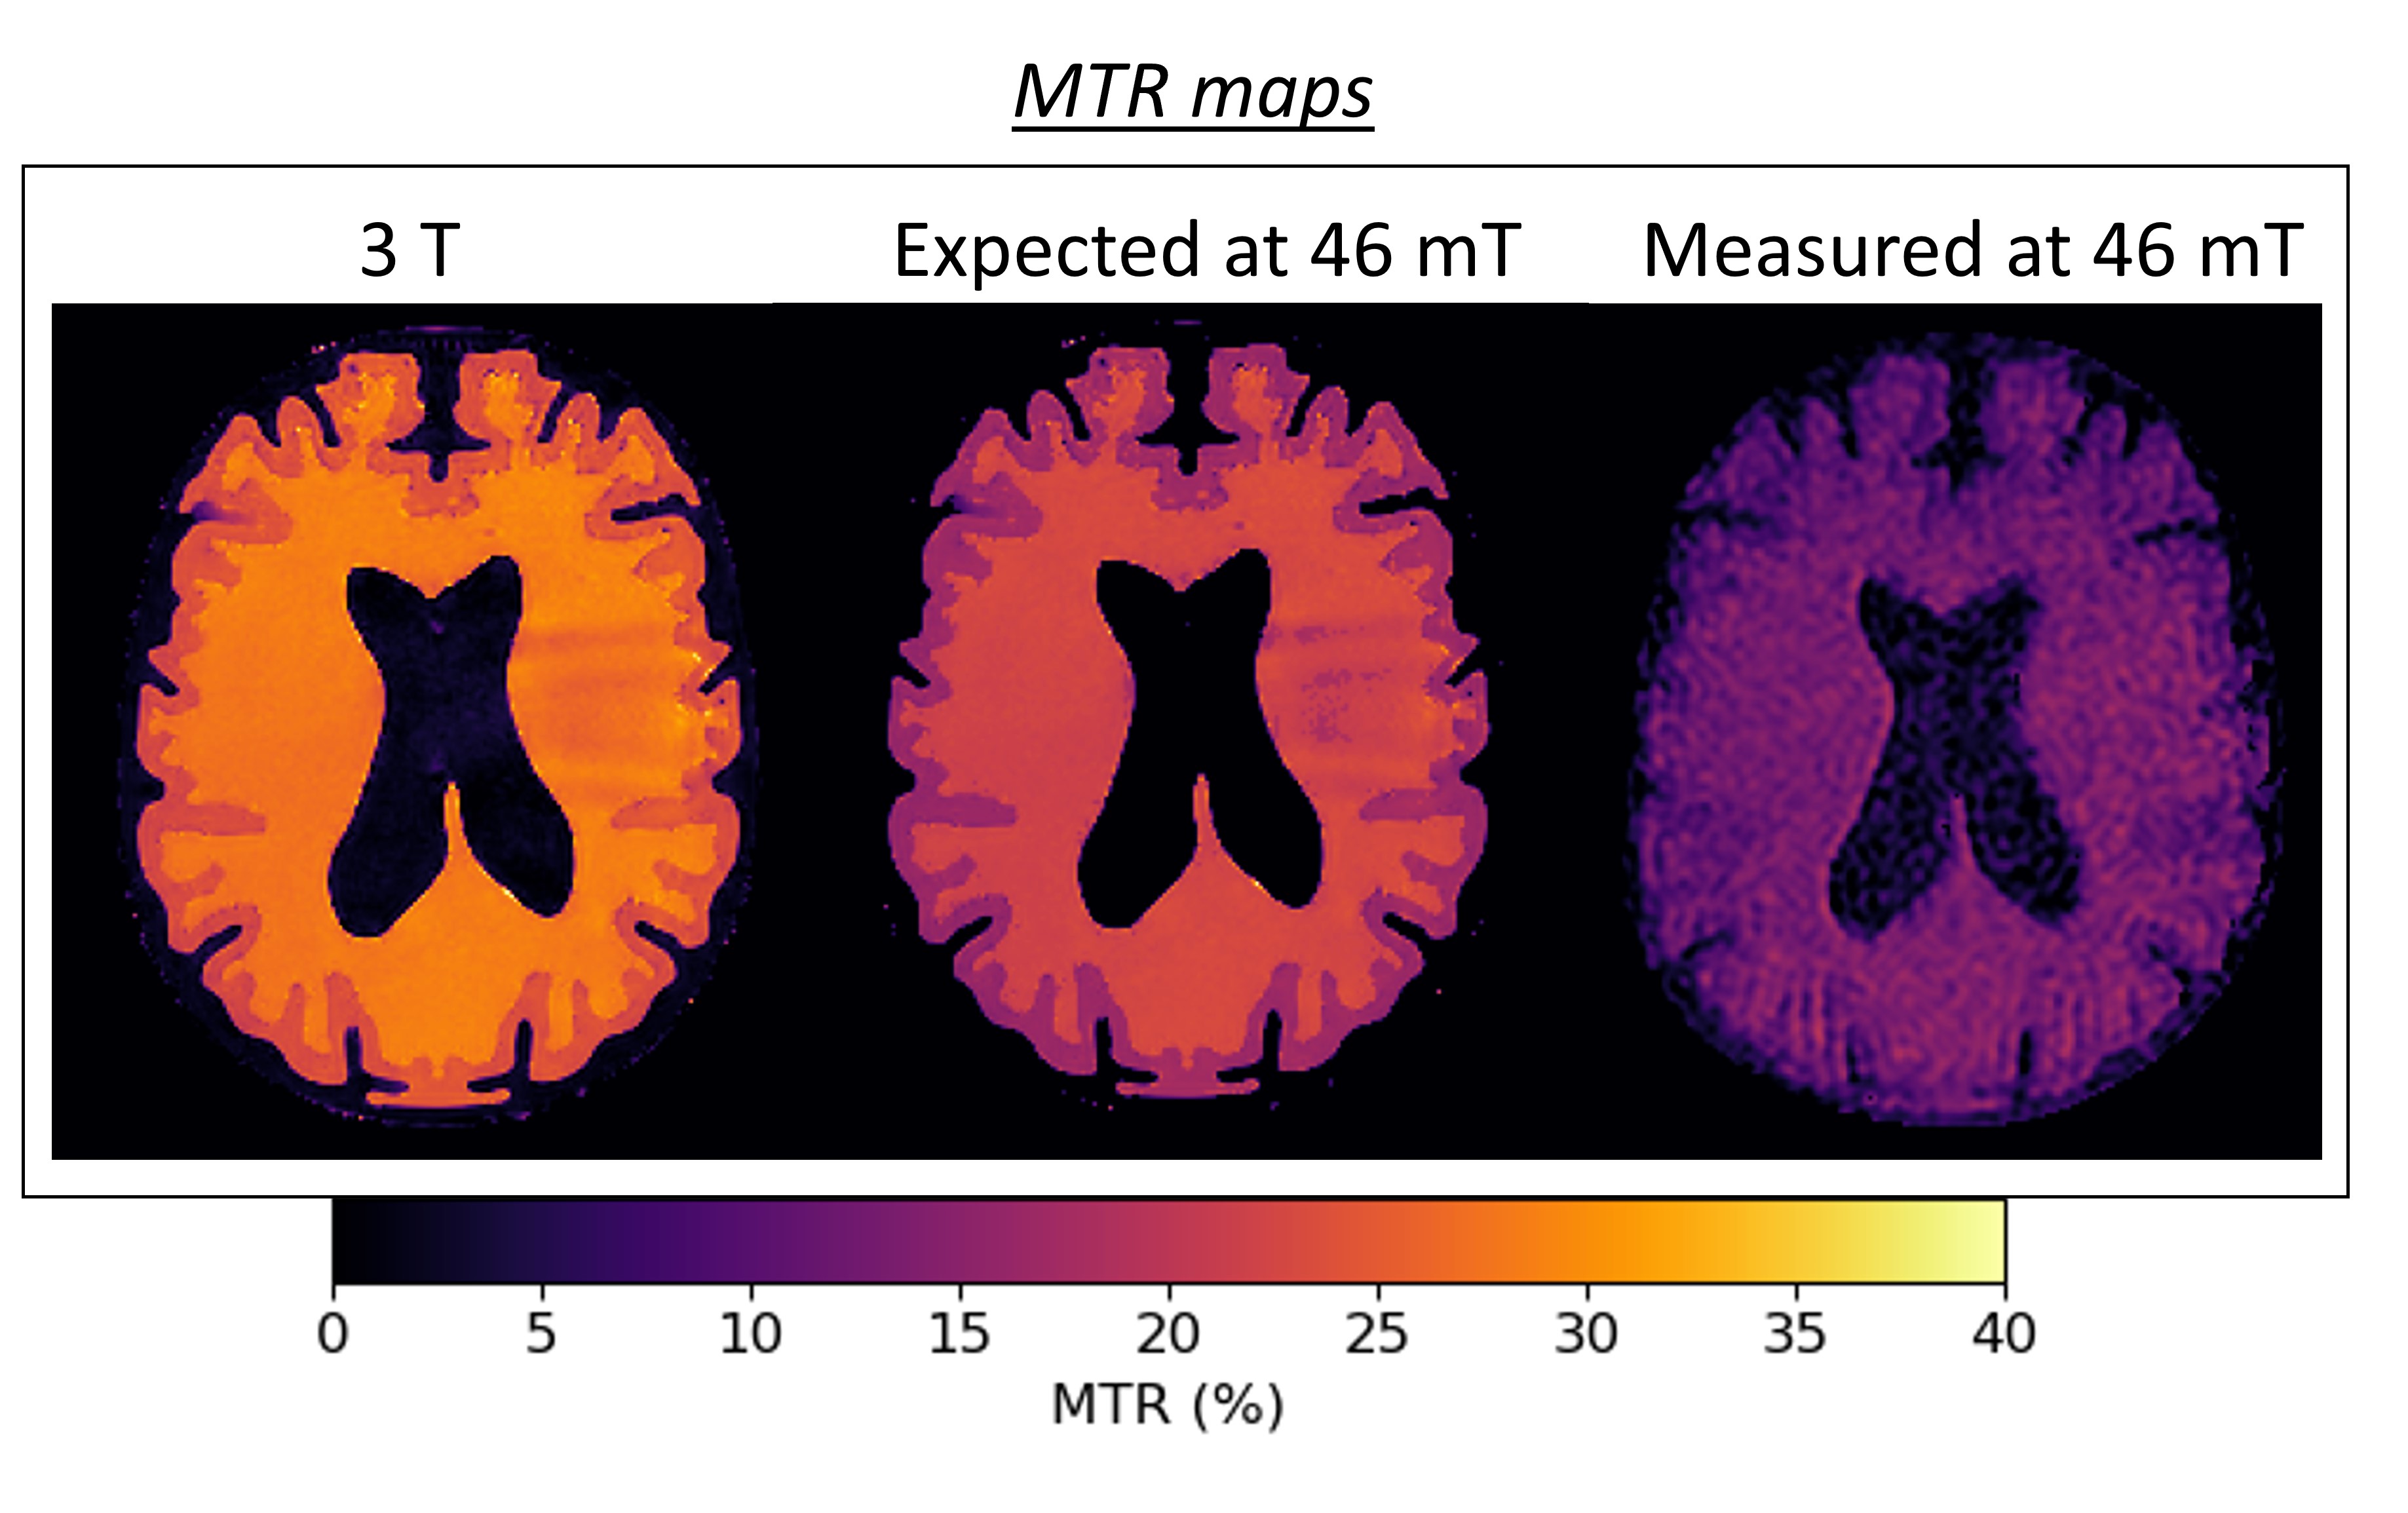
On the 46 mT system, the measured linewidth over the phantom of 34 Hz enabled the use of on- and off-resonance pulses. T1ρ-weighted images of the brain-T1/T2 are fitted to a T1ρ map (Figure 2) and compared to the T2 map. For both WM and GM compartments, the T1ρ values were higher than T2 (WM: T2=84± 3 ms, T1ρ=94± 4 ms; GM: T2=103± 5 ms, T1ρ=107± 7 ms). The same behaviour was also observed in a tube phantom experiment (Figure 3), with the T1ρ values at higher fSL differing more from the T2 values, as expected.The MTR maps of the brain-MT show a higher MTR in the white matter than grey matter, both at 46mT and 3T (Figure 4). The square root of the ratio of T1 to T2 changes by 40% in GM and 10% in WM (Table 1) from 46 mT to 3T: therefore the MTR at 46mT is expected to be 40% lower in GM and 10% lower in WM than at 3T. The numbers agree well for the GM but the values measured at 46mT in WM are ~25% below expected, probably because of incomplete saturation of the macromolecular pool, which would have a greater effect due to the higher concentration of BSA in the WM.
Discussions
A Halbach-magnet array POC with optimized ring diameters and magnet positions/orientations was sufficiently homogenous to perform T1ρ and MT experiments involving either direct on- or off- resonance pulses. T1ρ images showed a different contrast than T2, as expected. We note that, in the presence of B1 inhomogeneity, T2ρ effects can contaminate the T1ρ contrast7, and so the images may contain some contribution from which will be explored further. In the MT study, the performance of our current RF amplifier limited the duration of the MT pulse to 80 ms. With different hardware, longer RF durations may be used to reach full saturation of the macromolecular pool and higher MTR.Acknowledgements
No acknowledgement found.References
1. Sarracanie M, Salameh N. Low-Field MRI: How low can we go? A fresh view on an old debate. Front. Phys. 2020; 8. doi:10.3389/fphy.2020.00172
2. O’Reilly T, Webb AG. In vivo T1 and T2 relaxation time maps of brain tissue, skeletal muscle, and lipid measured in healthy volunteers at 50 mT. Magn Reson Med. 2022;87(2). doi:10.1002/mrm.29009
3. Wáng YXJ, Zhang Q, Li X, Chen W, Ahuja A, Yuan J. T1ρ magnetic resonance: basic physics principles and applications in knee and intervertebral disc imaging. Quant Imaging Med Surg. 2015;5(6). doi:10.3978/j.issn.2223-4292.2015.12.06
4. de Boer RW. Magnetization Transfer Contrast Part 1: MR Physics. Medica Mundi (Philips Healthcare). 1995;(2).
5. Mancini M, Karakuzu A, Cohen-Adad J, Cercignani M, Nichols TE, Stikov N. An interactive meta-analysis of MRI biomarkers of Myelin. Elife. 2020;9. doi:10.7554/eLife.61523
6. O’Reilly T, Webb A. The design of a low-weight homogenous Halbach helmet for imaging the adult brain. In: Proceedings of 31st Annual Meeting of ISMRM & ISMRT. ; 2021.
7. Witschey WRT, Borthakur A, Elliott MA, et al. Compensation for spin-lock artifacts using an off-resonance rotary echo in T1ρoff-weighted imaging. Magn Reson Med. 2007;57(1). doi:10.1002/mrm.21134
8. Hajnal J v., Baudouin CJ, Oatridge A, Young IR, Bydder GM. Design and implementation of magnetization transfer pulse sequences for clinical use. J Comput Assist Tomogr. 1992;16(1). doi:10.1097/00004728-199201000-00003
9. Koenig SH, Brown RD, Ugolini R. Magnetization transfer in cross‐linked bovine serum albumin solutions at 200 MHz: A model for tissue. Magn Reson Med. 1993;29(3). doi:10.1002/mrm.1910290306
10. McGowan JC, Leigh JS. Selective saturation in magnetization transfer experiments. Magn Reson Med. 1994;32(4). doi:10.1002/mrm.1910320415
Figures