0298
A novel atlas of absolute myelin water content: the baseline for studying inflammatory demyelinating diseases1INM-4, Research Centre Juelich, Juelich, Germany, 2Department of Psychology and Neurosciences, Leibniz Research Centre for Working Environment and Human Factors (IfADo), Dortmund, Germany, 3Faculty of Psychology, Institute for Cognitive Neuroscience, Department of Biopsychology, Ruhr University Bochum, Bochum, Germany, 4JARA-BRAIN - Translational Medicine, Aachen, Germany, 5Department of Neurology, RWTH Aachen University, Aachen, Germany, 6INM-11, JARA, Forschungszentrum Jülich, Juelich, Germany
Synopsis
Quantitative brain atlases can be combined in multiparametric characterisations of the same template voxel with a number of microstructure-sensitive quantities, potentially enabling earlier and more specific characterisation of changes caused by disease. We combine in this study two quantitative atlases, absolute water content and myelin water fraction, to generate a novel atlas describing absolute myelin water content. This is relevant as a baseline for investigating changes in inflammatory diseases involving both demyelination and brain edema. The accompanying relaxometric parameters R2* and R2 are combined in an atlas of the reversible relaxation rate R2’. Fibre tract-specific distributions and correlations are found.
Introduction
Brain edema is associated with a variety of neuropathological conditions such as brain trauma, stroke, multiple sclerosis, and brain tumours. A common finding is an inflammatory response, which may have a significant impact on brain edema formation [1]. Myelin is critical for human cognition and behaviour by modulating the conduction speed of neuronal information [2]. Myelin content can be characterized in vivo using myelin water fraction (MWF) imaging based on T2 relaxometry [3,4], shown to strongly correlate with myelin content determined ex vivo [5]. MWF is nevertheless only a fraction, depending on both myelin water and total water distributions. The balance between the two is microstructure specific and can change dramatically in pathologies [6,7]. Among diseases which involve changes in both water and myelin content on an inflammatory background, multiple sclerosis arguably receives most interest. A small number of studies report simultaneous measurements of water content and myelin water fraction in MS patients and/or healthy controls [8-10]. However, these reports were conducted with less than optimal techniques for one of the parameters, suffering from either imperfect B1 correction for water content mapping [8,9], or imperfect myelin water derivation, based on biexponential constrained fit of T2* signal decay [10]. We combine in the following quantitative parameters derived with gold standard MRI methods [11,12] in different populations, but theoretically not depending on the details of populations anymore, to derive novel information relevant to tissue microstructure. More specifically, an atlas of the water content of the brain expressed as volume fraction, accompanied by R2* relaxation, is combined with an atlas of myelin water fraction and its accompanying R2 information. As a result, all quantities can be combined or correlated in each individual voxel and reflect the population-averaged microstructure of the voxel. Atlases of myelin water content (MW) and reversible relaxation rate (R2’), as well as correlations between parameter pairs are reported below.Materials and Methods
The water content and R2* atlases were generated as described in [12] (method B). Briefly, 20 healthy volunteers aged 20-30 years (mean age 24.95y, from 22 to 29, 20 male) were scanned with a single long-TR multi-echo gradient echo sequence with 32 echoes. Water content maps normalised to CSF and R2* maps were produced in postprocessing using a monoexponential decay model. For the MWF atlas, 153 healthy volunteers, (mean age 24.98y, from 23 to 27, 153 male) were scanned with a 3D multi-echo GRASE sequence with 32 echoes [13]. The multi-echo decay curves obtained from GRASE were analyzed using multicomponent T2 analysis with correction for stimulated echo as outlined in [13]. More details of the study are given in [14,15]. All maps were normalised to MNI using a nonlinear registration as described in [12], and the mean and standard deviation of the quantitative properties over all volunteers calculated on a voxel-by-voxel basis.Results and Discussion
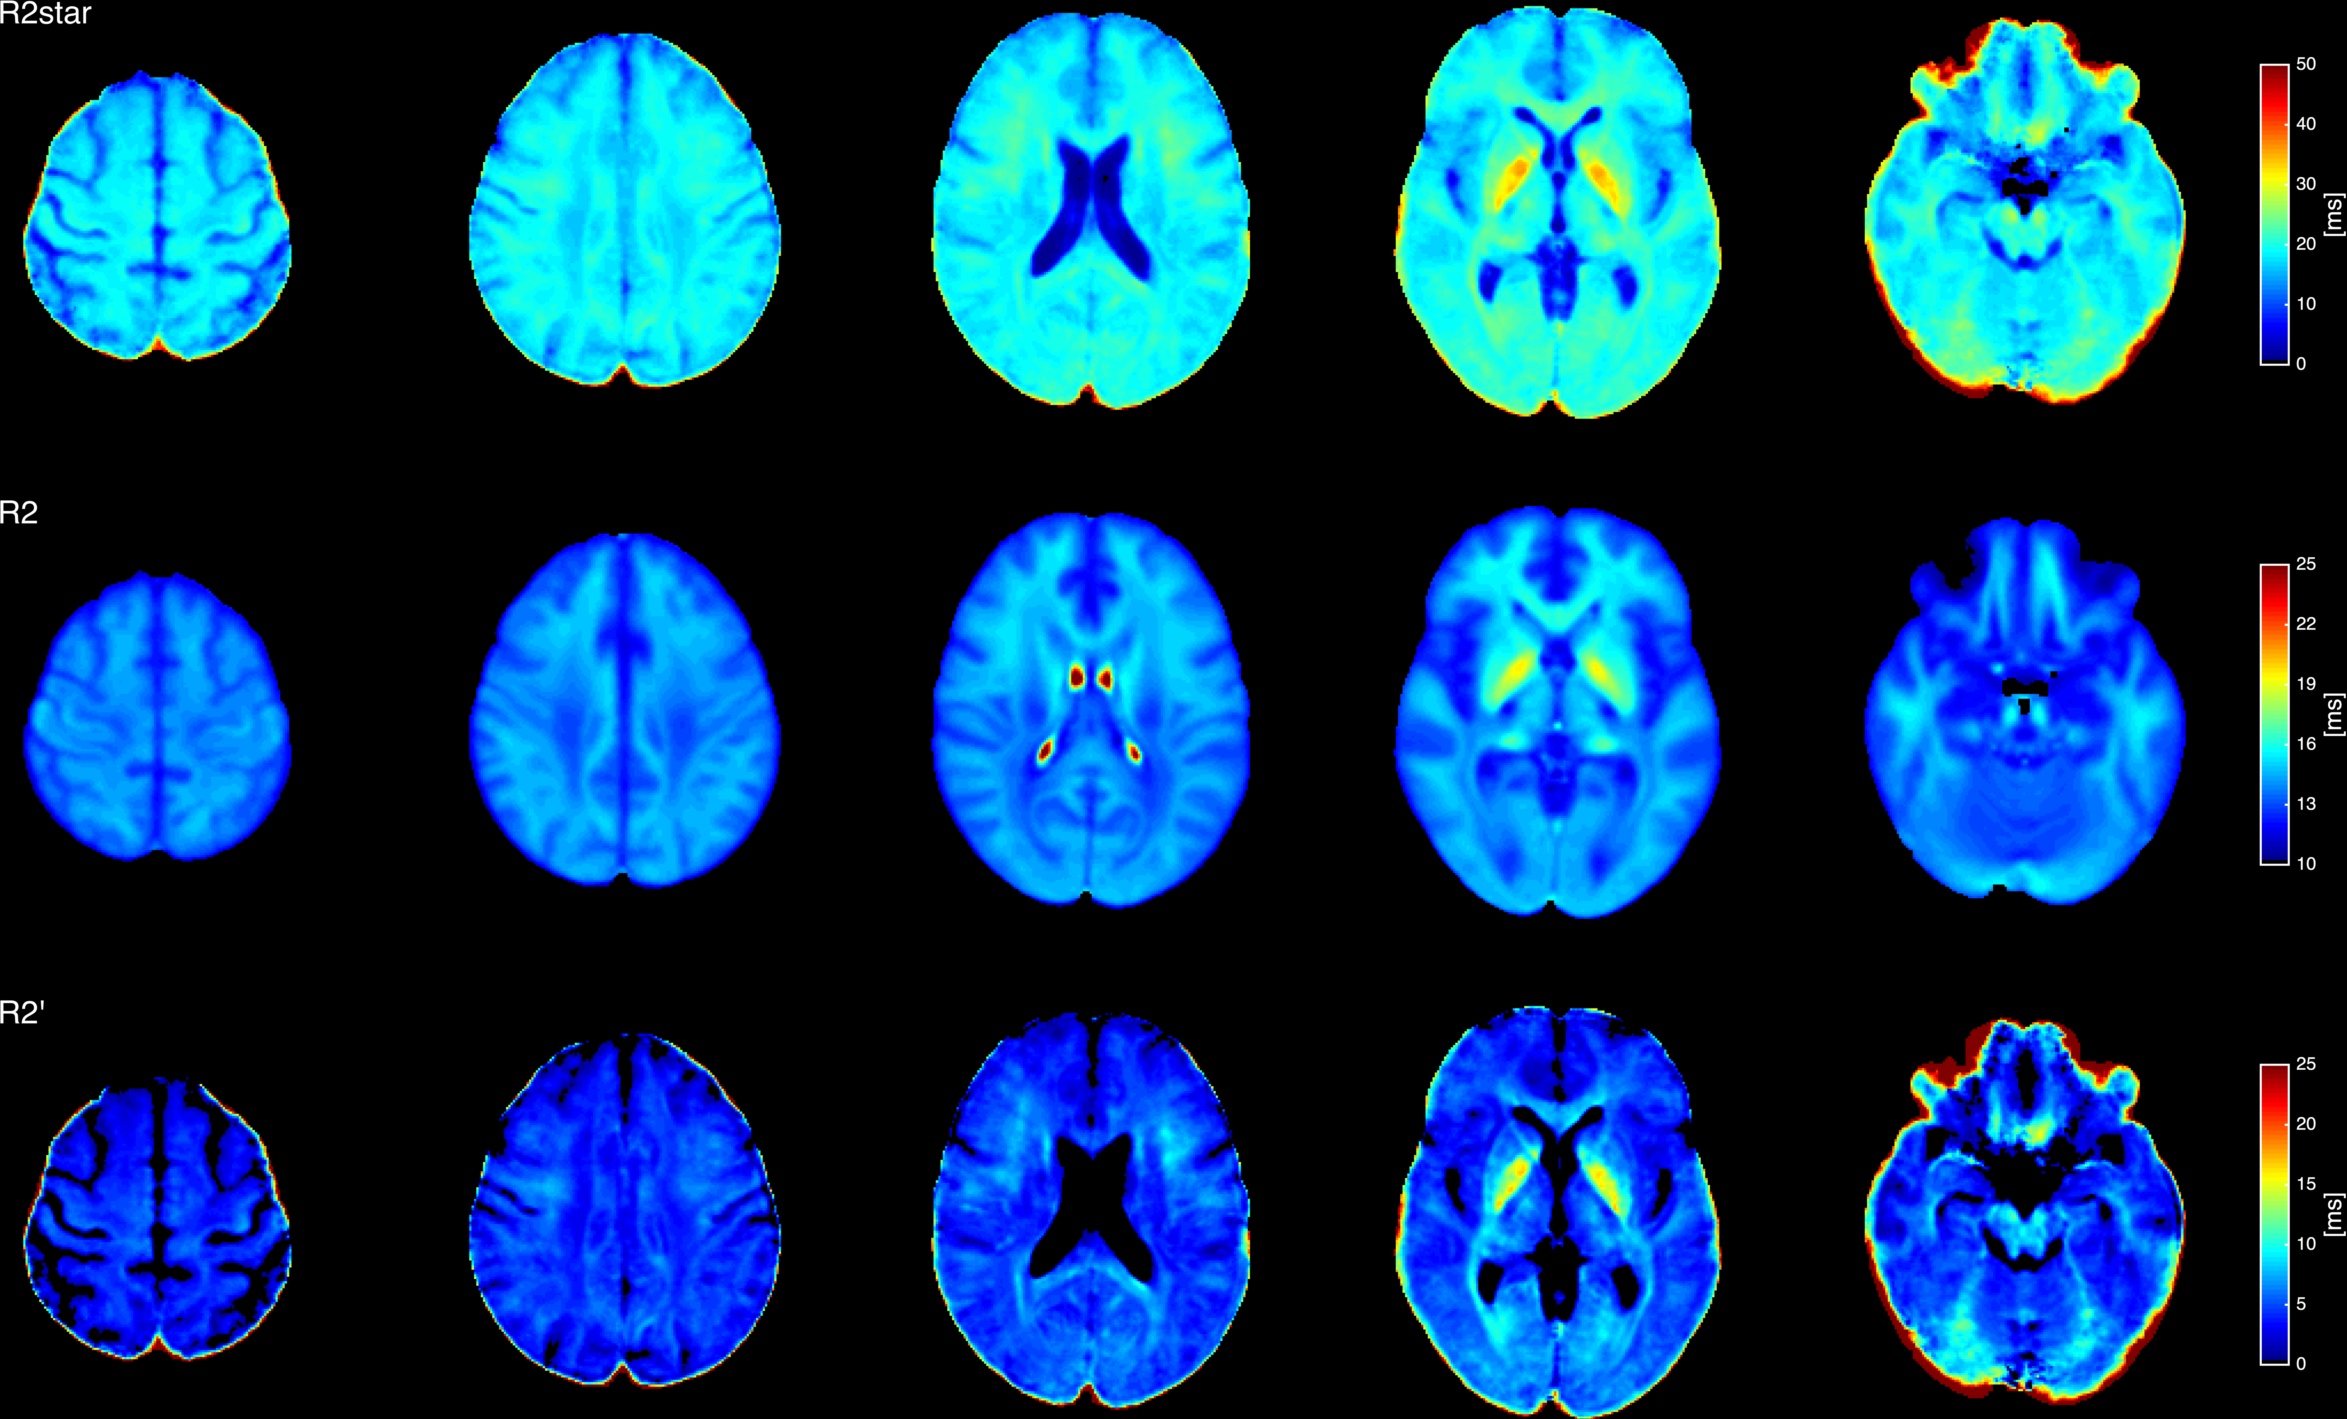
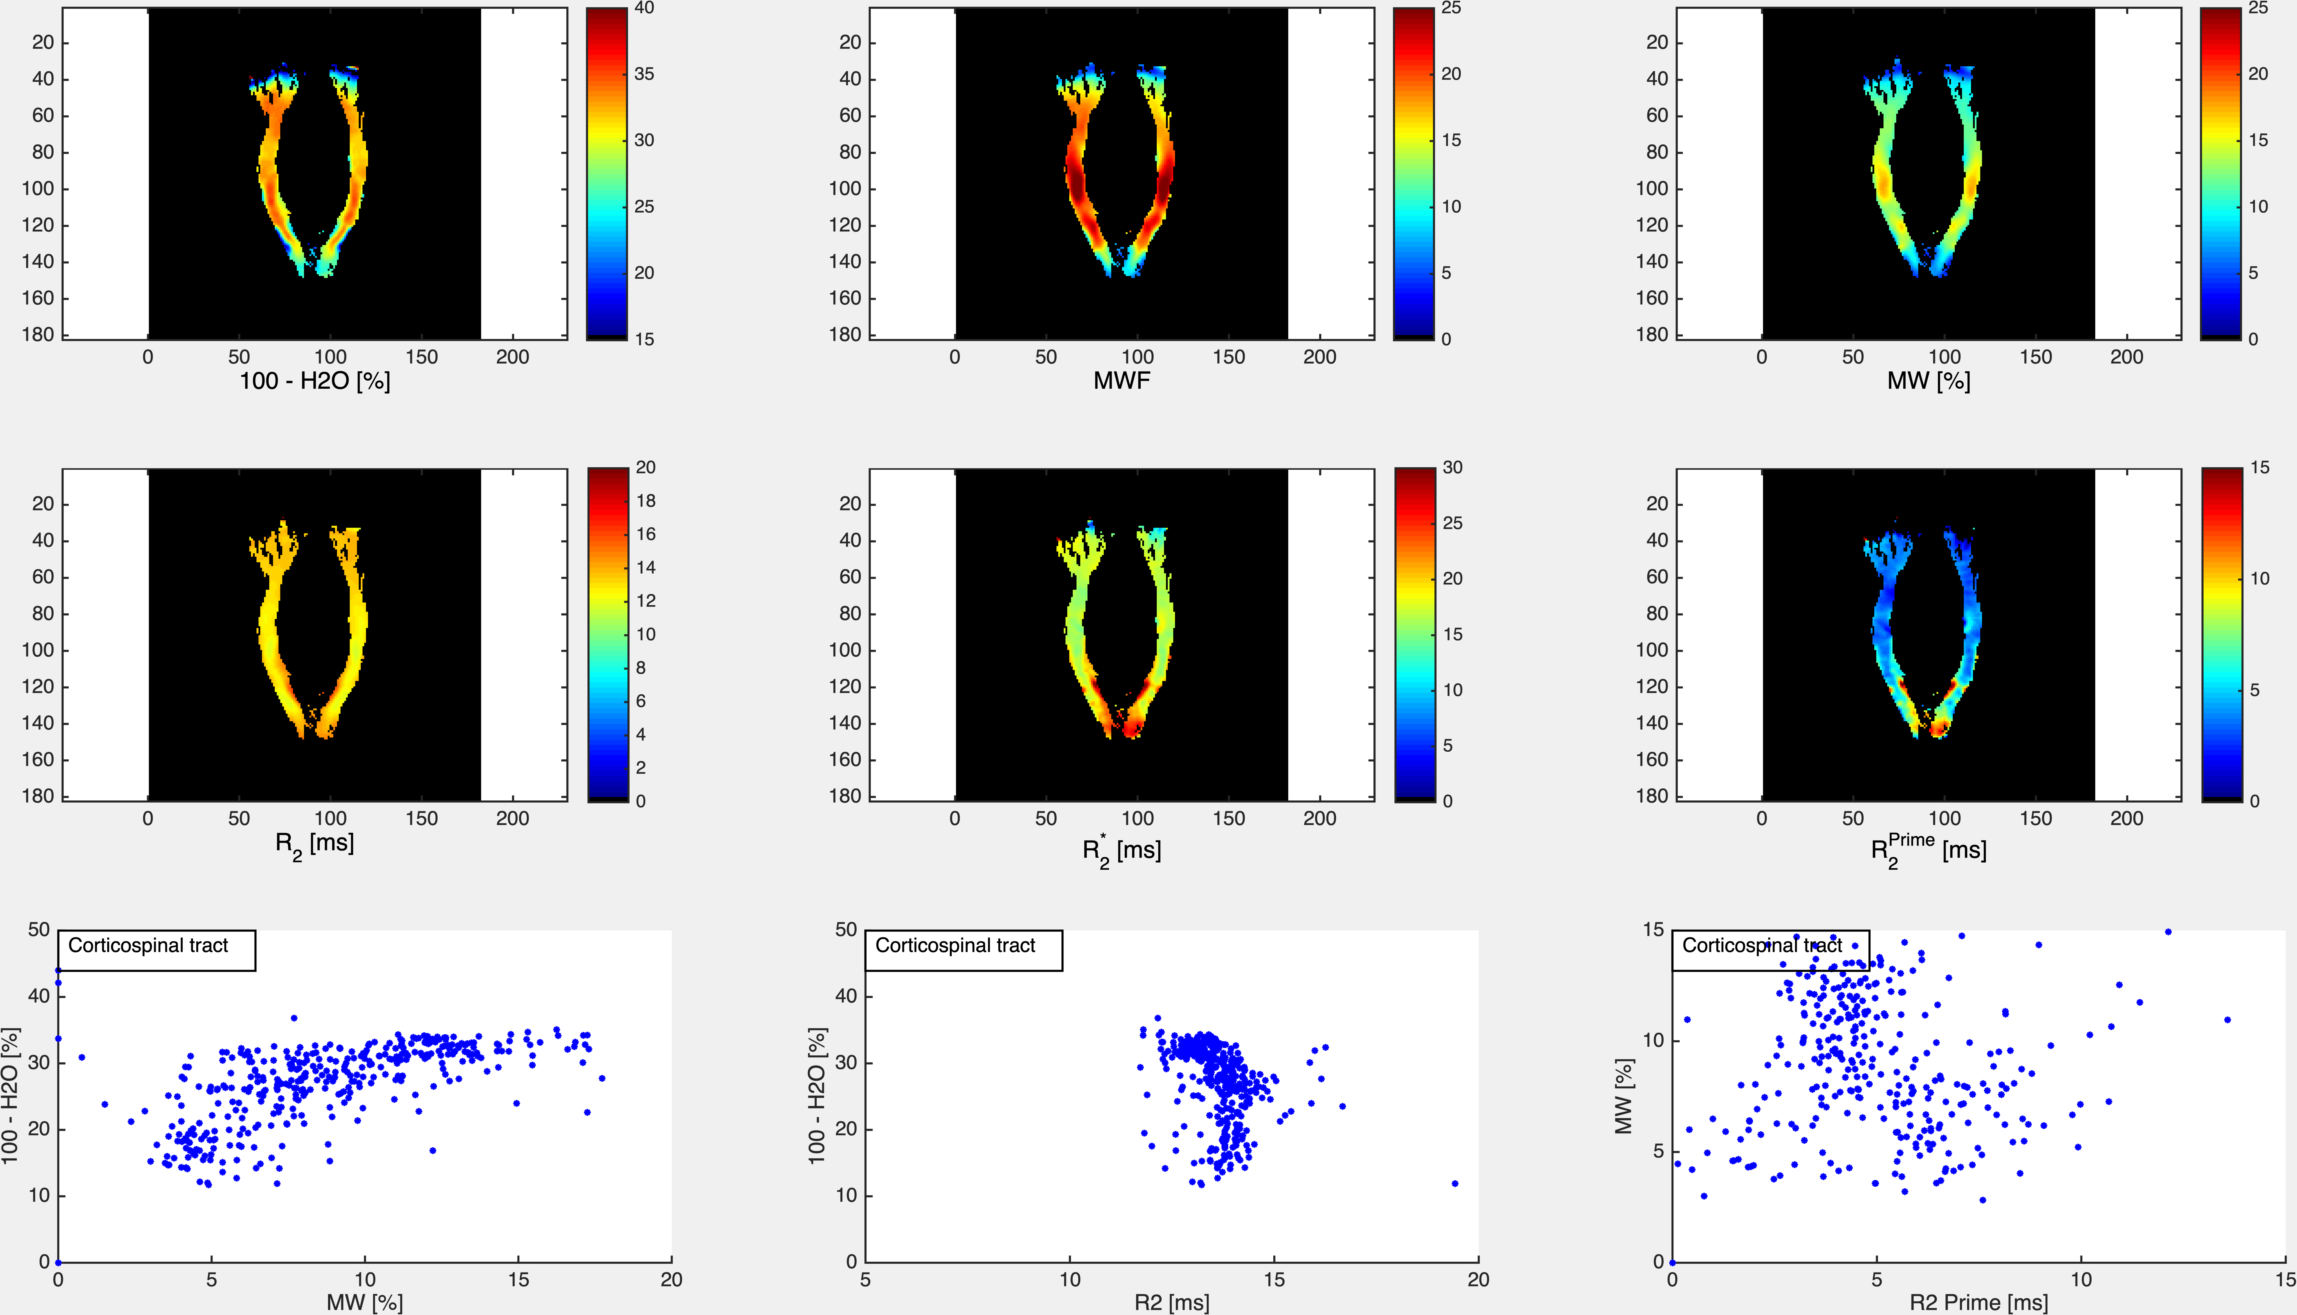
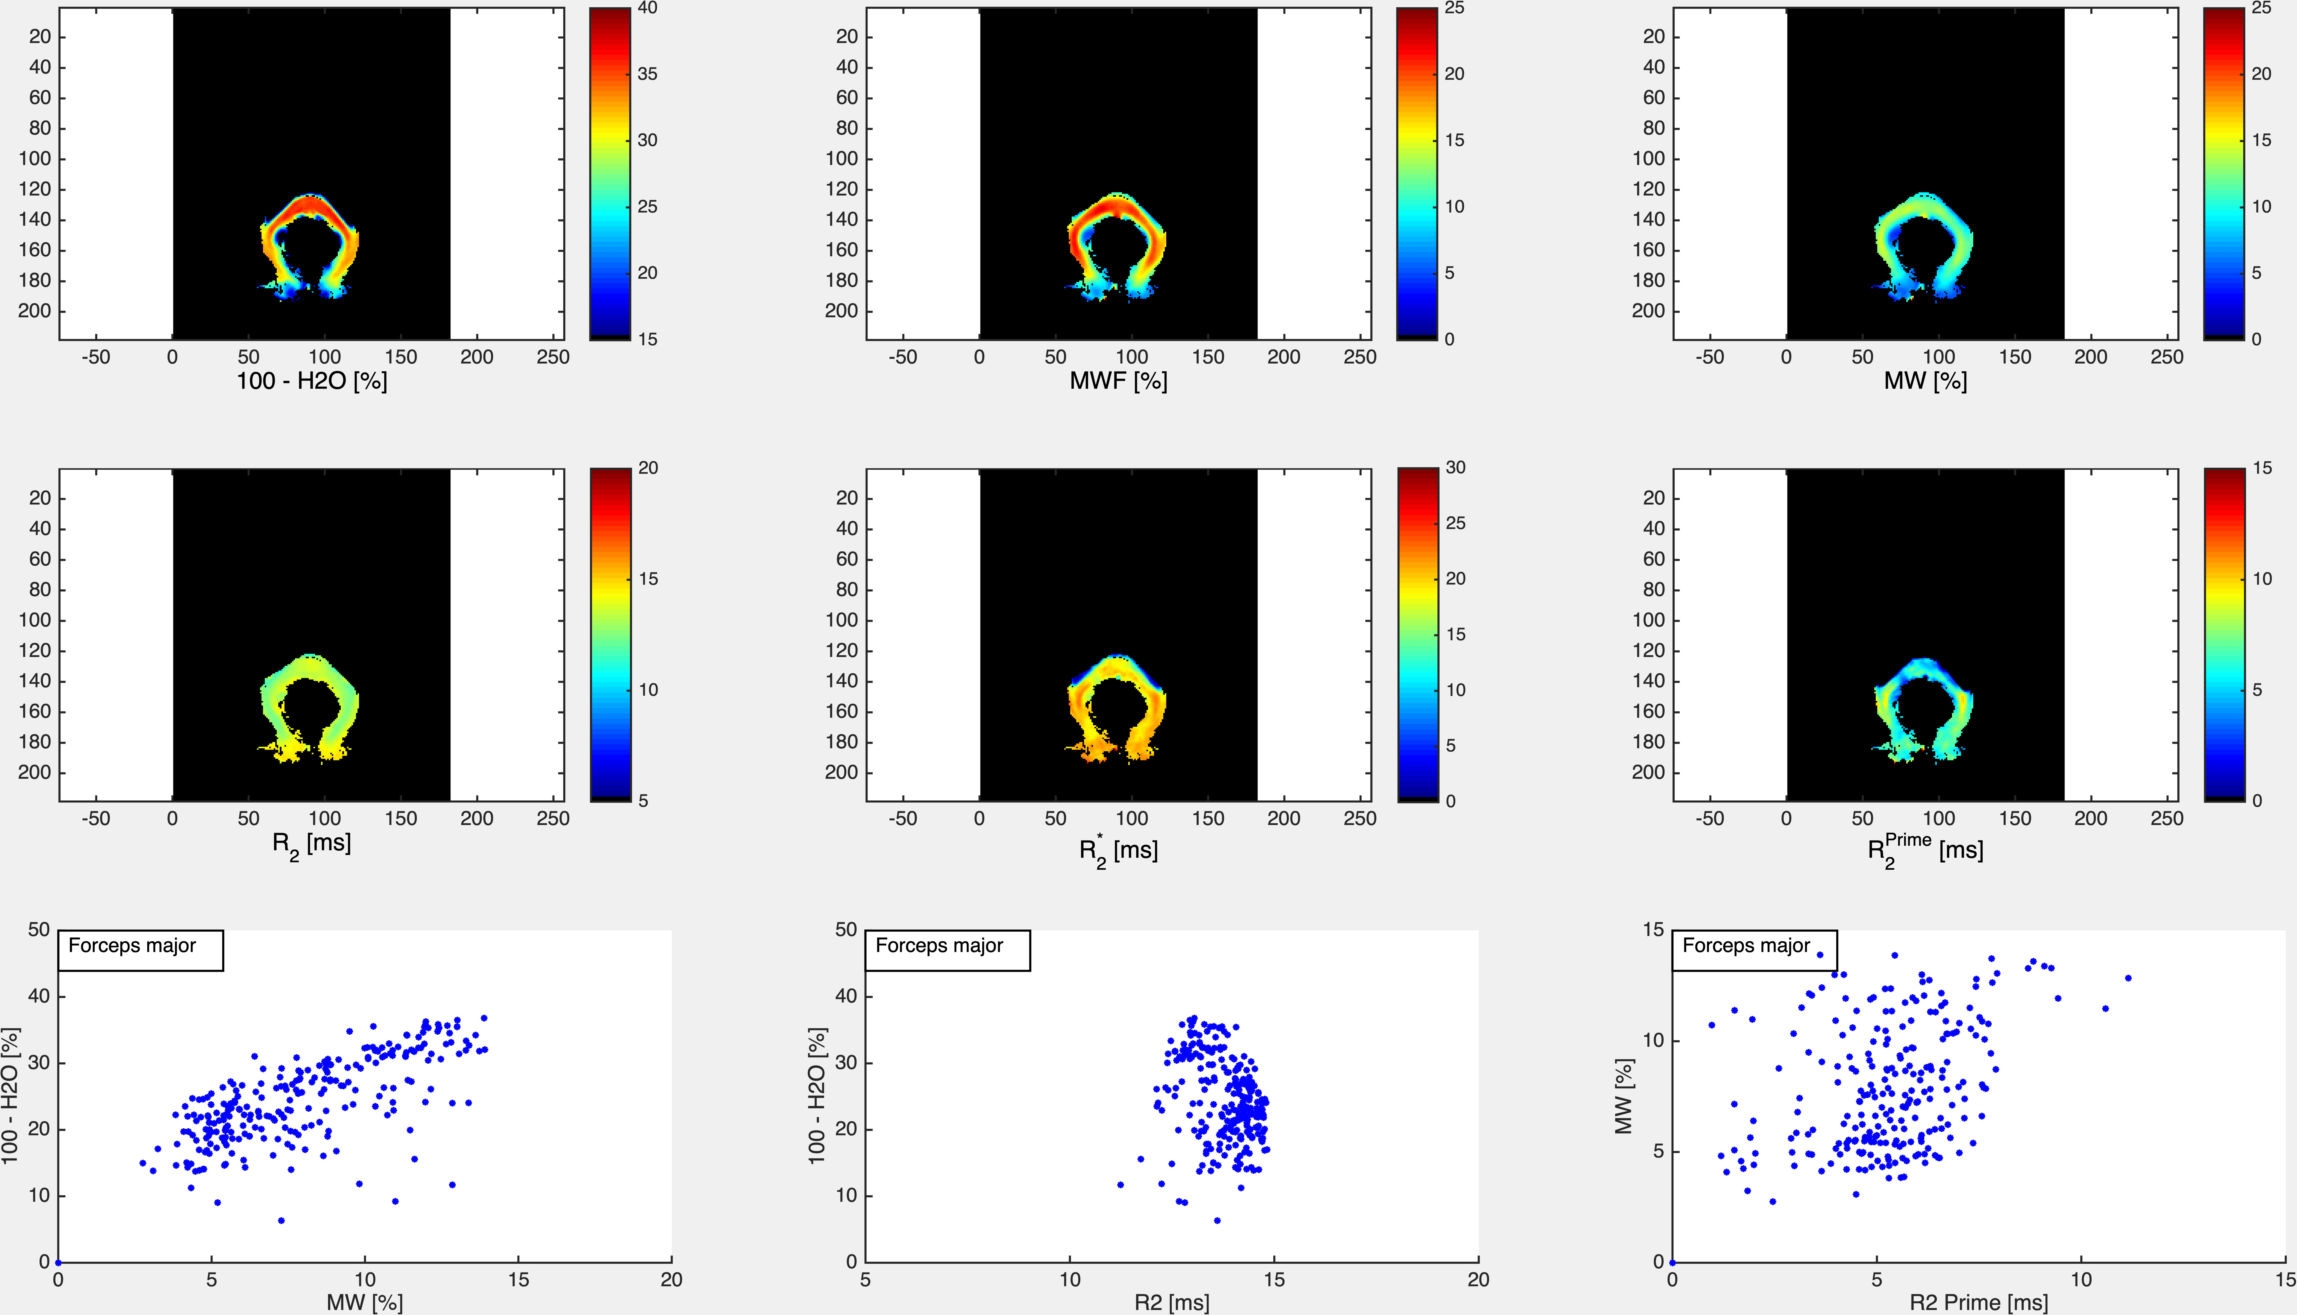
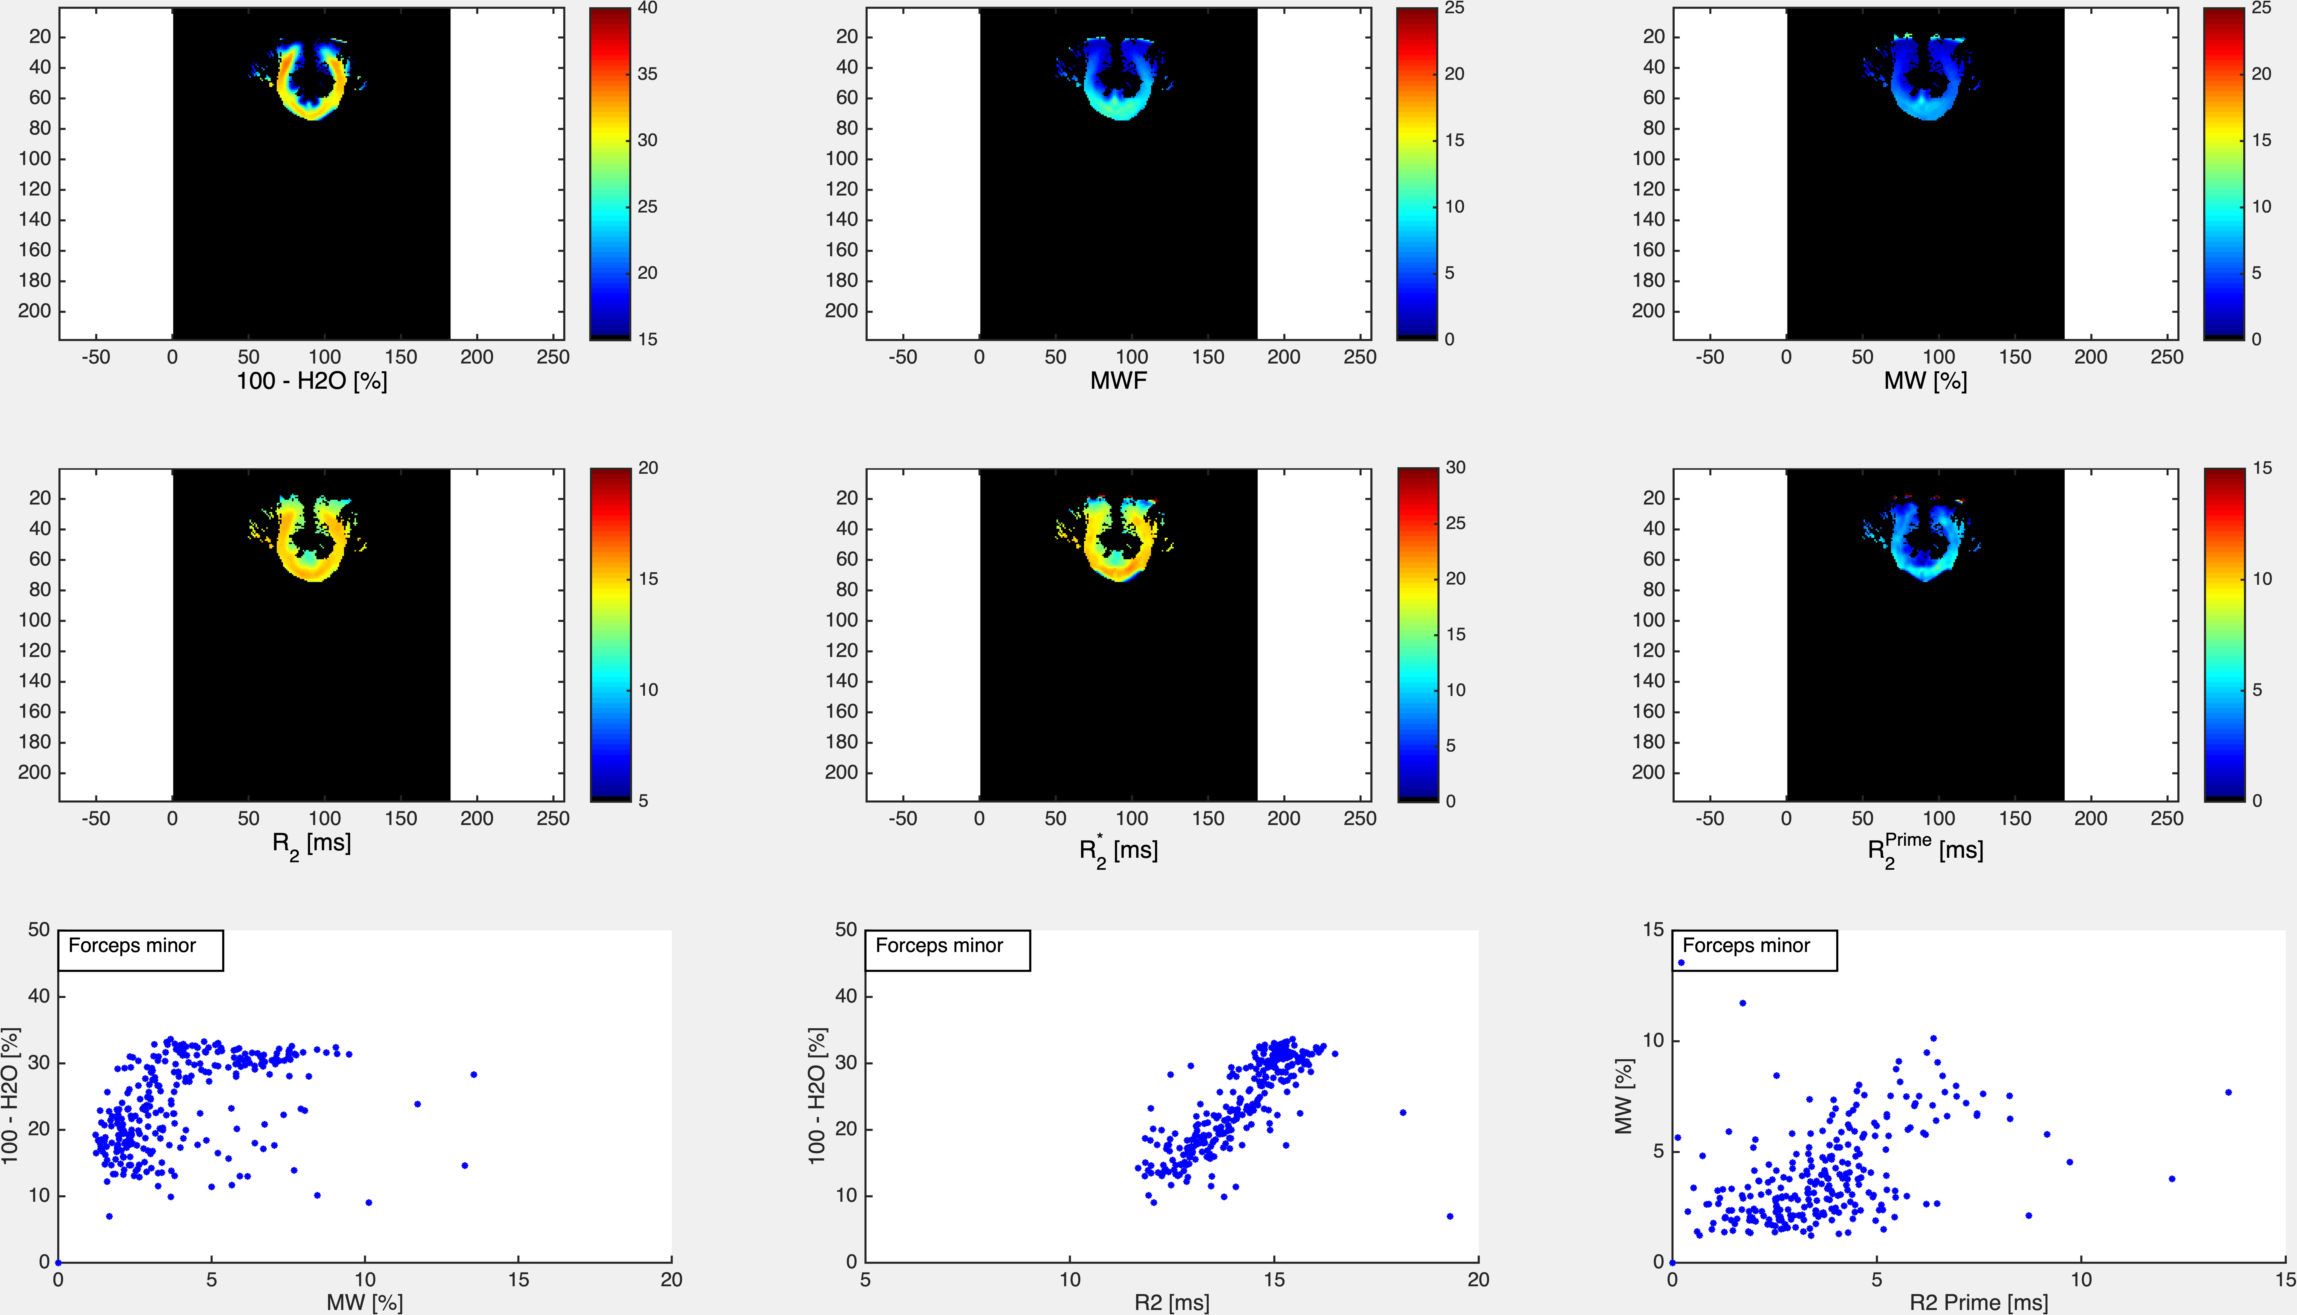
The volunteer populations used for each atlas were well matched in gender, age distribution and ethnicity. A higher number of volunteers was used to create the MWF atlas, in order to minimise variability due to noise (MWF is noisy whereas water content has high SNR). The four input (H2O, R2*, MWF, R2) and two derived atlas maps (MW, R2’) are shown in Figs. 1 and 2, together with their histograms over the whole brain. The derived R2’ maps visually show sensitivity to the presence of fibre tracts, but also some remnant regional inhomogeneity, possibly related to the influence of physiological motion and background field on R2*. A more accurate quantity can be obtained if these effects are corrected by acquisition and signal modeling [16] and will be the subject of future work. Visually, the myelin water content map MW appears similar to the myelin water fraction map MWF. This is due to the fact that white matter has a narrow distribution of water content (SD ~3pu) and for many practical purposes can be considered to have constant water content value of 70 percent units. However, subtle differences between the two can be observed and are described in Figs 3-5. The distribution of quantitative parameters is detailed along distinct fibre tracts, defined within the JHU fibre atlas [17] in MNI space. Correlations between pairs of parameters are shown. Fibre-specific distributions are found and warrant further study, in particular regarding orientation effects on all quantities and sources of correlation.Conclusions
A novel myelin water content atlas was obtained by combining water content and myelin water fraction atlases, acquired with gold standard methods for each parameter. This should serve as a baseline against which simultaneous demyelination and edema, such as caused by inflammatory processes, can be characterised. We furthermore establish baseline values for correlations between pairs of parameters, such as water content and T2, or myelin water content and R2’. These can be expected to be even more sensitive to pathological changes than individual parameters – e.g. both increases in water content and decreases in MW would increase T2 and T2*, most probably at different rates; changes in myelin and associated iron content would change the correlation between MW and R2’. Future work should elucidate the role of these quantities in characterizing brain inflammation.Acknowledgements
No acknowledgement found.References
[1] Stamatovic et al, Acta Neurochir Suppl. 2006;96:444-50. doi: 10.1007/3-211-30714-1_91
[2] Friedrich P, Ocklenburg S, Heins N, Schlüter C, Fraenz C, Beste C, Güntürkün O, Genç E (2017) Callosal microstructure affects the timing of electrophysiological left-right differences. Neuroimage163:310318.https://doi.org/10.1016/j.neuroimage.2017.09.048
[3] MacKay, A. et al. In vivo visualization of myelin water in brain by magnetic resonance. Magn. Reson. Med. 31, 673–677 (1994).
[4] Whittall, K. P. et al. In vivo measurement of T-2 distributions and water contents in normal human brain. Magn. Reson. Med. 37, 34–43. https://doi.org/10.1002/mrm.1910370107 (1997).
[5] Laule C, Leung E, Lis DKB et al (2006) Myelin water imaging in multiple sclerosis: quantitative correlations with histopathology. Mult Scler 12(6):747–753. https://doi.org/10.1177/1352458506070928
[6] Laule C, Bjarnason TA, Vavasour IM, Traboulsee AL, Wayne Moore GR, Li DKB, MacKay AL. Characterization of brain tumours with spin-spin relaxation: pilot case study reveals unique T 2 distribution profiles of glioblastoma, oligodendroglioma and meningioma. J Neurol. 2017 Nov;264(11):2205-2214. doi: 10.1007/s00415-017-8609-6.
[7] Laule C, Vavasour IM, Kolind SH, Traboulsee AL, Moore GR, Li DK, Mackay AL. Long T2 water in multiple sclerosis: what else can we learn from multi-echo T2 relaxation? J Neurol. 2007 Nov;254(11):1579-87. doi: 10.1007/s00415-007-0595-7.
[8] Laule C, Vavasour IM, Moore GRW, et al. Water content and myelin water fraction in multiple sclerosis. A T2 relaxation study. J Neurol 2004;251:284-93.
[9] Vavasour, IM, Chang, KL, Combes, AJE, Meyers, SM, Kolind, SH, Rauscher, A, et al. Water content changes in new multiple sclerosis lesions have a minimal effect on the determination of myelin water fraction values. J Neuroimaging. 2021; 31: 1119– 1125. https://doi.org/10.1111/jon.12908
[10] Neeb H, Schenk J, Weber B. Multicentre absolute myelin water content mapping: Development of a whole brain atlas and application to low-grade multiple sclerosis. Neuroimage Clin. 2012 Oct 5;1(1):121-30. doi: 10.1016/j.nicl.2012.09.013.
[11] Dvorak, A.V., Swift-LaPointe, T., Vavasour, I.M. et al. An atlas for human brain myelin content throughout the adult life span. Sci Rep 11, 269 (2021). https://doi.org/10.1038/s41598-020-79540-3
[12] N. Jon Shah, Zaheer Abbas, Dominik Ridder, Markus Zimmermann, Ana-Maria Oros-Peusquens. A novel MRI-based quantitative water content atlas of the human brain, NeuroImage 252 (2022)119014, https://doi.org/10.1016/j.neuroimage.2022.119014
[13] Prasloski T, Rauscher A, MacKay AL et al (2012) Rapid whole cerebrum myelin water imaging using a 3D GRASE sequence. Neuroimage 63(1):533–539. https://doi.org/10.1016/j.neuroimage.2012.06.06
[14] Ocklenburg, S., Anderson, C., Gerding, W.M. et al. Myelin Water Fraction Imaging Reveals Hemispheric Asymmetries in Human White Matter That Are Associated with Genetic Variation in PLP1. Mol Neurobiol 56, 3999–4012 (2019). https://doi.org/10.1007/s12035-018-1351-y
[15] Tobias W. Meissner, Erhan Genç, Burkhard Mädler, Sarah Weigelt. Myelin development in visual scene-network tracts beyond late childhood: A multimethod neuroimaging study. Cortex, 137 (2021) p.18-34, https://doi.org/10.1016/j.cortex.2020.12.016.
[16] Yablonskiy DA, Sukstanskii AL, Luo J, Wang X. Voxel spread function method for correction of magnetic field inhomogeneity effects in quantitative gradient-echo-based MRI. Magn Reson Med. 2013 Nov;70(5):1283-92. doi: 10.1002/mrm.24585.
[17] Wakana, S., Jiang, H., Nagae-Poetscher, M., van Zijl, P.C.M., Mori, S., “A fiber-tract based atlas of Human white matter anatomy”, Radiology, 230, 77-87 (2004)
Figures
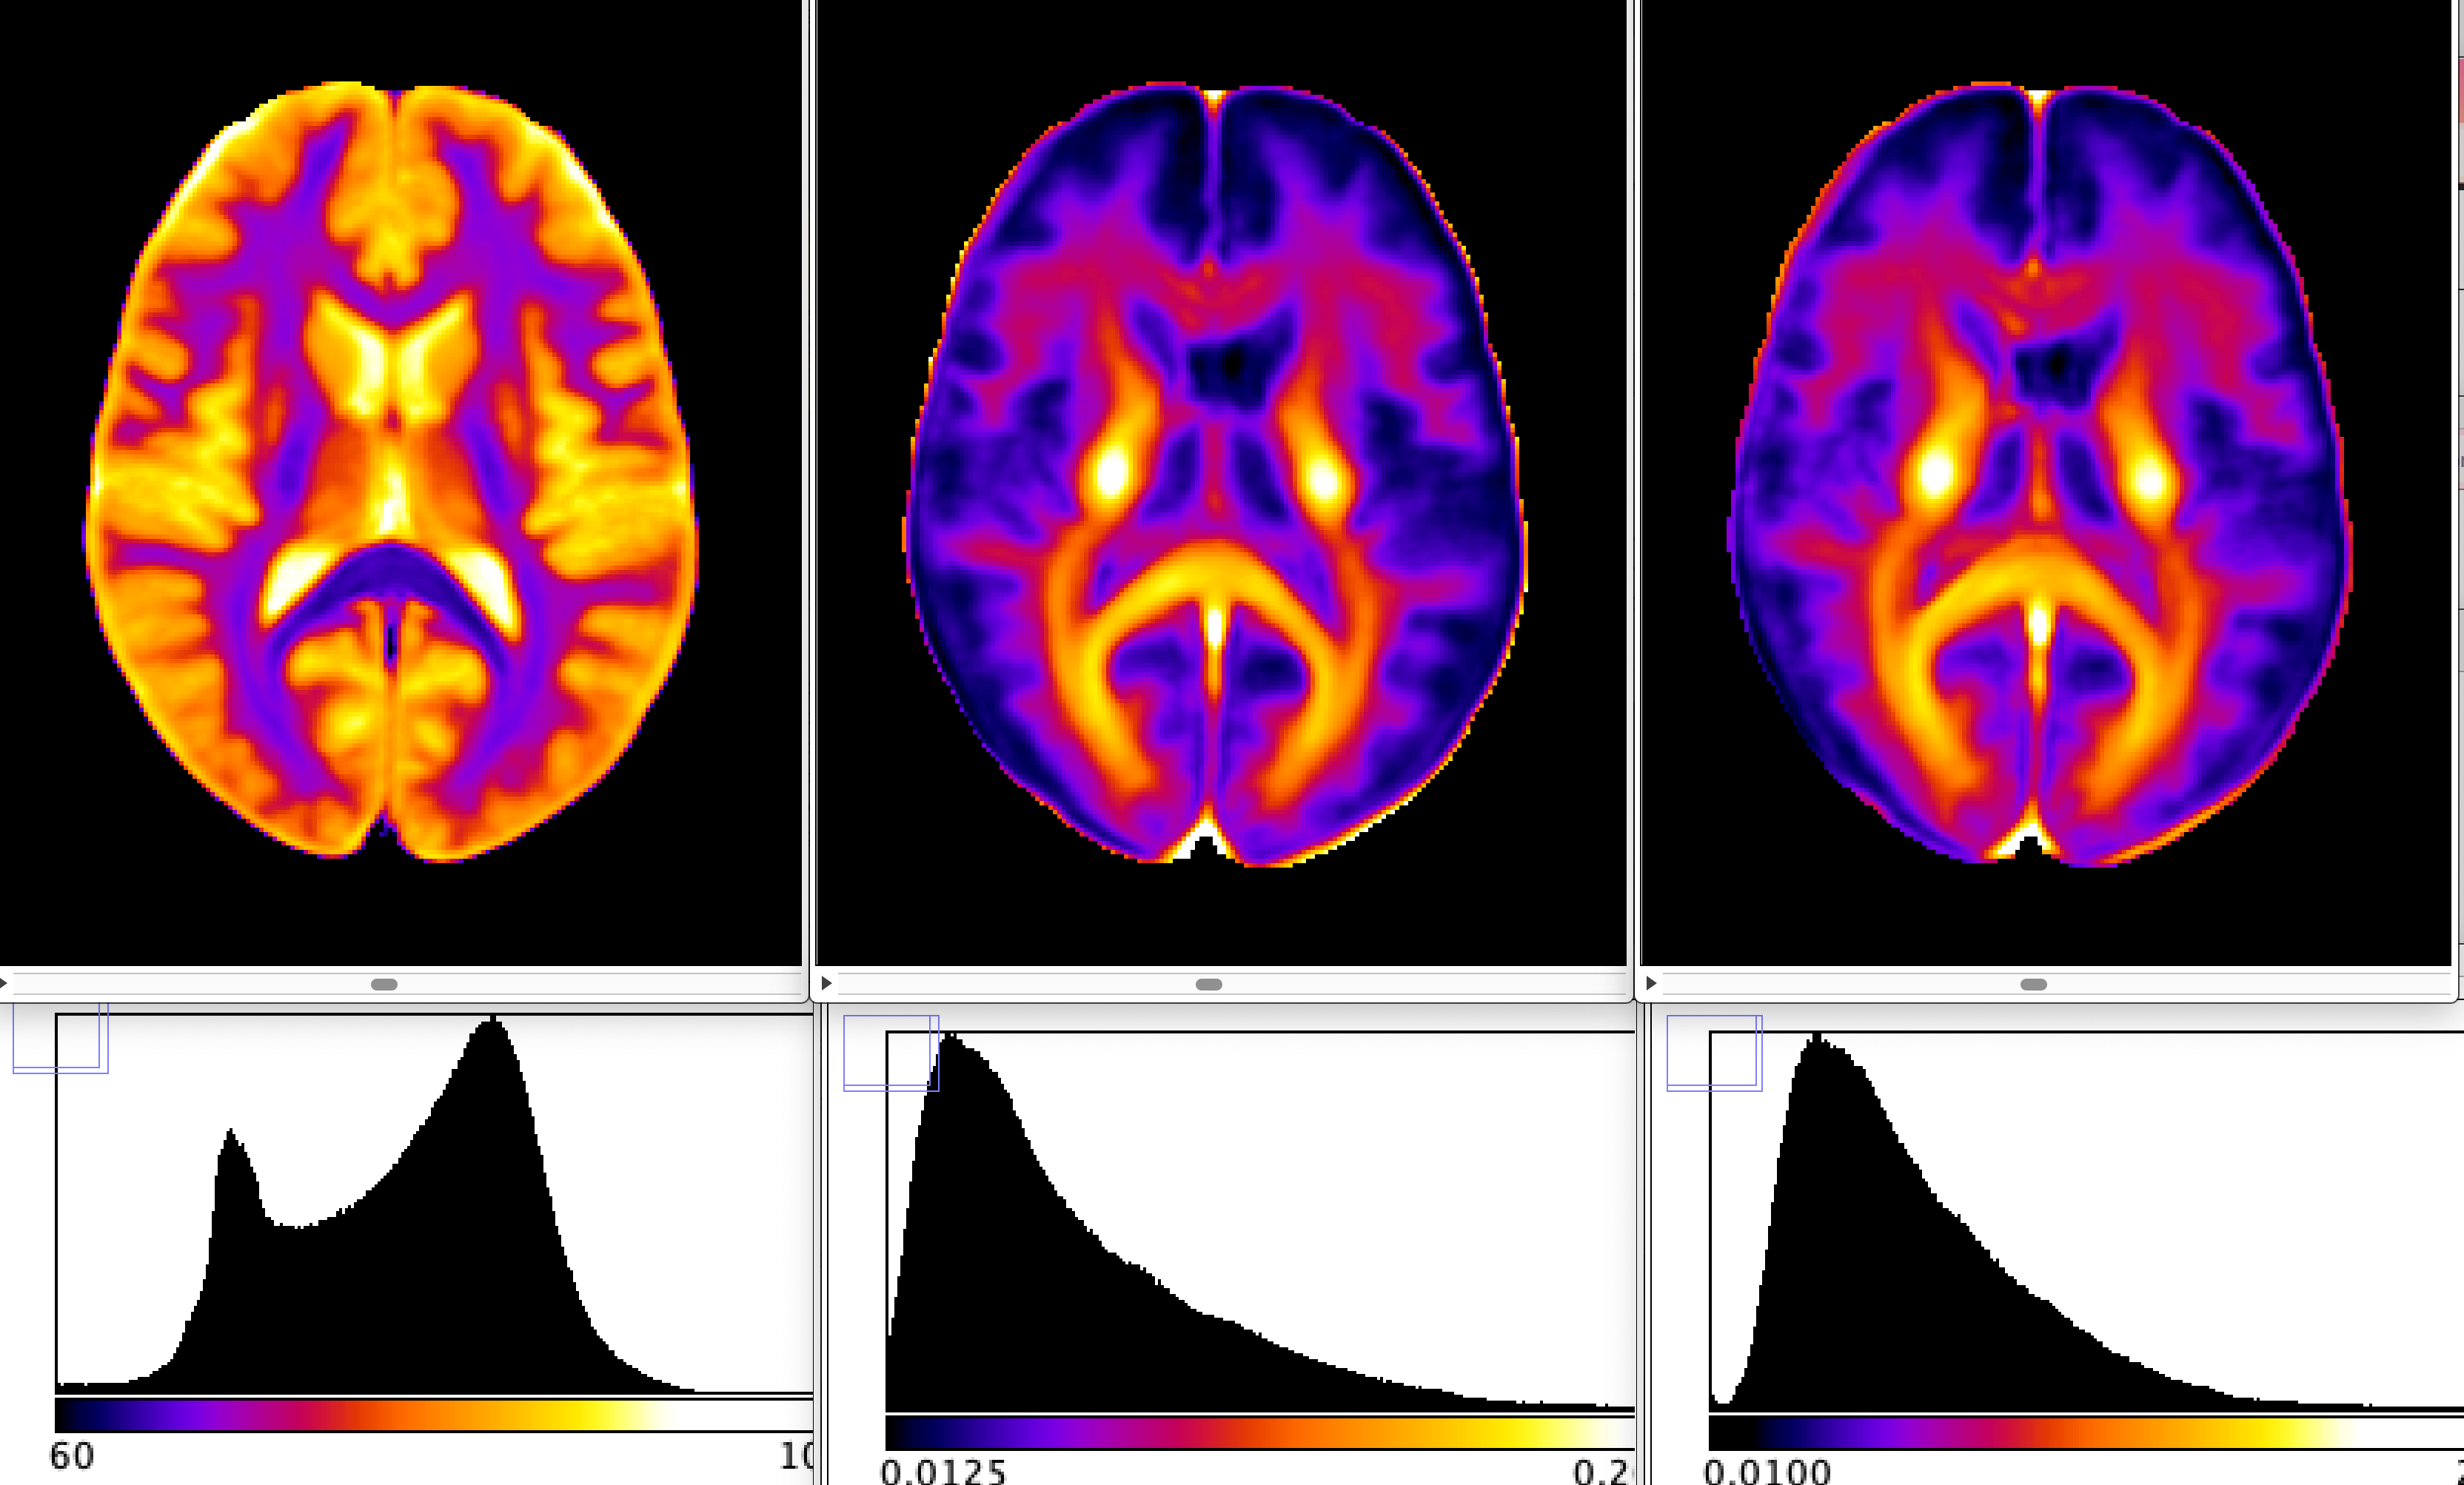
Water content-related maps. From left to right: total tissue water content H2O, myelin water fraction MWF, and myelin water calculated as MW=MWF*H2O. We show the same slice from all 3 atlases calculated in MNI space. All participants from both studies were of Caucasian descent for at least two generations, the majority of them being German, had no history of psychiatric or neurological disorders, matched the standard inclusion criteria for MRI examinations and gave written informed consent. Both studies were approved by the local ethics committees.