0296
MicroCoP: digital Microstructure Correlation Phantoms for benchmarking of multicomponent MRI methods
Sebastian Endt1,2,3,4, Carolin M Pirkl3, Marco Palombo4, and Marion I Menzel1,2,3
1AImotion Bavaria, Technische Hochschule Ingolstadt, Ingolstadt, Germany, 2Technical University of Munich, Munich, Germany, 3GE HealthCare, Munich, Germany, 4Cardiff University Brain Research Imaging Center (CUBRIC), Cardiff University, Cardiff, United Kingdom
1AImotion Bavaria, Technische Hochschule Ingolstadt, Ingolstadt, Germany, 2Technical University of Munich, Munich, Germany, 3GE HealthCare, Munich, Germany, 4Cardiff University Brain Research Imaging Center (CUBRIC), Cardiff University, Cardiff, United Kingdom
Synopsis
We present MicroCoP, a flexible tool for the generation of digital Microstructure Correlation Phantoms that can be used to benchmark multicomponent MRI reconstruction methods. The phantoms provide ground-truth distributions for the MR tissue parameters of your choice. These can be fed into forward simulations and thus provide a pair of ground-truth distributions and resulting signal evolutions to thoroughly evaluate multicomponent MRI reconstruction methods.
Introduction
Neuroinflammation is connected to a variety of neurodegenerative diseases like Parkinson’s, Alzheimer’s and multiple sclerosis (MS)[1, 2, 3]. By quantifying the MR properties (e.g. T1 and T2 relaxation times or the diffusion coefficient D) and/or volume fractions of different tissue components like myelin water and intra-/extra-cellular space, it is possible to identify and distinguish neuroinflammation and neurodegeneration [4]. We believe that multicomponent MRI, e.g. via correlation imaging, is a promising technique to achieve this goal. However, lacking ground-truth results for in-vivo data, it is essential to objectively evaluate reconstruction methods on synthetic data sets. We aim to address this unmet need by providing the community with an openly accessible tool to generate digital microstructure phantoms for this purpose. The new tool we present here is called MicroCoP: Microstructure Correlation Phantom.Methods
MicroCoP is implemented in Matlab (The MathWorks, Inc., Natick, USA) and tested with versionR2021a. The pipeline for generation of a phantom (shown in fig. 1) is:- Inputs: 1) Segmentations of an MRI slice or 3D volume into multiple tissue classes. The exemplary brain phantoms presented here (fig. 2) are based on segmenations from the BrainWeb: Simulated Brain Database (https://brainweb.bic.mni.mcgill.ca/brainweb/) [5, 6, 7, 8], including (normal appearing) white matter ((NA)WM), gray matter (GM), cerebrospinal fluid (CSF) and several MS lesions. In the second example (fig. 2b) a ring enhancement around a lesions is segmented as well, to simulate e.g. chronic active lesions with ongoing neuroinflammation. 2) The user has to provide several parameters: the quantitative tissue parameters of interest, the grid for the spectra and a set of sub-compartments for each tissue-class. For each sub-compartment, the mean parameters and volume fraction have to be defined.
- Parameter map generation: For every voxel and sub-compartment, tissue parameters (e.g. T1 and T2) and volume fractions are assigned. Random voxel-to-voxel variations can be adjusted as well.
- Compartmental volume fraction maps: From segmentations and volume fractions, compartmental volume fraction maps for every sub-compartment in every tissue class are generated (fig. 2). They can be used as a ground-truth later on.
- Generation of 1D spectra: Towards the generation of spectra, first 1D spectra for every sub-compartment are generated using a Gaussian peak around the given mean parameter. The standard deviation can be adjusted.
- Generation of 2D spectra: For every sub-compartment, the 1D spectra are now combined into a 2D correlation spectra.
- Phantom assembly: Finally, spectra of sub-compartments are added up and weighted by the respective volume fractions to yield the full spectra comprising multiple sub-compartments (i.e. peaks) in every voxel. Examples are shown in figure 4.
Discussion
With the MicroCoP tool, we introduce a framework for the generation of digital microstructure phantoms with high flexibility. It can be used to simulate different neuroinflammation scenarios and investigate the sensitivity and specificity of multidimensional MRI experiments and reconstruction approaches. Examples presented here include the quantification and monitoring of MS lesions and the detection of paramagnetic rims, hallmarks of chronic active lesions (fig. 2).Extending on brain studies, arbitrarily oriented segmentations of any organ, comprising any sort and number of tissue-classes and sub-compartments, can be used as a basis. This creates a broad field of potential applications. Further, our framework allows the incorporation of any tissue parameters,including but not limited to T1ρ, directional diffusion dependence, anisotropy, axon g-ratio, susceptibility, etc. Here we show T1-T2 and T2*-D correlation as an example (fig. 3).
As the forward simulation of MR signals must be tailored to the specific MR experiment, we deliberately leave this simulation to the user. To that end, the resulting spectra can serve as input for different models and tools, like Bloch or Bloch-Torrey equations, extended phase graphs, or the continuous configuration model [9, 10, 11, 12]. Together with simulated signals, our phantoms can be used for supervised training of neural networks, adding spatial context that previous publications were lacking [13, 14, 15], albeit promising better results [16].
While MicroCoP was designed for non-parametric approaches, the intermediate steps along the phantom generation can directly be used for parametric methods, e.g. fitting of a biophysical 3-pool model [17]. We offer 1D and 2D spectra (fig. 3), two widely spread variants of multicomponent MRI, which can be combined to further facilitate the reconstruction [18]. An extension to 3D is not yet included, but planned for the near future. However, the combination of high-resolution or 3D segmentations with densely sampled spectra can be limited by system memory.
A Python implementation of the project is planned for the future, making it available to even more researchers. The project source code will be made openly available on the first author’s GitHub upon publication of this work.
Acknowledgements
SE was supported by the German Research Foundation (DFG) within the Research Training Group GRK 2274. CMP and MIM receive funding from the European Union’s Horizon 2020 research and innovation programme under grant agreement No. 952172. MP is supported by UKRI Future Leaders Fellowship (MR/T020296/2).2References
[1] C.J. Barnum and M.G. Tansey. Neuroinflammation and non-motor symptoms: the dark passenger of parkinson’s disease? Current neurology and neuroscience reports, 12:350–358, 2012.[2] M.A. Meraz-R´ıos, D. Toral-Rios, D. Franco-Bocanegra, J. Villeda-Hern´andez, and V. Campos-Pe˜na. Inflammatory process in alzheimer’s disease. Frontiers in integrative neuroscience, 7:59, 2013.
[3] I. Bjelobaba, D. Savic, and I. Lavrnja. Multiple sclerosis and neuroinflammation: the overview of current and prospective therapies. Current pharmaceutical design, 23(5):693–730, 2017.
[4] O. Pasternak, M. Kubicki, and M.E. Shenton. In vivo imaging of neuroinflammation in schizophrenia. Schizophrenia Research, 173(3):200–212, 2016. Progressive Brain Tissue Loss in Schizophrenia.
[5] R.K.-S. Kwan, A.C. Evans, and G.B. Pike. An extensible MRI simulator for post-processing evaluation. In Visualization in Biomedical Computing: 4th International Conference, VBC’96 Hamburg, Germamy, September 22–25, 1996 Proceedings, pages 135–140. Springer, 1996.
[6] C.A. Cocosco. Brainweb: Online interface to a 3D MRI simulated brain database. NeuroImage, 5, 1997.
[7] D.L. Collins, A.P. Zijdenbos, V. Kollokian, J.G. Sled, N.J. Kabani, C.J. Holmes, and A.C. Evans. Design and construction of a realistic digital brain phantom. IEEE Transactions on Medical Imaging, 17(3):463–468, 1998.
[8] R.K.-S. Kwan, A.C. Evans, and G.B. Pike. MRI simulation-based evaluation of image-processing and classification methods. IEEE transactions on medical imaging, 18(11):1085–1097, 1999.
[9] F. Bloch. Nuclear induction. Phys. Rev., 70:460–474, Oct 1946.
[10] H.C. Torrey. Bloch equations with diffusion terms. Phys. Rev., 104:563–565, Nov 1956.
[11] M. Weigel. Extended phase graphs: dephasing, RF pulses, and echoes-pure and simple. Journal of Magnetic Resonance Imaging, 41(2):266–295, 2015.
[12] C. Ganter. Configuration space representation of MRI sequences. Magnetic Resonance in Medicine, 87(4):2034–2043, 2022.
[13] S. Endt, C.M. Pirkl, C. Mayrink Verdun, B.H. Menze, and M.I. Menzel. A deep learning approach to accelerated T1-T2-relaxation-correlation imaging. In European Society for Magnetic Resonance in Medicine and Biology (ESMRMB) 2020 Online, 37th Annual Scientific Meeting, volume 33, page 26, 2020.
[14] T. Yu, E.J. Canales-Rodr´ıguez, M. Pizzolato, G.F. Piredda, T. Hilbert, E. Fischi-Gomez, M.Weigel, M. Barakovic, M.B. Cuadra, C. Granziera, T. Kober, and Thiran J.-P. Model-informed machine learning for multi-component T2 relaxometry. Medical Image Analysis, 69:101940, 2021.
[15] S. Endt, C.M. Pirkl, C. Mayrink Verdun, B.H. Menze, and M.I Menzel. Unmixing tissue compartments via deep learning T1-T2-relaxation correlation imaging. In 17th International Symposium on Medical Information Processing and Analysis, volume 12088, pages 218–227. SPIE, 2021.
[16] D. Kim, E.K. Doyle, J.L. Wisnowski, J.H. Kim, and J.P. Haldar. Diffusion-relaxation correlation spectroscopic imaging: a multidimensional approach for probing microstructure. Magnetic Resonance in Medicine, 78(6):2236–2249, 2017.
[17] Jack L Lancaster, Trevor Andrews, L Jean Hardies, Stephen Dodd, and Peter T Fox. Three pool model of white matter. Journal of Magnetic Resonance Imaging: An Official Journal of the International Society for Magnetic Resonance in Medicine, 17(1):1–10, 2003.
[18] D. Benjamini and P.J. Basser. Use of marginal distributions constrained optimization (MADCO) for accelerated 2D MRI relaxometry and diffusometry. Journal of Magnetic Resonance, 271:40–45, 2016.
Figures
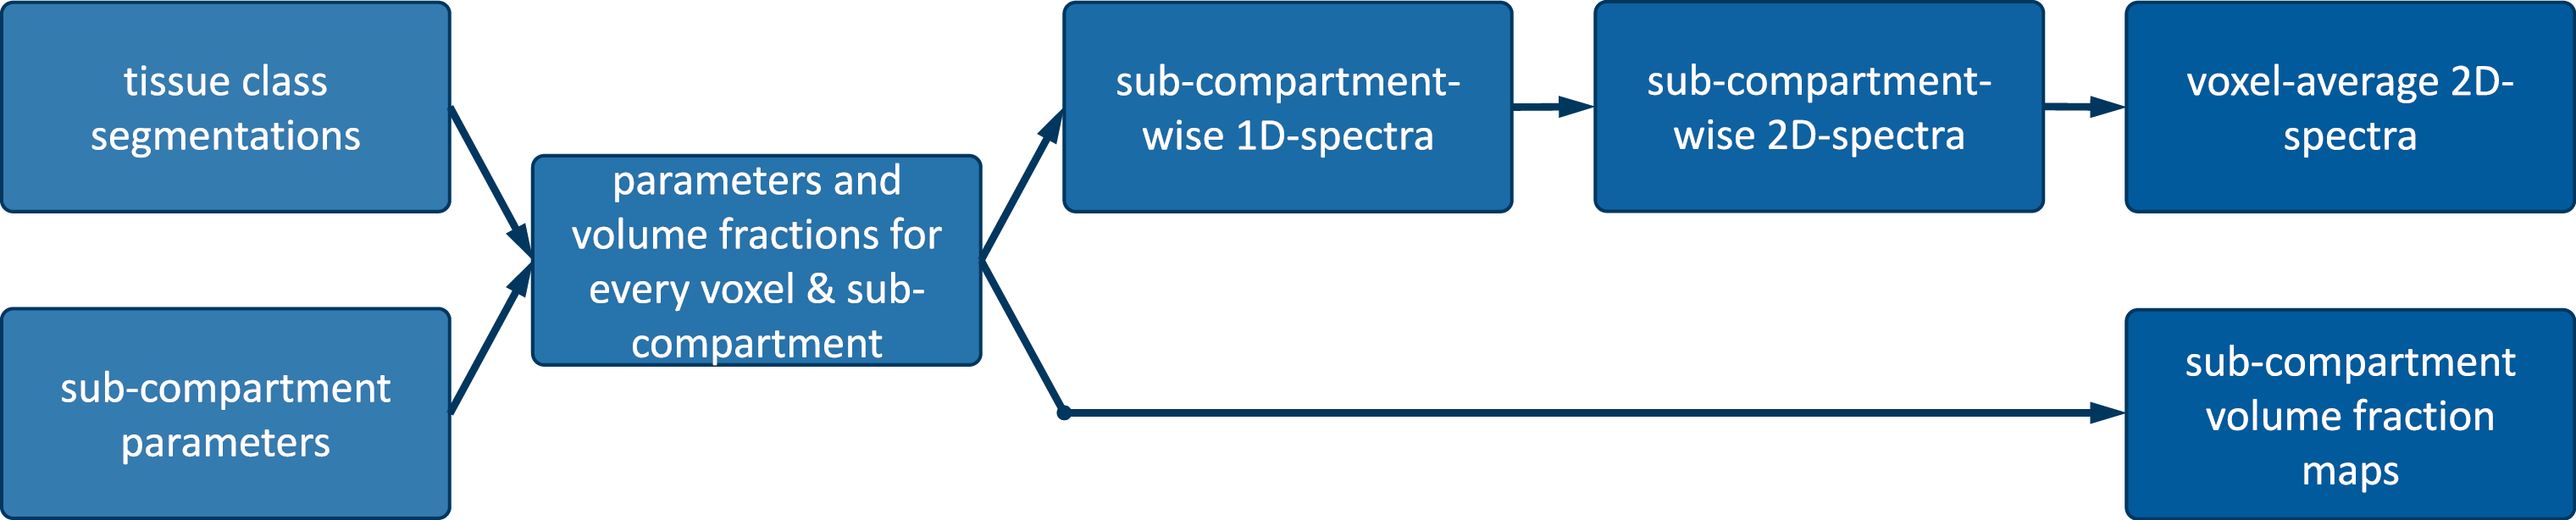
Figure 1: MicroCoP pipeline: Based on tissue class segmentations and sub-compartments’ properties (tissue parameters and volume fractions), parametric maps of every sub-compartment are generated.Then 1D spectra with a single Gaussian are created for each sub-compartment and combined into 2D spectra. Finally, sub-compartment spectra are weighted with their volume fraction and summed up to voxel-average 2D spectra with multiple Gaussians. Compartmental volume fractions maps form the second output.
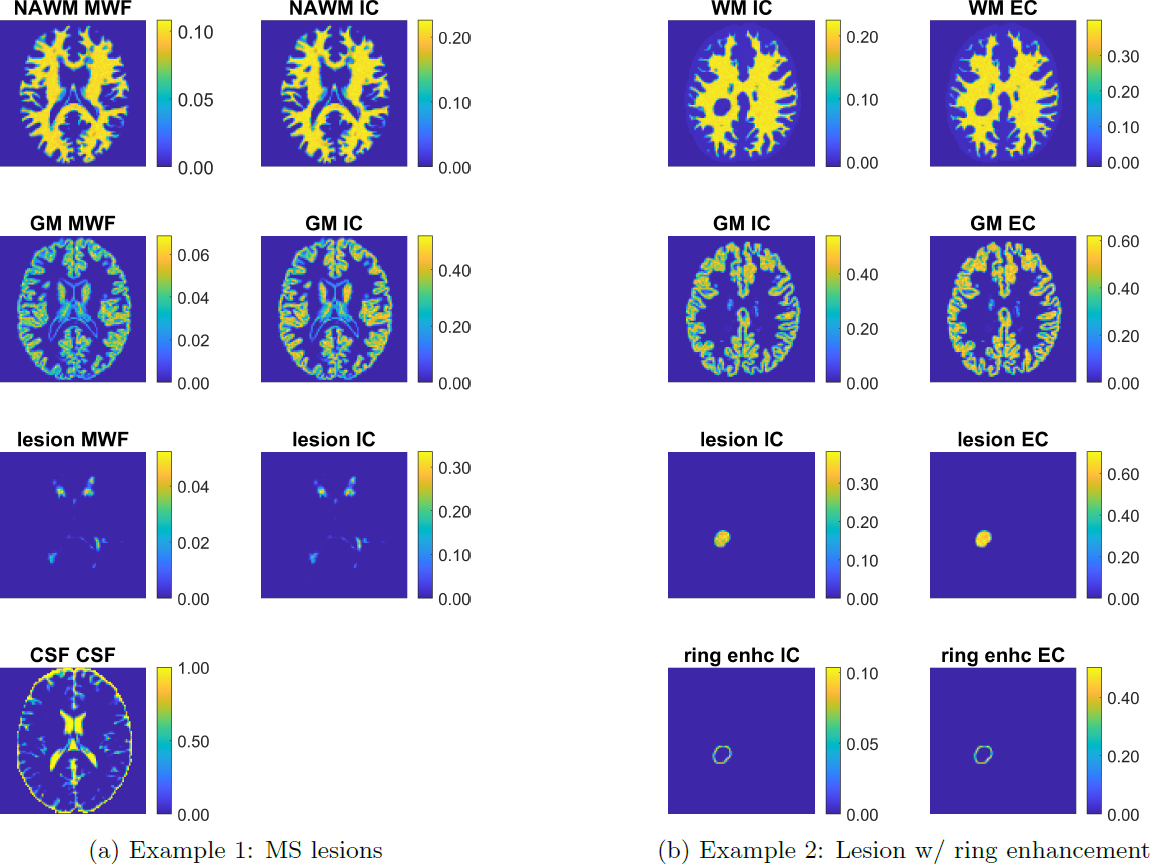
Figure 2: Compartmental volume fractions maps of two exemplary microstructure phantoms. (a):Brain with severe MS lesions, divided into tissue classes (rows) NAWM, GM, CSF and lesion. Sub-compartments (columns) include MWF, IC, EC (not shown) and CSF. (b) Brain with a circular lesion, divided into tissue classes WM, GM, lesion and ring enhancement; each comprising the sub-compartments IC and EC. CSF is not shown.
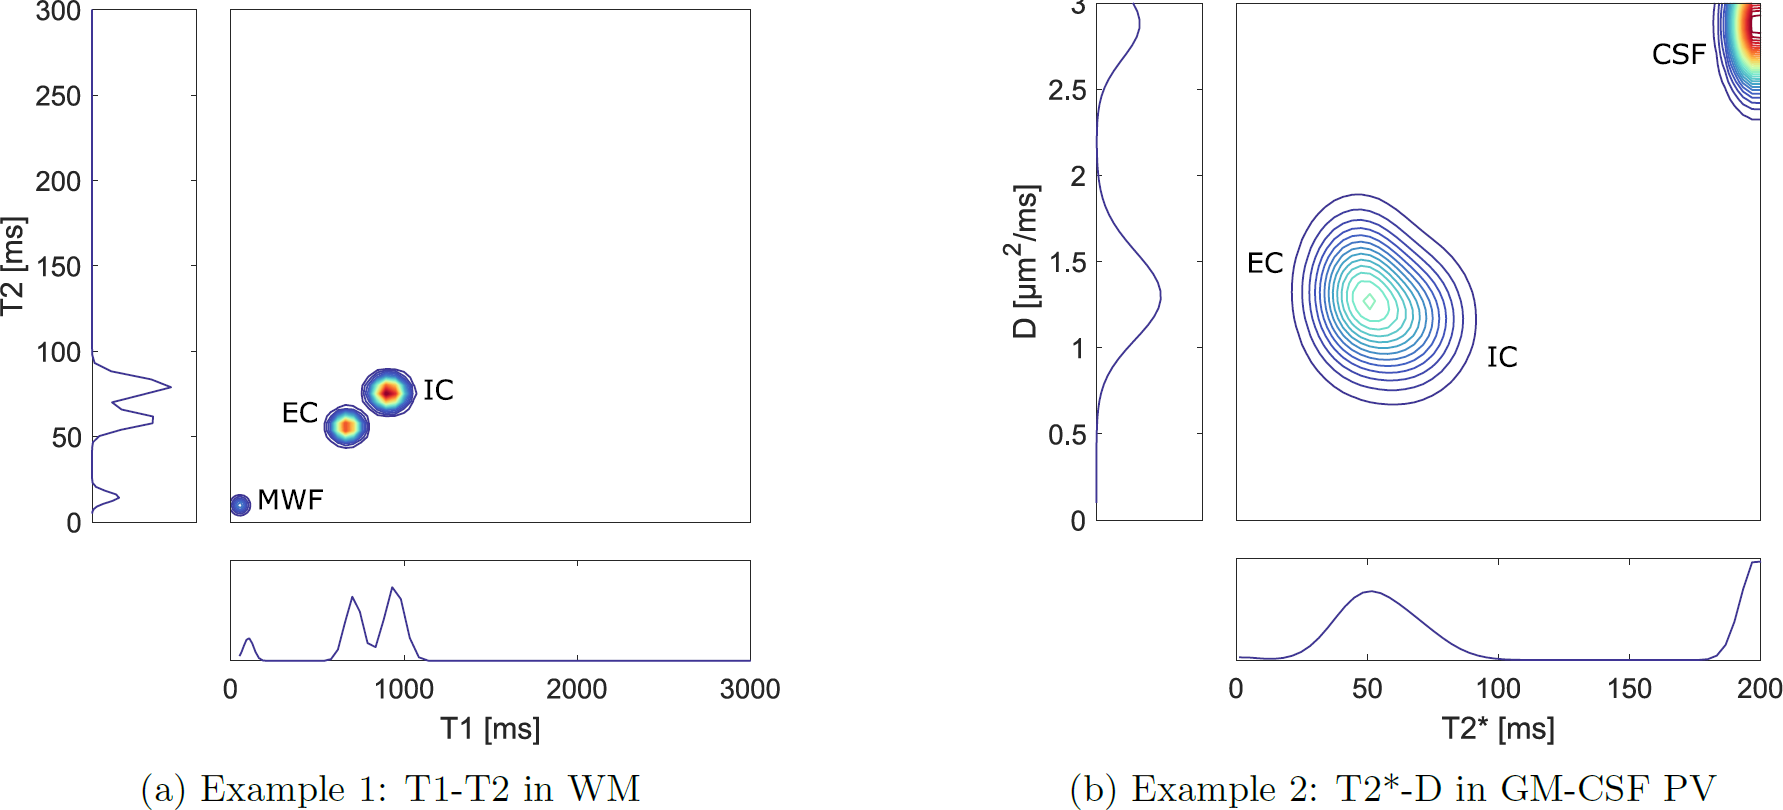
Figure 3: Exemplary 2D-correlation spectra and the corresponding 1D-spectra with multiple sub-compartments. (a): T1-T2 spectrum of a WM voxel, comprising the sub-compartments MWF, IC and EC. The 2D spectrum is defined by a quadratically spaced T1-T2-grid and filled with narrow Gaussian distributions. (b): T2*-D-spectrum of a GM-CSF partial volume (PV) comprising the sub-compartmentsIC, EC and CSF. Here we chose a linear grid and wider Gaussians.
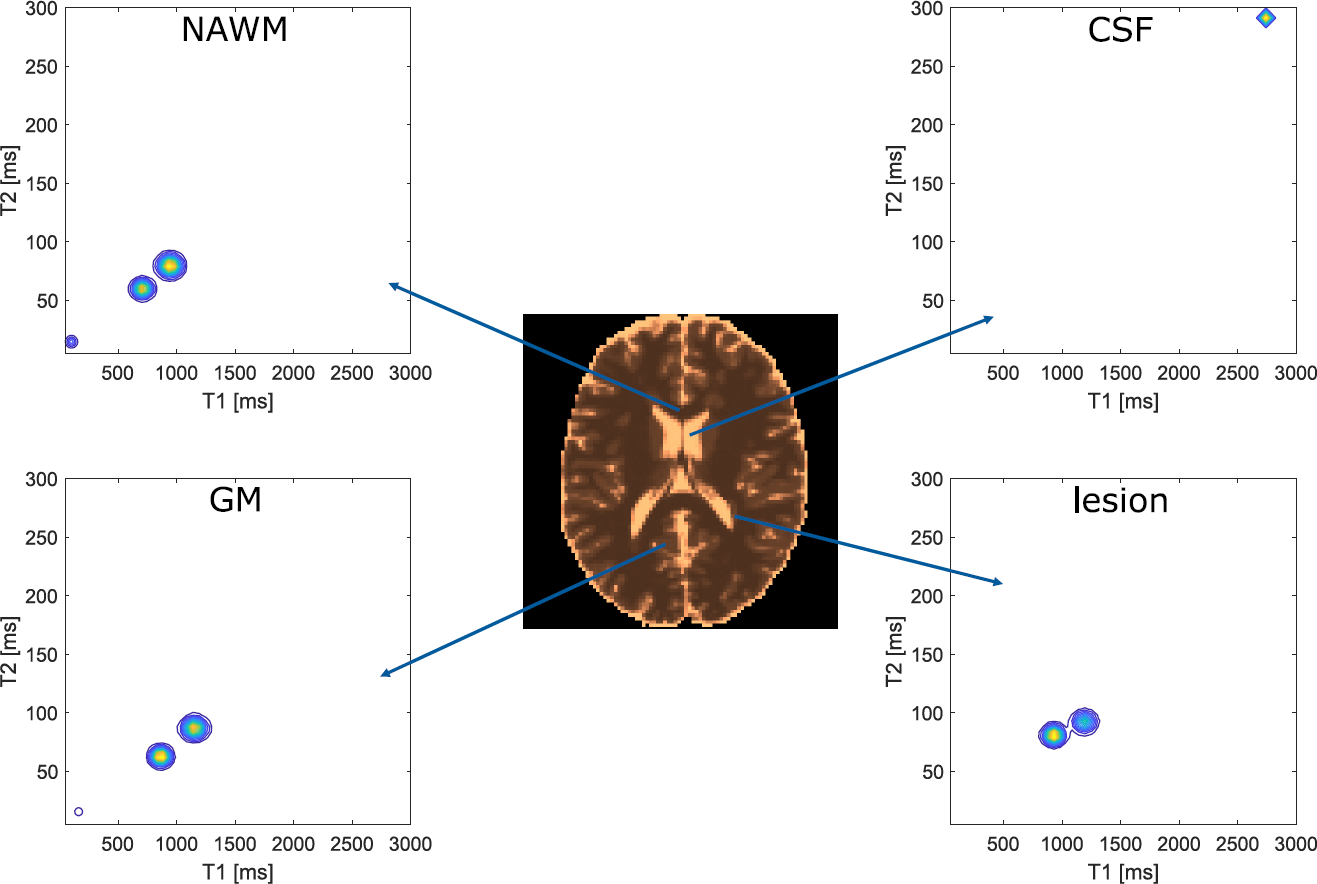
Figure 4: T1-map as resulting from our exemplary phantom with MS lesions and exemplary single-voxel T1-T2 correlation spectra for all four tissue classes. Note: The spectra shown here demonstrate the capabilities of MicroCoP and do not represent actual measurements.
DOI: https://doi.org/10.58530/2023/0296