0295
ADVANCED DIFFUSION IMAGING METHODS TO ASSESS THE MICROSTRUCTURE OF MULTIPLE SCLEROSIS LESIONS1Neuroinflammation Imaging Lab, Université catholique de Louvain, Brussels, Belgium, 2ICTEAM Institute, Université catholique de Louvain, Louvain-la-Neuve, Belgium
Synopsis
Paramagnetic Rim Lesions (PRL) in Multiple Sclerosis (MS) are associated with increased disability and axonal damage. We examined PRL microstructure using Track Density Imaging (TDI) and four diffusion MRI (dMRI) models, including Microstructure Fingerprinting (MF). When compared to non-PRL, PRL showed larger size, higher T1-values, lower neurite density index and fibre volume fraction on dMRI (p < 0.001) and reduced track density on TDI (p < 0.0001), suggesting impaired axonal density/integrity in PRL. Results obtained with the novel MF model are in line with those obtained with other dMRI models, indicating its potential for studying MS lesion pathology.
Introduction
Chronic active multiple sclerosis (MS) lesions, seen on susceptibility-based (SWI) MRI as Paramagnetic Rim Lesions (PRL) (Figure 2), are associated with increased clinical disability and axonal damage.1,2 Diffusion MRI (dMRI) can characterize in vivo PRL’s tissue damage,3 however the tissue microstructure specificity of dMRI models is limited. Here, we characterized PRL’s microstructure using Track Density Imaging (TDI)4 and 4 different models, including one novel dMRI model, Microstructure Fingerprinting (MF).5 Compared to other commonly used diffusion models, which are based on the optimization of complex analytical equations, MF uses Monte-Carlo simulations of water molecule diffusion in complex 3D white matter (WM) numerical configurations. To our knowledge, MF and TDI have never been used to depict the microstructure of MS lesions.Methods
In 44 MS patients (27 relapsing-remitting, 11 secondary progressive, 6 primary progressive) 367 lesions (202 PRL and 165 non-PRL) were detected on 3T high-resolution isotropic 3D T2*-weighted Echo Planar Imaging (EPI)6 unwrapped-phase images and segmented on FLuid Attenuated Inversion Recovery (FLAIR) images. Each patient as well as 7 Healthy Controls (HC) underwent a multishell diffusion-weighted imaging (TR=4842 ms, TE=77 ms, ∆=35.7 ms, δ=22.9 ms, 64 gradients at b=1000, 32 at b=2000,3000,5000 s/mm2). For each lesion, we calculated the volume, we computed quantitative T1 values on Magnetization Prepared 2 Rapid Acquisition Gradient Echoes (MP2RAGE) derived T1 maps,7 and we extracted diffusion parameters using 4 dMRI models: Diffusion Tensor Imaging (DTI),8 Neurite Orientation Dispersion and Density Imaging (NODDI),9 DIstribution of Anisotropic MicrOstructural eNvironments in DWI (DIAMOND)10 and MF.For the TDI, a tractogram of 1 Million tracts was probabilistically generated for every subject using Multishell multi-tissue constrained spherical deconvolution (MSMT-CSD).11 Spherical-deconvolution Informed Filtering of Tractograms (SIFT)12 was then used to select the most probable 200000 tracts and compute a TDI image. Finally, after MNI-space registration, patient TDI images were spatially z-score normalized according to the mean HC TDI image, in order to ensure a corrected track density estimation for different brain regions.
Results
PRL were bigger (p < 0.001) and featured higher T1-values (p < 0.001) vs non-PRL. The DTI and DIAMOND models showed lower fractional anisotropy, higher mean diffusivity and radial diffusivity in PRL vs non-PRL (p < 0.001); NODDI and MF models showed respectively lower neurite density index and lower weighted fibre volume fraction (Figure 1, p <0.001), suggesting impaired axonal integrity/density in PRL vs non-PRL. The TDI analysis showed reduced track density in PRL vs non-PRL lesions (p < 0.0001, Figure 2).Conclusion
Consistent with previous data,3,13 we show that PRL are characterized by higher axonal damage when compared to non-PRL. Results derived from the MF model and TDI are in line with those obtained with DTI, NODDI and DIAMOND, suggesting that these advanced and complex diffusion imaging methods can be used to study MS lesion pathology. As an advantage, both MF and TDI pathological specificity can be respectively improved by computing more accurate numerical models of the brain WM microstructure,5 and by ameliorating tractogram generation.Acknowledgements
No acknowledgement found.References
1. Absinta, M. et al. Association of Chronic Active Multiple Sclerosis Lesions With Disability In Vivo. JAMA Neurol. 76, 1474–1483 (2019).
2. Maggi, P. et al. Chronic White Matter Inflammation and Serum Neurofilament Levels in Multiple Sclerosis. Neurology 97, e543–e553 (2021).
3. Rahmanzadeh, R. et al. Myelin and axon pathology in multiple sclerosis assessed by myelin water and multi-shell diffusion imaging. Brain J. Neurol. 144, 1684–1696 (2021).
4. Calamante, F., Tournier, J.-D., Jackson, G. D. & Connelly, A. Track-density imaging (TDI): super-resolution white matter imaging using whole-brain track-density mapping. NeuroImage 53, 1233–1243 (2010).
5. Rensonnet, G. et al. Towards microstructure fingerprinting: Estimation of tissue properties from a dictionary of Monte Carlo diffusion MRI simulations. NeuroImage 184, 964–980 (2019).
6. Sati, P. et al. Rapid, high-resolution, whole-brain, susceptibility-based MRI of multiple sclerosis. Mult. Scler. J. 20, 1464–1470 (2014).
7. Marques, J. P. et al. MP2RAGE, a self bias-field corrected sequence for improved segmentation and T1-mapping at high field. NeuroImage 49, 1271–1281 (2010).
8. Basser, P. J., Mattiello, J. & Lebihan, D. Estimation of the Effective Self-Diffusion Tensor from the NMR Spin Echo. J. Magn. Reson. B 103, 247–254 (1994).
9. Zhang, H., Schneider, T., Wheeler-Kingshott, C. A. & Alexander, D. C. NODDI: Practical in vivo neurite orientation dispersion and density imaging of the human brain. NeuroImage 61, 1000–1016 (2012).
10. Scherrer, B. et al. Characterizing the distribution of anisotropic micro-structural environments with diffusion-weighted imaging (DIAMOND). Med. Image Comput. Comput.-Assist. Interv. MICCAI Int. Conf. Med. Image Comput. Comput.-Assist. Interv. 16, 518–526 (2013).
11. Jeurissen, B., Tournier, J.-D., Dhollander, T., Connelly, A. & Sijbers, J. Multi-tissue constrained spherical deconvolution for improved analysis of multi-shell diffusion MRI data. NeuroImage 103, 411–426 (2014).
12. Smith, R. E., Tournier, J.-D., Calamante, F. & Connelly, A. SIFT: Spherical-deconvolution informed filtering of tractograms. NeuroImage 67, 298–312 (2013).
13. Rahmanzadeh, R. et al. A New Advanced MRI Biomarker for Remyelinated Lesions in Multiple Sclerosis. Ann. Neurol. 92, 486–502 (2022).
Figures
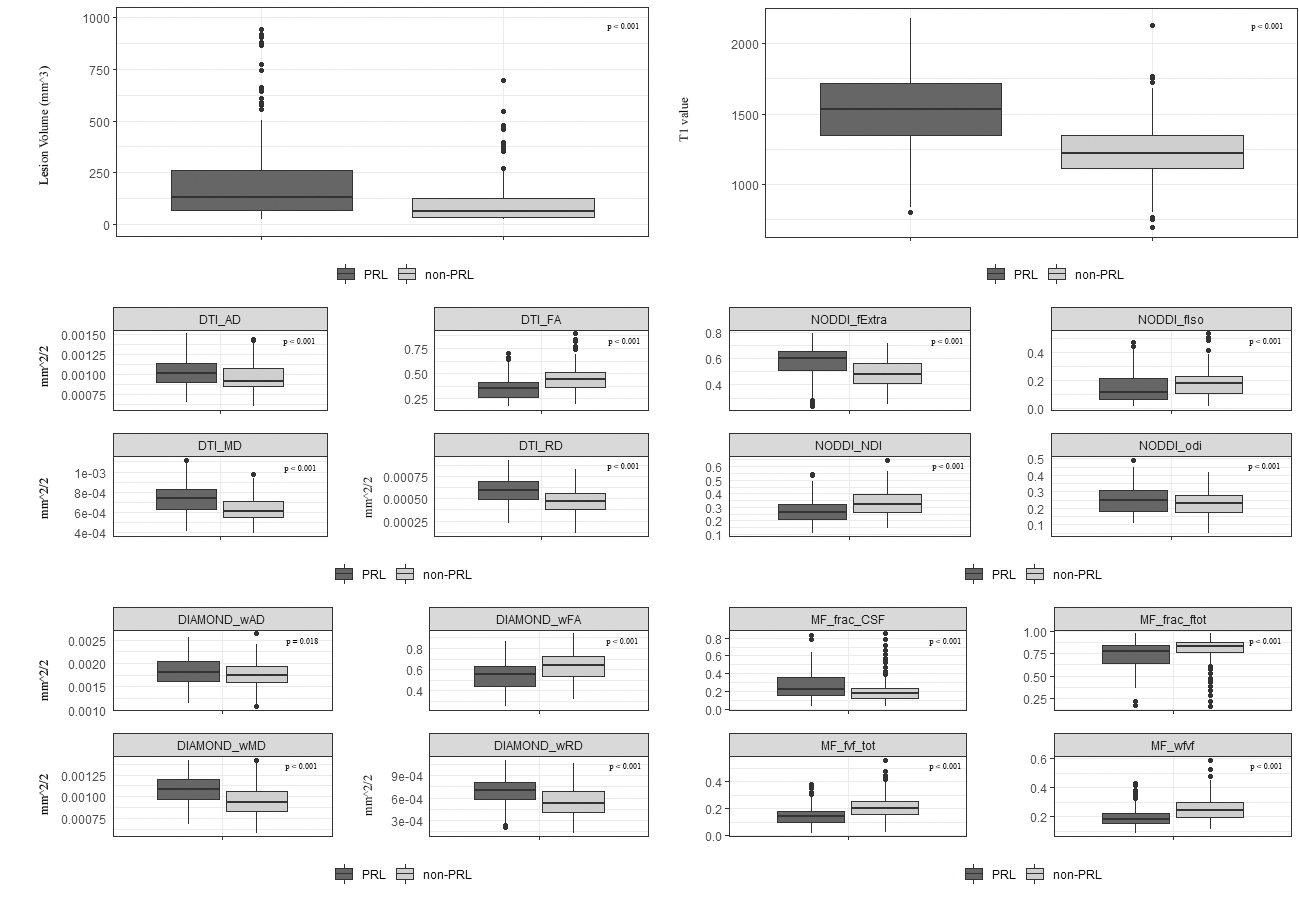
Abbreviations: NODDI_fExtra: NODDI Fraction Extracellular NODDI_NDI: NODDI Neurite Density Index NODDI_fIso: NODDI Free Water Volume Fraction NODDI_odi: NODDI Orientation Dispersion Index DIAMOND_wAD: DIAMOND Axial Diff. DIAMOND_wFA: DIAMOND Fractional Anisotropy DIAMOND_wMD: DIAMOND Mean Diff. DIAMOND_wRD: DIAMOND Radial Diff. MF_frac_CSF: MF fraction CSF MF_frac_ftot: MF Total Tissue Fraction MF_fvf_tot: MF Total Fibre Volume Fraction MF_wfvf: MF Weighted Fibre Volume Fraction
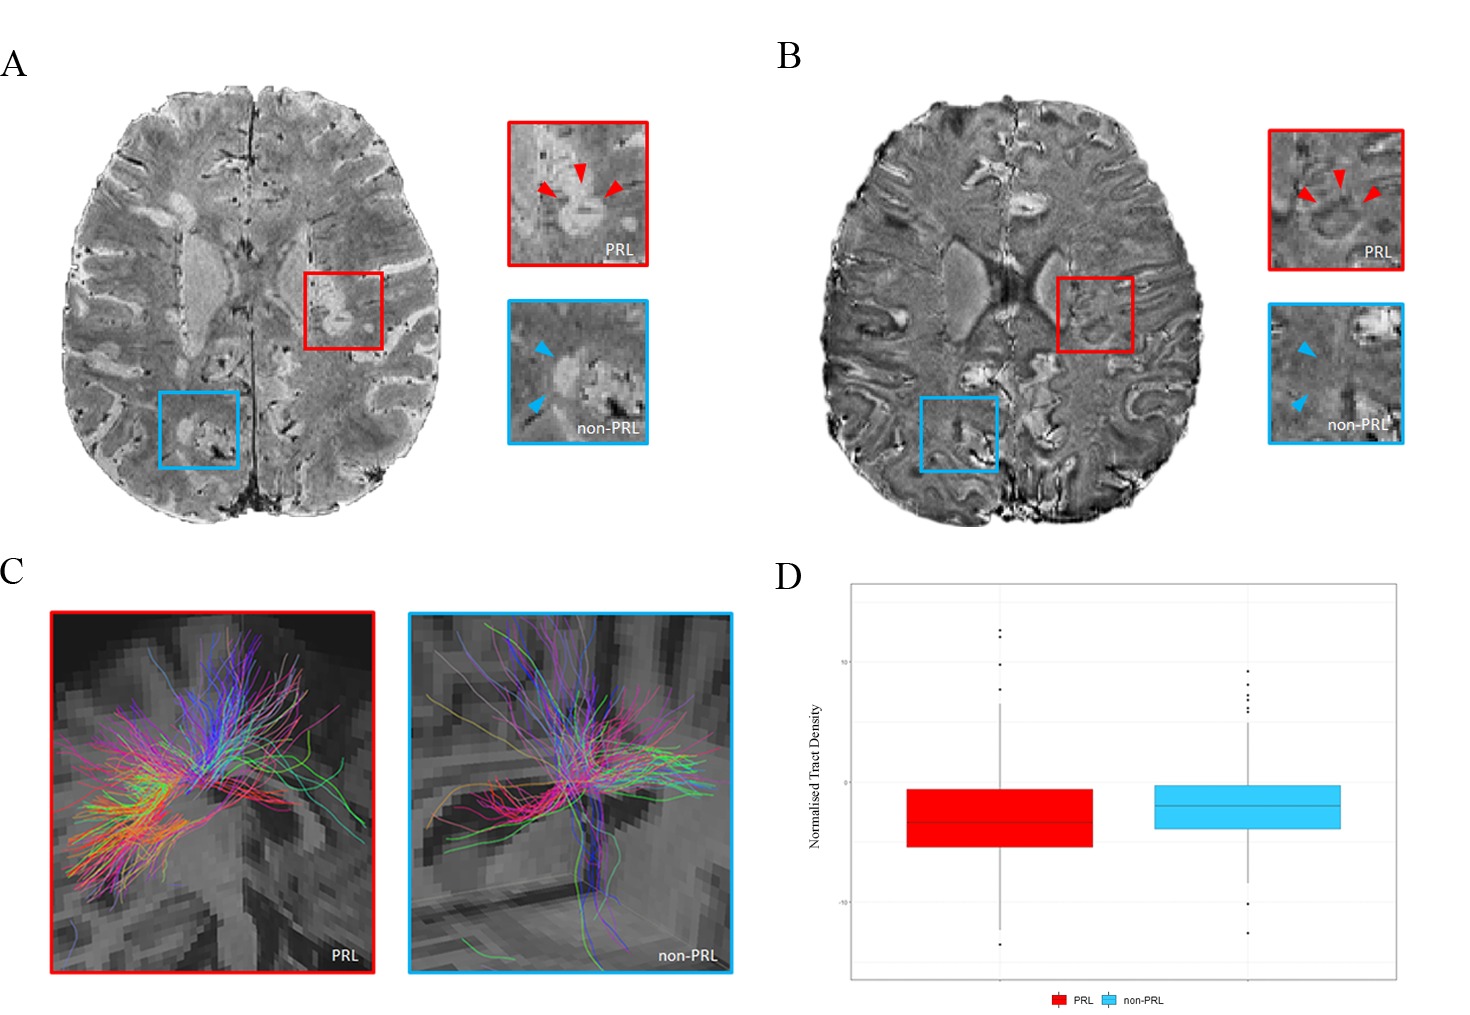
PRL vs non-PRL susceptibility-based MRI and Tractography.
A Susceptibility-based magnitude image with hyperintense lesions. B PRL lesions with hypointense rim (red box and arrowheads) on susceptibility-based phase image due to iron-laden macrophage/microglia accumulation at the lesion edge. No visible rim in non-PRL lesions (blue box and arrowheads). C Tractography of PRL vs non-PRL, with prominent disruption of fibre tracts within PRLs D Normalised Tract Density in PRL vs non-PRL.