0294
Tracking evolution of multiple sclerosis lesions during medication switch: a quantitative multiparametric 7T MRI approach1Radiology, Melbourne Brain Centre Imaging Unit, University of Melbourne, Melbourne, Australia, 2Biomedical Engineering, University of Melbourne, Melbourne, Australia, 3Neuroimmunology and Remyelination Laboratory, Florey Institute for Neuroscience and Mental Health, Melbourne, Australia, 4Florey Department of Neuroscience and Mental Health, University of Melbourne, Melbourne, Australia, 5Neurology, Royal Melbourne Hospital, Melbourne, Australia, 6Research Partnerships & Translation, RMIT University, Melbourne, Australia, 7Radiology, University of Melbourne, Melbourne, Australia, 8Radiology, Royal Melbourne Hospital, Melbourne, Australia
Synopsis
Multiple sclerosis patients may need to switch disease modifying treatments due to various reasons, with risk of recurrent disease activity during transition period. Identifying patients at risk is challenging. In this pilot study we used a non-conventional quantitative multi-modal 7T MRI approach to assess evolution of lesions when switching medication. We observed altered diffusion, susceptibility and T1 values three months after stopping, and these metrics returning to baseline values three months after starting new medication. Multi-modal quantitative MR techniques at ultra-high field MRI may be more sensitive to detect subtle changes over time to potentially better inform underlying disease activity.
Introduction
Multiple sclerosis (MS) is a debilitating and progressive disease of the brain and spinal cord, characterized by inflammation, demyelination, and axonal injury and loss. Disease-modifying therapies (DMT) are aimed to prevent the development of new lesions and reduce risk of relapses, mainly for relapsing-remitting MS. Due to adverse side effects, as well as risk of progressive multifocal leukoencephalopathy, pregnancy and or the transition to progressive MS, people with MS may need to cease or switch treatments, with a risk of disease relapse or rebound. Current clinical monitoring of recurrent disease activity uses MRI primarily for identifying new or enlarging lesions. Quantitative MRI techniques using diffusion weighted imaging (DWI), T1 relaxation mapping and quantitative susceptibility mapping (QSM) have the potential to provide more sensitive information of underlying pathological processes by detecting changes before they are apparent on routine clinical scans on pre-symptomatic patients. In particular, ultra-high field MRI (7 Tesla) may help increase sensitivity over clinical field strengths, due to physical advantages such as higher signal-to-noise ratio, resolution and increased susceptibility effects.The aim of this pilot study is to demonstrate the use of a multi-modal imaging approach (DWI, QSM and T1 MRI), to study the evolution of lesions in a MS patient switching medication.
Methods
Recruitment and data collection is ongoing; data is shown for one relapsing-remitting MS participant (female, 24 years, no to minimal disability EDSS = 0) switching from Fingolimod to Cladribine. 7T MRI (Siemens MAGNETOM 7T Plus) was performed at three time points: 1) before stopping DMT, 2) within one week of commencing the new DMT and 3) three months after starting new DMT. Due to intercurrent medical issues, there was an 84-day interval between ceasing fingolimod and commencing cladribine.A 3D T1-weighted structural scan (multi echo MP2RAGE, 0.75 mm isotropic, repetition time (TR) = 4500, inversion time (TI) = 700/2700, echo time (TE) = 2.22, 4.21 and 8.14, flip angle (FA) = 5/6)1 was acquired from which a T1 map was derived (1st echo) and QSM values were calculated using QSMART2 (referenced to water). A 3D FLAIR (0.75 mm isotropic, TR = 9000, TE = 270, TI = 2600, FA=120) was acquired for lesion identification and masking. Diffusion weighted MRI was acquired using a simultaneous multi-slice 2D spin-echo EPI sequence3 (1.24 mm isotropic, 3 b-shells: 1000, 2000, 3000 s/mm2, 103 directions, TR = 7000, TE = 72.4, FA = 90/180). Data was pre-processed and tensors were calculated including b0 images and b1000 images, from which apparent diffusion coefficient (ADC) and fractional anisotropy (FA) maps were derived (MRtrix 3.0).
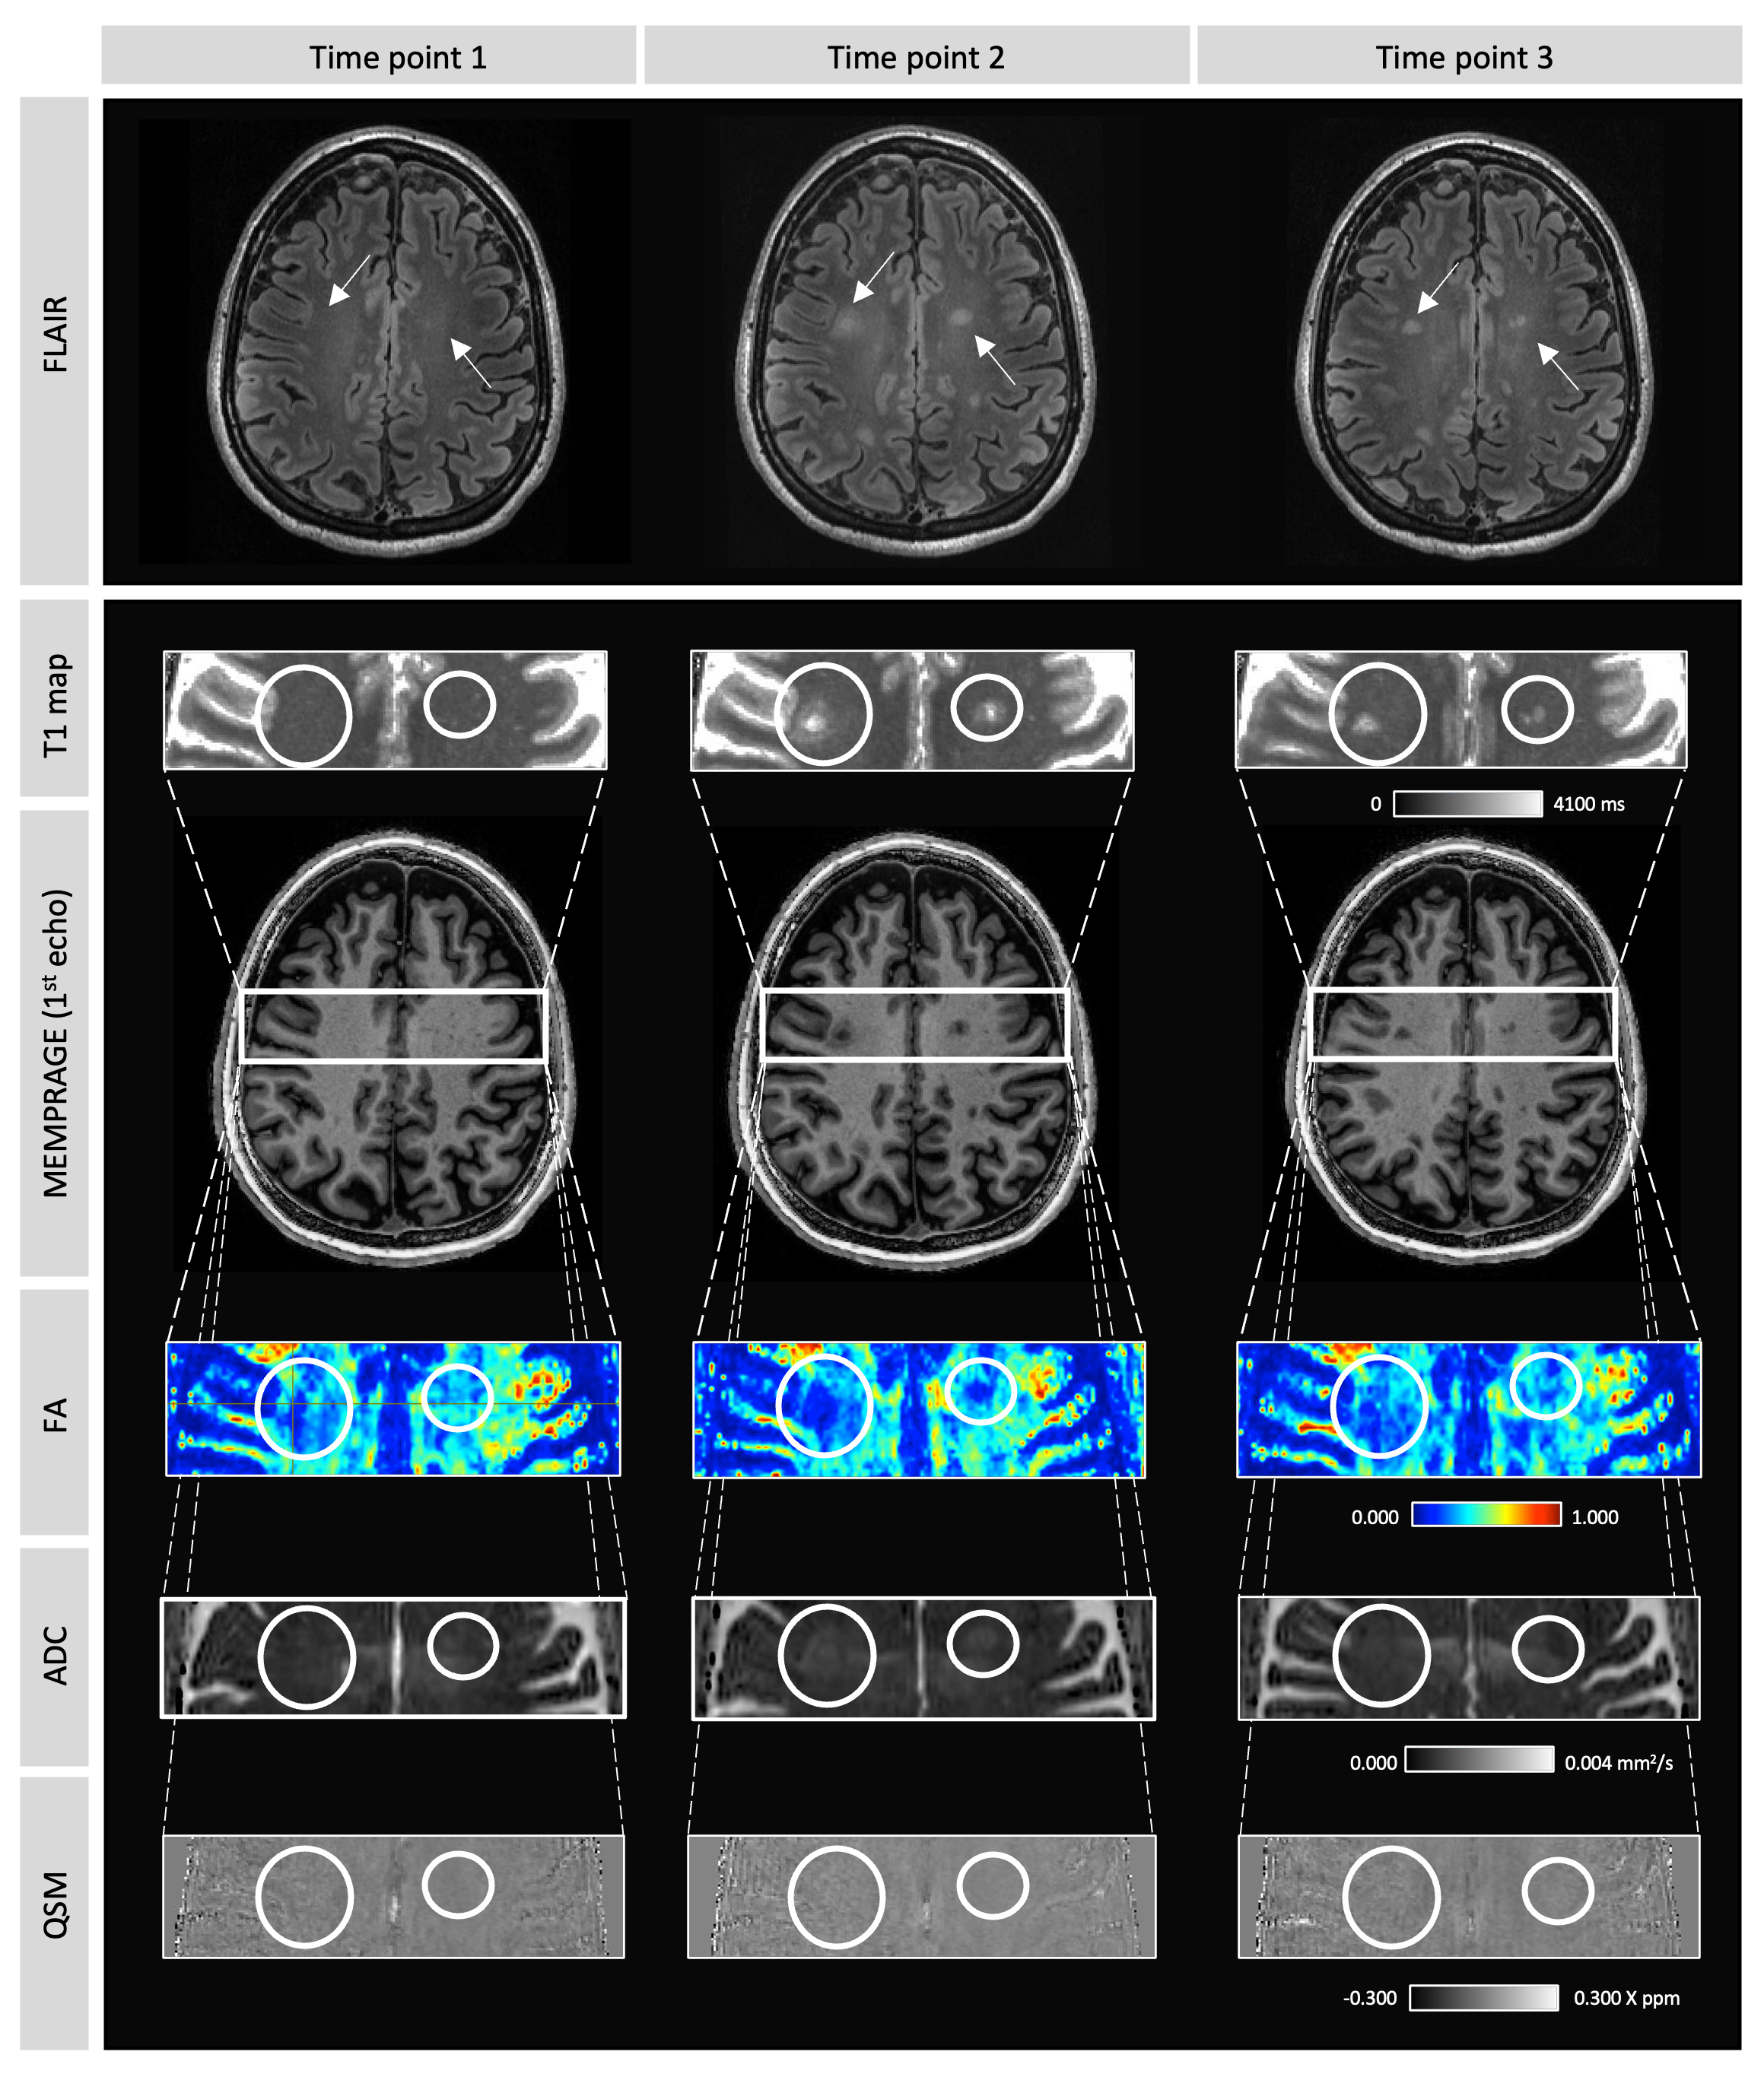
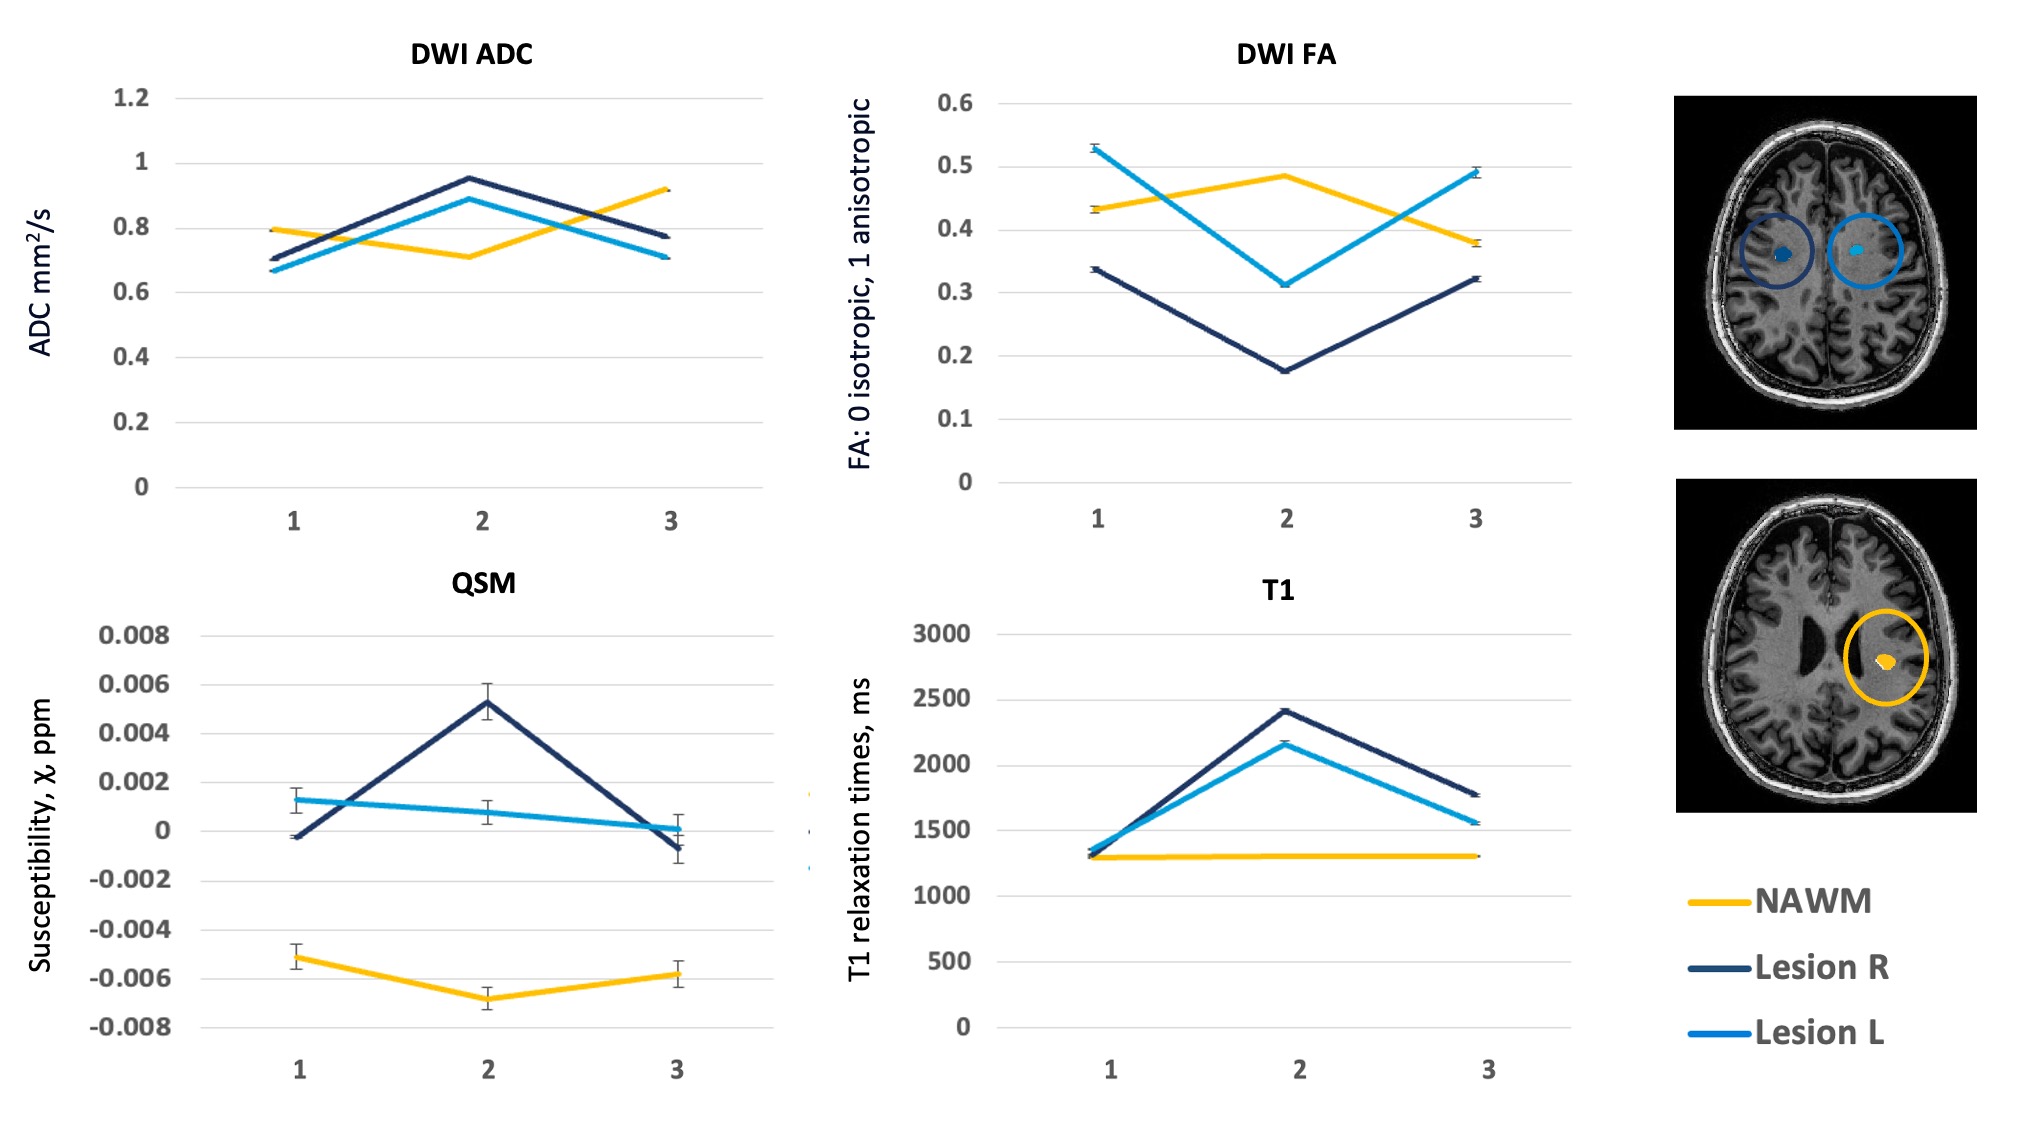
Three regions of interest were manually delineated on the FLAIR image on time point 2, including two new appearing lesions and one normal appearing white matter (NAWM) region (Figure 1). These regions were registered to time point 1 and 3, and mean T1 relaxation times, QSM, ADC and FA values were extracted.
Results
Three months after ceasing medication, two new FLAIR hyperintense lesions developed (Figure 1). Compared to baseline, within these lesions, ADC increased, whereas FA reduced, with both returning toward baseline values three months after start of new medication (time point 3) (Figure 2). Similarly, compared to baseline, higher T1 values were observed when lesions were present (time point 2), which were then reduced at time point 3. Both lesions showed positive susceptibility, unlike NAWM which showed WM-like negative susceptibility across time. The susceptibility distribution of one lesion remained relatively stable, whereas the other lesion demonstrated higher susceptibility at time point 2, which then reduced at time point 3 (Figure 2). The NAWM appears to be relatively stable over time for all metrics (Figure 2).Discussion
This study demonstrates the use of a multi-modal quantitative MRI approach to track the evolution of lesions in MS. After ceasing medication, new inflammatory lesions developed, visible and measurable using the advanced quantitative imaging techniques. Diffusion data showed increased diffusion (higher ADC, lower FA), potentially caused by inflammatory processes, demyelination as well as oedema. This is in line with the observed higher T1 relaxation times, as well as higher susceptibility values, both potentially resulting from demyelination and or higher iron levels. In contrast to other metrics, for which both lesions show similar patterns, QSM changes over time were slightly different in each lesion, potentially highlighting differing physiological mechanisms or rates of development.Along with further data collection and analysis, future work will include investigation of 7T MRI in detection of early signs of inflammatory disease activity, as well as the use of multi-modal, quantitative imaging, including sodium and MR spectroscopy, to better understand the histopathological processes underlying MS to help explore potential new treatment strategies.
Acknowledgements
The authors would like to thank all the participants and acknowledge the facilities, scientific and technical assistance from the National Imaging Facility, a National Collaborative Research Infrastructure Strategy (NCRIS) capability, at the Melbourne Brain Centre Imaging Unit, the University of Melbourne. The work was also supported by a research collaboration agreement with Siemens Healthineers.References
1. Sun H, Cleary JO, Glarin R, et al. Extracting more for less: multi-echo MP2RAGE for simultaneous T1-weighted imaging, T1 mapping, R2∗ mapping, SWI, and QSM from a single acquisition. Magn Reson Med. 2020;83(4):1178-1191. doi:10.1002/MRM.27975
2. Yaghmaie N, Syeda WT, Wu C, et al. QSMART: Quantitative susceptibility mapping artifact reduction technique. Neuroimage. 2021;231:117701. doi:10.1016/J.NEUROIMAGE.2020.117701
3. Vu AT, Auerbach E, Lenglet C, et al. High resolution whole brain diffusion imaging at 7T for the Human Connectome Project. Neuroimage. 2015;122:318-331. doi:10.1016/j.neuroimage.2015.08.004
Figures