0291
A comparison of Gadolinium- and water-based blood-brain barrier dysfunction measures in patients with small vessel disease1Centre for Clinical Brain Sciences and UK Dementia Research Institute, University of Edinburgh, Edinburgh, United Kingdom, 2Laboratory of FMRI Technology (LOFT), USC Mark & Mary Stevens Neuroimaging and Informatics Institute, Keck School of Medicine, University of Southern California, Los Angeles, CA, United States, 3Department of Anesthesiology, Yale School of Medicine, Yale University, New Haven, CT, United States, 4Glasgow Experimental MRI Centre, School of Psychology and Neuroscience, University of Glasgow, Glasgow, United Kingdom, 5Department of Biomedical Engineering, Yale School of Medicine, Yale University, New Haven, CT, United States
Synopsis
Clinically relevant non-invasive blood-brain barrier (BBB) function imaging techniques are needed to monitor the role of neuroinflammation and endothelial cell dysfunction, particularly in small vessel disease (SVD). Diffusion-weighted ASL measures water exchange rate (kw), a promising endogenous BBB function metric, but has not been assessed in sporadic SVD. We measured kw in SVD patients to explore associations with established Gadolinium-based contrast agent (GBCA) BBB permeability measures and SVD severity. We found only limited associations between kw and GBCA metrics, although patients with more severe SVD tended to have higher kw, reflecting that the methods may probe different mechanisms.
Introduction
Perivascular neuroinflammation has been documented in SVD for >100 years but its role in SVD pathogenesis remains poorly understood.1,2 Subtle blood-brain barrier (BBB) disruption is well reported in SVD, BBB permeability is higher in patients with more severe disease3,4 and linked to inflammation and endothelial cell dysfunction.2 Accurate in-vivo BBB dysfunction measurements are therefore highly relevant to understanding the role of neuroinflammation in SVD and potential causes of progression.5 Dynamic-contrast enhanced MRI (DCE-MRI) can detect BBB dysfunction, however contrast agent molecular size limits sensitivity, compromised kidney function is a contraindication, and retention limits repeated scanning.3,6 Several techniques using water as an endogenous contrast agent have been developed, including diffusion-weighted arterial spin labelling (DW-ASL), but have not been widely applied in patients.7 We compared DW-ASL and DCE-MRI measures of BBB function in patients with symptomatic SVD and assessed associations with age and SVD burden.Methods
We recruited patients with minor stroke due to SVD in an on-going longitudinal study (ISRCTN:12113543).8 We scanned patients within 1-3 months of symptom onset on a 3 T Siemens Prisma MRI scanner.The imaging protocol included:
- Structural images8 (T1-weighted, T2-weighted, and FLAIR)
- Quantitative T1 mapping (two inversion recovery (IR-) spoiled gradient recalled echo (SPGR): TR/TE/TI=1040/1.82/600 and 1940/1.82/1500 ms, FA=5°; three SPGR: TR/TE = 5.4/1.82 ms, FA = 2/5/12°, acquisition matrix 160×200×160, 1.2-mm isotropic)
- DCE-MRI (32 consecutive SPGR volumes during intravenous injection of 0.1 mmol/kg body weight gadobutrol (1M Gadovist, Bayer AG, Leverkusen, Germany) using a power injector; TR/TE = 3.4/1.7 ms, FA = 15°, acquisition matrix size 120×96×96, 2-mm isotropic)
We segmented subcortical grey (SGM), whole-brain normal-appearing white matter (NAWM) and WMH masks, using validated methods, checked and manually corrected as necessary.8 We calculated percentage white matter volume normalised to intracranial volume (ICV).
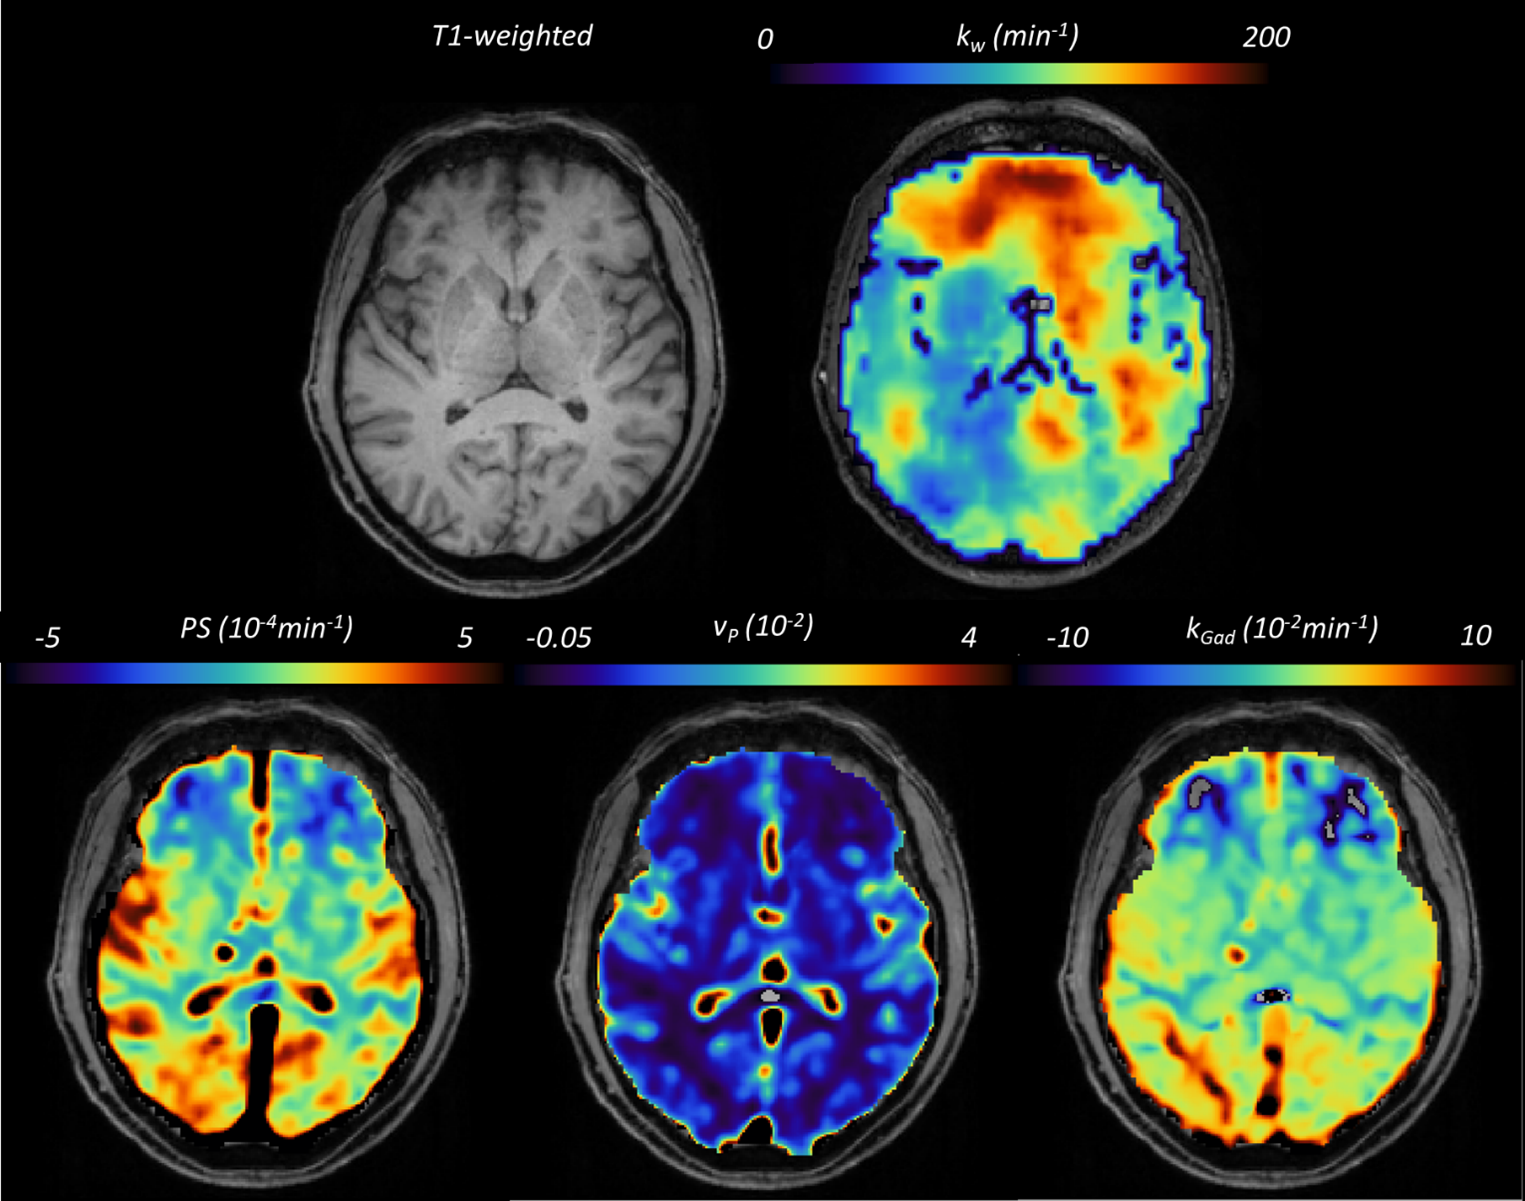
We measured pre-contrast T1 maps using the DESPOT1-HIFI method,9 correcting flip angle error voxelwise.10 We processed the DCE-MRI data using consensus recommendations3 as described:11 we determined a patient-specific venous input function and calculated signal enhancement timecourses relative to the mean pre-contrast signal using the median signal within each tissue mask.11 We estimated the GBCA concentration using the SPGR signal equation assuming a linear dependence of 1/T1 on concentration, and calculated concentration in blood plasma using patient-specific haematocrits. We calculated permeability surface area product (PS) and blood plasma volume (vP) from the tissue concentration timecourses using the Patlak model.11,12
We used a two-stage approach to measure arterial transit time (ATT) and water exchange rate (kw) as previously described.13 We calculated kw using a total-generalized variation regularized single-pass-approximation model from scans acquired at PLD=1,800 ms with b=0 and 50 s/mm2, to separate the intra- and extra-vascular compartments, respectively.6
We investigated associations between kw and PS, vP and kGad (PS/vP) in separate models using univariate and multiple variable linear regression adjusting for age and SVD burden (percentage WMH volume).
Results
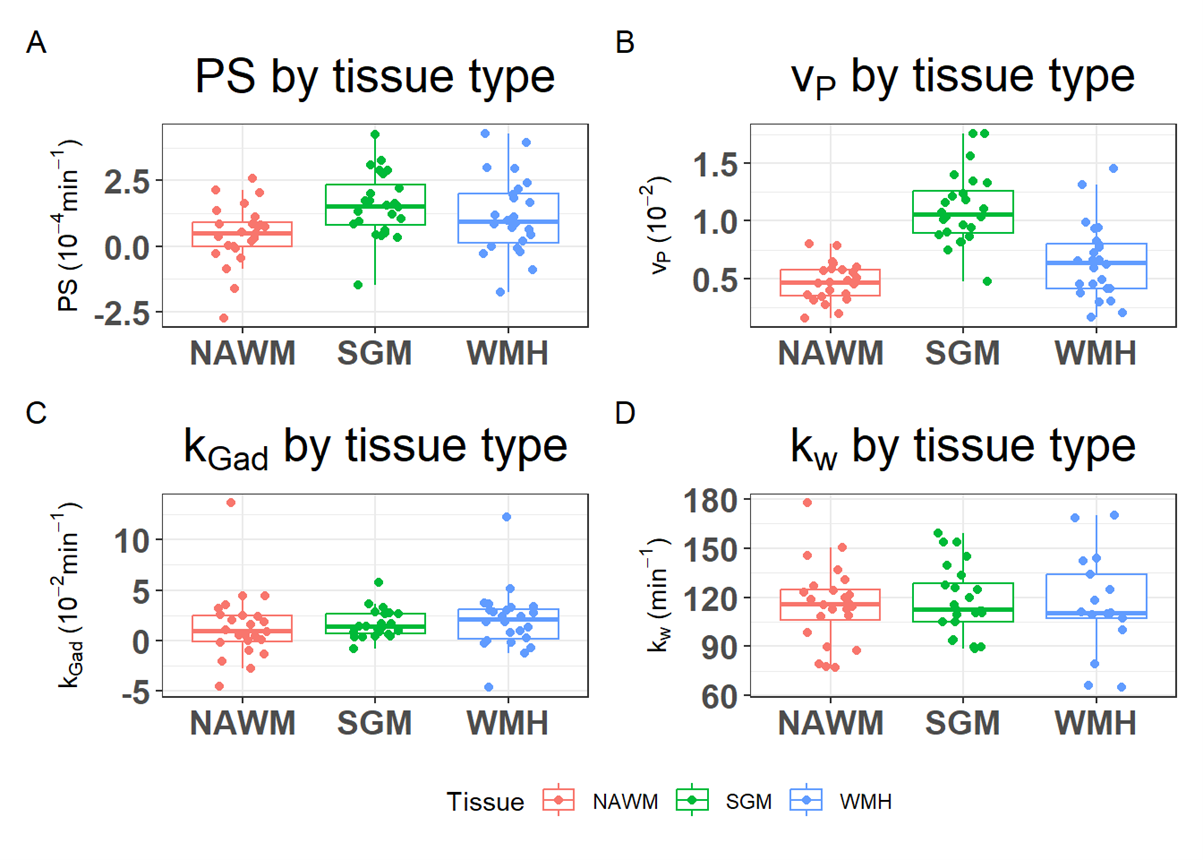
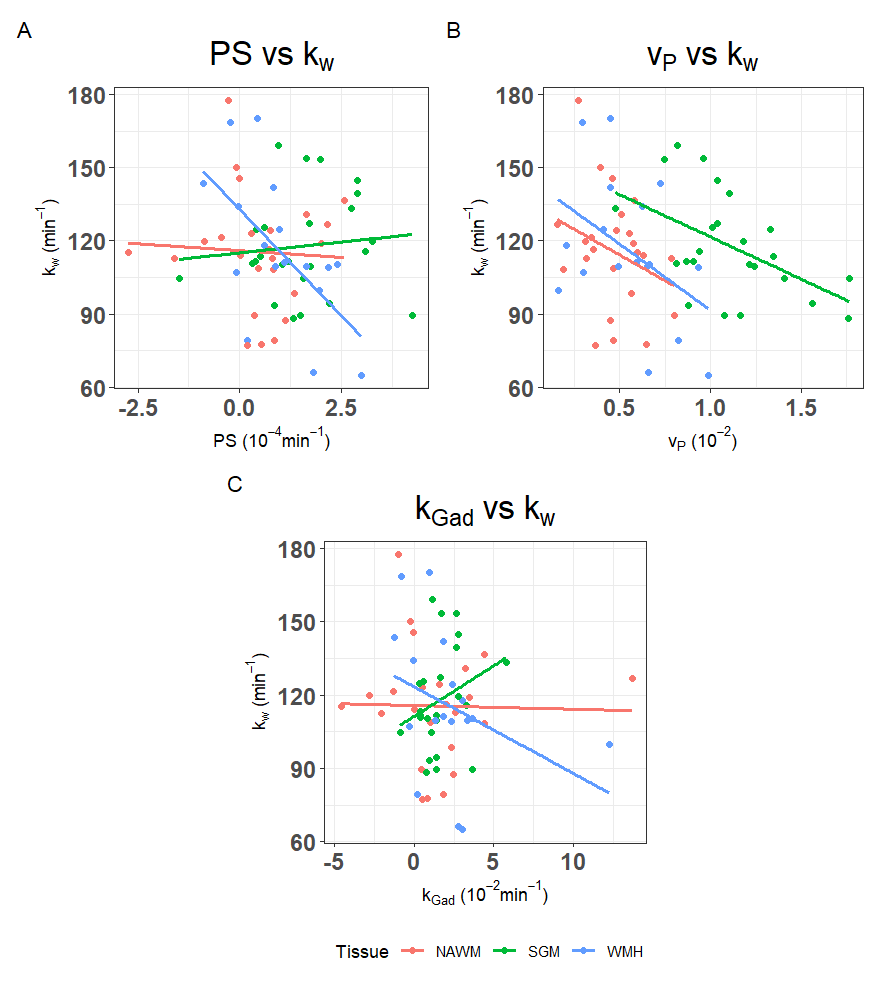
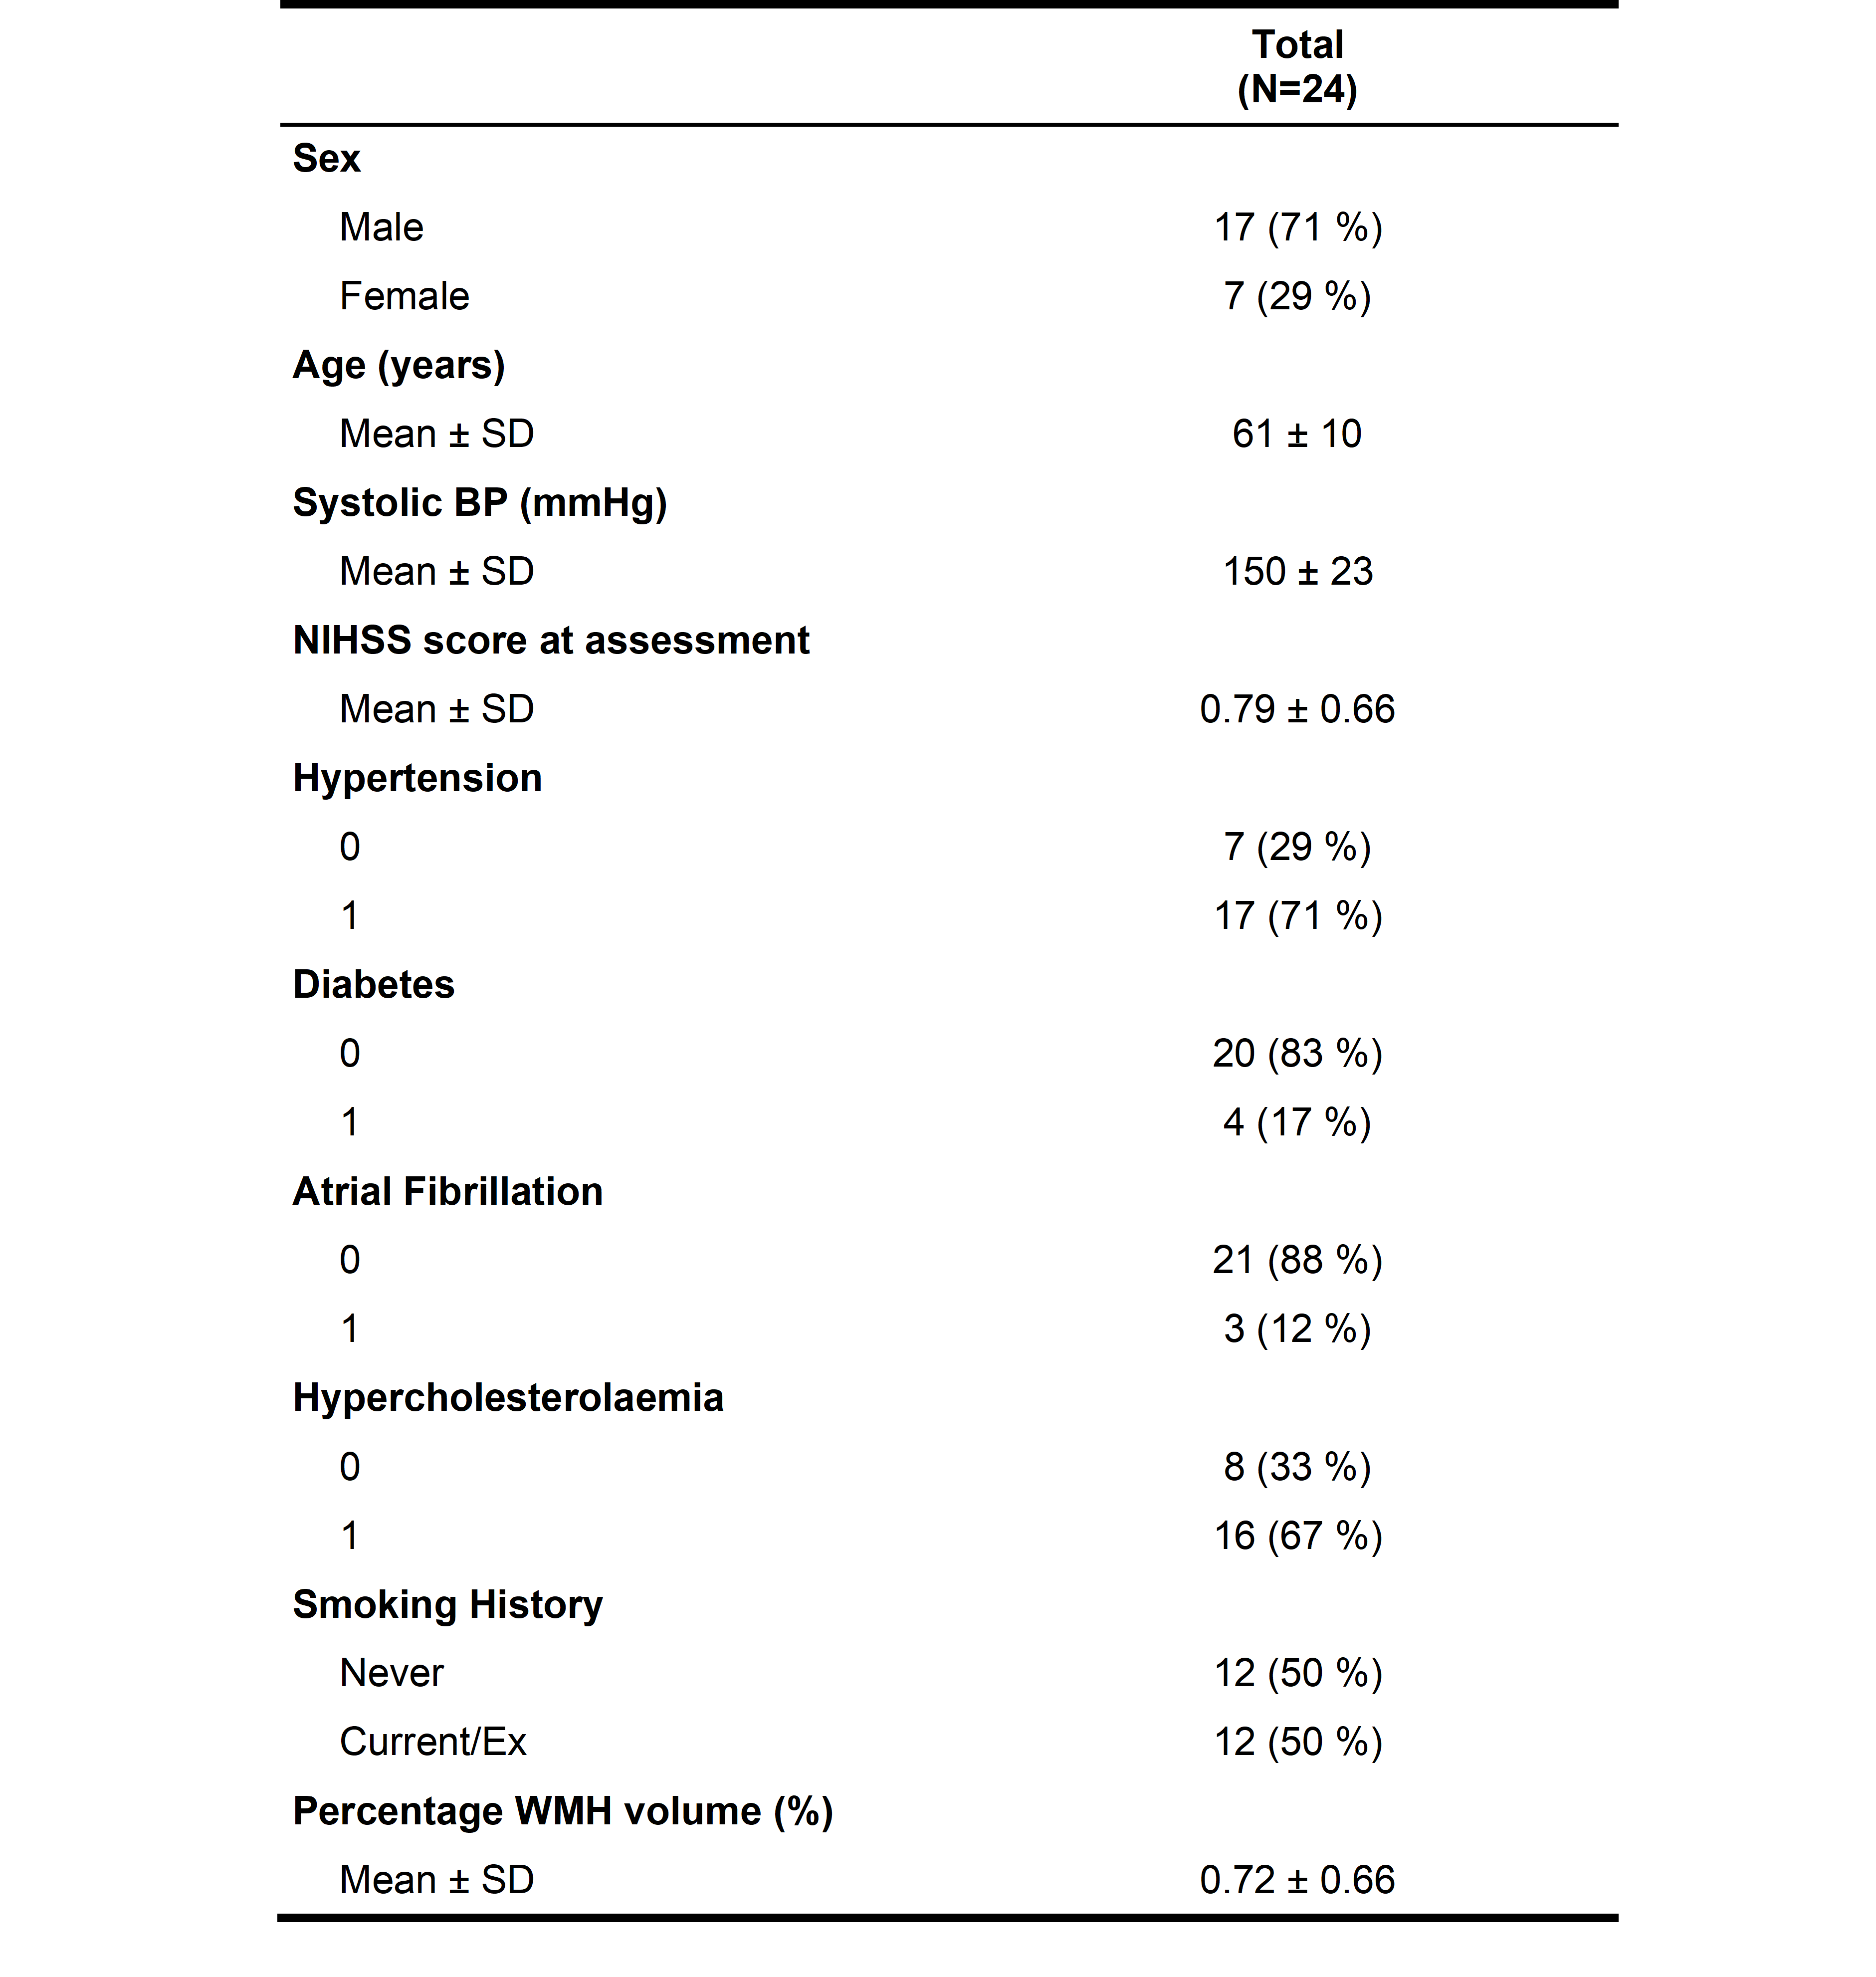
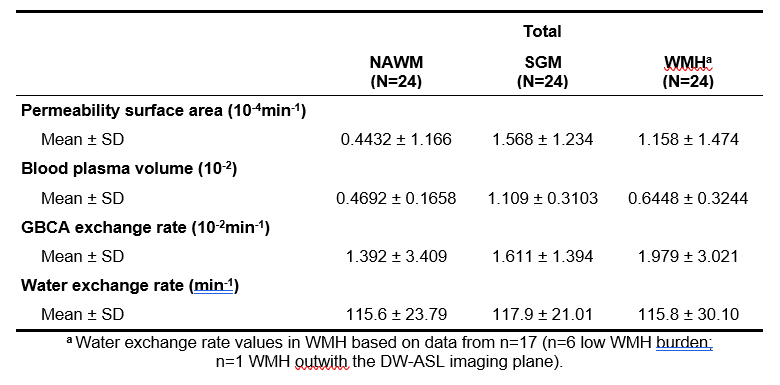
We recruited 26 patients, 2 scans failed, and the remaining 24 patients had a mean age of 61±10 years, mean percentage WMH volume of 0.72±0.66 % and 17 (71%) were male (Table 1). Figure 1 shows representative BBB function parameter maps. Table 2 and Figure 2 show mean values and distribution of the imaging variables.In univariate analyses (Figure 3), patients with higher SGM kw tended to have lower vP (B=-34.65, 95% confidence interval (95%CI)=-60.37,-8.93, p=0.01) and marginally higher kGad (B=4.17, 95%CI=-2.23,10.57, p=0.19). Patients with higher NAWM kw tended to have lower vP (B=-42.15, 95%CI=-102.77,18.48, p=0.16), but we found no clear associations with PS or kGad. Patients with higher WMH kw had lower PS (B=-17.34, 95%CI=-29.78,-4.91, p=0.009), and tended to have lower vP (B=-54.15, 95%CI=-116.22, 7.93, p=0.08) and kGad (B=-3.56, 95%CI=-8.73, 1.60, p=0.16). After correcting for WMH volume and age, all associations were attenuated, though the direction of effect was unchanged.
Patients with higher kw in SGM, NAWM and WMH tended to have higher WMH volumes (e.g. SGM: B=12.90, 95%CI=-1.53,27.33, p=0.08).
Discussion
We found SVD patients with higher kw tended to have higher kGad in SGM and lower vP in SGM and NAWM. Limited associations between water and GBCA exchange metrics reflect previous findings that the two approaches may probe different BBB transport mechanisms,14 while reduced vP may reflect inflammation-induced vascular changes15 and/or vessel loss in patients with greater BBB dysfunction.4 Lastly, we found patients with higher WMH volumes, a key marker of SVD,1 had higher kw which may be consistent with worse neuroinflammation as documented in SVD histologically.Conclusion
In this small study we found evidence of associations between DW-ASL and GBCA BBB function metrics. kw was sensitive to disease severity, consistent with previous studies using GBCA, suggesting DW-ASL is a promising imaging marker of subtle BBB dysfunction. Further studies are required to validate these findings in a larger cohort, in comparison with positron emission tomography markers of inflammation, explore longitudinal changes in kw and associations with other disease burden metrics.Acknowledgements
The authors acknowledge the contribution of the Laboratory of Functional MRI Technology (LOFT) and the University of Southern California’s Stevens Neuroimaging and Informatics Institute to this study though provision of the diffusion prepared pseudocontinuous ASL sequence used for acquisition and the BBB water exchange mapping software (http://www.loft-lab.org/index-5.html) used for image reconstruction and processing. We also thank the Edinburgh Imaging Facility (Royal Infirmary of Edinburgh) radiographers for their work and patients for participating in this study.References
1. Wardlaw JM, Smith C, Dichgans M. Small vessel disease: mechanisms and clinical implications. The Lancet Neurology 2019;18:684-696.
2. Wardlaw JM, Benveniste H, Nedergaard M, et al. Perivascular spaces in the brain: anatomy, physiology and pathology. Nat Rev Neurol 2020;16:137-153.
3. Thrippleton MJ, Backes WH, Sourbron S, et al. Quantifying blood-brain barrier leakage in small vessel disease: Review and consensus recommendations. Alzheimers Dement 2019;15:840-858. 4. Stringer MS, Heye AK, Armitage PA, et al. Tracer kinetic assessment of blood-brain barrier leakage and blood volume in cerebral small vessel disease: Associations with disease burden and vascular risk factors. Neuroimage Clin 2021;32:102883.
5. Candelario-Jalil E, Dijkhuizen RM, Magnus T. Neuroinflammation, Stroke, Blood-Brain Barrier Dysfunction, and Imaging Modalities. Stroke 2022;53:1473-1486.
6. Shao X, Ma SJ, Casey M, D'Orazio L, Ringman JM, Wang DJJ. Mapping water exchange across the blood-brain barrier using 3D diffusion-prepared arterial spin labeled perfusion MRI. Magn Reson Med 2019;81:3065-3079.
7. Dickie BR, Parker GJM, Parkes LM. Measuring water exchange across the blood-brain barrier using MRI. Prog Nucl Magn Reson Spectrosc 2020;116:19-39.
8. Clancy U, Garcia DJ, Stringer MS, et al. Rationale and design of a longitudinal study of cerebral small vessel diseases, clinical and imaging outcomes in patients presenting with mild ischaemic stroke: Mild Stroke Study 3. Eur Stroke J 2021;6:81-88.
9. Deoni SC. High-resolution T1 mapping of the brain at 3T with driven equilibrium single pulse observation of T1 with high-speed incorporation of RF field inhomogeneities (DESPOT1-HIFI). J Magn Reson Imaging 2007;26:1106-1111.
10. Thrippleton MJ, Blair GW, Valdes-Hernandez MC, et al. MRI Relaxometry for Quantitative Analysis of USPIO Uptake in Cerebral Small Vessel Disease. Int J Mol Sci 2019;20.
11. Manning C, Stringer M, Dickie B, et al. Sources of systematic error in DCE-MRI estimation of low-level blood-brain barrier leakage. Magnetic Resonance in Medicine 2021;86:1888-1903.
12. Patlak CS, Blasberg RG, Fenstermacher JD. Graphical evaluation of blood-to-brain transfer constants from multiple-time uptake data. J Cereb Blood Flow Metab 1983;3:1-7.
13. St Lawrence KS, Owen D, Wang DJ. A two-stage approach for measuring vascular water exchange and arterial transit time by diffusion-weighted perfusion MRI. Magn Reson Med 2012;67:1275-1284.
14. Shao X, Jann K, Ma SJ, et al. Comparison Between Blood-Brain Barrier Water Exchange Rate and Permeability to Gadolinium-Based Contrast Agent in an Elderly Cohort. Front Neurosci 2020;14:571480.
15. Zanoli L, Briet M, Empana JP, et al. Vascular consequences of inflammation: a position statement from the ESH Working Group on Vascular Structure and Function and the ARTERY Society. J Hypertens 2020;38:1682-1698.
Figures