0290
Robustness analysis of QSM radiomic features in patients with multiple sclerosis1Department of Biomedical and Neuromotor Sciences, University of Bologna, Bologna, Italy, 2Department of Information and Electrical Engineering and Applied Mathematics, University of Salerno, Salerno, Italy, 3UOSI Riabilitazione Sclerosi Multipla, IRCCS Istituto delle Scienze Neurologiche di Bologna, Bologna, Italy, 4Department of Histopathology, Cambridge University Hospitals NHS Foundation Trust, Cambridge, United Kingdom, 5Epidemiology and Statistics Unit, IRCCS Istituto delle Scienze Neurologiche di Bologna, Bologna, Italy, 6Functional and Molecular Neuroimaging Unit, IRCCS Istituto delle Scienze Neurologiche di Bologna, Bologna, Italy, 7Department of Physics and Astronomy, University of Bologna, Bologna, Italy, 8NOVA Information Management School, Universidade NOVA de Lisboa, Lisbon, Portugal, 9Department of Imaging, Cambridge University Hospitals NHS Foundation Trust, Cambridge, United Kingdom, 10Department of Radiology, University of Cambridge, Cambridge, United Kingdom, 11Radcliffe Department of Medicine, Investigative Medicine Division, University of Oxford, Oxford, United Kingdom
Synopsis
This work evaluates the reliability of radiomic features in healthy controls and patients with multiple sclerosis using MR Quantitative Susceptibility Mapping (QSM), to guide the identification of future potential biomarkers. To ensure reproducibility, we assessed the non-lesioned parenchyma. Feature robustness was evaluated against the number of grey levels and echo times, measuring the Intraclass Correlation Coefficient (ICC). More than 65% of features were robust; different outcomes between regions were interpreted considering their anatomical characteristics (e.g. fibres’ orientation), confirmed by radiomic measurements (e.g. entropy). In future work, we are going to assess characterization and classification potential of those measurements.
Introduction
Multiple Sclerosis (MS) is a chronic inflammatory and demyelinating disease, still with unknown etiological trigger1. Quantitative Susceptibility Mapping (QSM) is an advanced quantitative MR technique2, sensitive to the concentration of myelin and iron3, involved in the pathological evolution of MS. QSM has already been used to explore MS lesions4 and brain structures such as the thalamus, in which susceptibility values have been associated with clinical disability5. As MS can involve the whole brain, analysing the normal appearing white matter (NAWM) could provide promising in vivo non-invasive imaging biomarkers, possibly revealing pre-clinical inflammatory demyelination and helping in early diagnosis.Radiomics includes a collection of techniques for extracting high-dimensional features, such as descriptors of intensity histogram and texture, supporting personalised medicine in medical imaging applications6. This methodology is still largely unexplored in susceptibility-based imaging and neurodegeneration applications. In this work, we proposed a robustness analysis, crucial cornerstone in radiomic applications, of susceptibility-based descriptors from NAWM regions, to suggest reliable features for future work aimed at MS phenotyping.
Materials and Methods
The sample included MRI of 121 patients with MS (71F/50M, 48.7±12.6yo) and 30 Healthy Controls (HC) (17F/13M; 53.4±17.9yo); data were acquired by the Neuroimaging Laboratory (IRCCS Istituto delle Scienze Neurologiche di Bologna, Bologna, Bellaria Hospital). The MR protocol (3T Siemens Magnetom Skyra, Siemens Head/Neck 64-channel Coil) included: MPRAGE (3D-T1w, TR/TE=2300/2.98ms, 1x1x1mm3), FLAIR (3D-T2w sagittal, TR/TE=5000/428ms, 1x1x1mm3), DWI (2D-EPI HARDI single-shot, TR/TE = 4300/98ms, 2x2x2mm3) and QSM (3D GRE T2*w, nTEs=5, TR/TE/ΔTE=53/9.42/9.42ms, 0.5x0.5x1.5mm3).To obtain susceptibility images, phase maps were processed by Laplacian unwrapping, V-SHARP background removal, and iLSQR7. WM tracts were reconstructed (Arcuate Fasciculus AF, Cortico-Spinal Tract CST, Frontal Aslant Tract FAT, Inferior Fronto-Occipital Fasciculus IFOF, Optic Radiation OR, Uncinate Fasciculus UF), modelling the diffusivity along the spatial eigenvector using the tensor model and using high-order fibre modelling and probabilistic streamline approach for crossing fibres evaluation8. WM tissue was segmented using the MRtrix tool 5ttgen (https://www.mrtrix.org/). The Lesion Segmentation Toolbox (https://www.applied-statistics.de/lst.html) was used for MS lesion segmentation.
PyRadiomics (https://pyradiomics.readthedocs.io/en/latest/) was adopted to extract features, providing 18 First-Order (FO) and 75 texture features, divided into Grey Level Co-occurrence Matrix (GLCM,24), Grey Level Run Length Matrix (GLRLM,16), Grey Level Size Zone Matrix (GLZM,16), Neighbouring Grey Tone Difference Matrix (NGTDM,5) and Grey Level Dependence Matrix (GLDM,14). We assessed the robustness of radiomic features by evaluating different numbers of GLs (8 to 512 using powers of 2) and numbers of echo time (4 QSM reconstructions). We measured the Intraclass Correlation Coefficient (ICC), ranging from 0 (=no reliability at all) to 1 (=perfect reliability), between QSM reconstructions. Features were evaluated considering first the left and right hemispheres together and then individually; possible differences between the two sides were assessed (two-sample t-test).
Results and Discussion
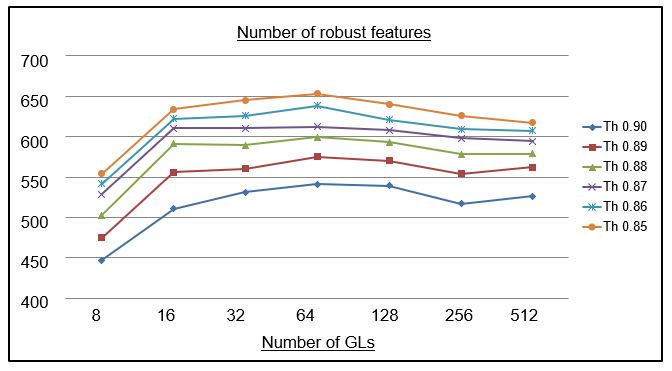
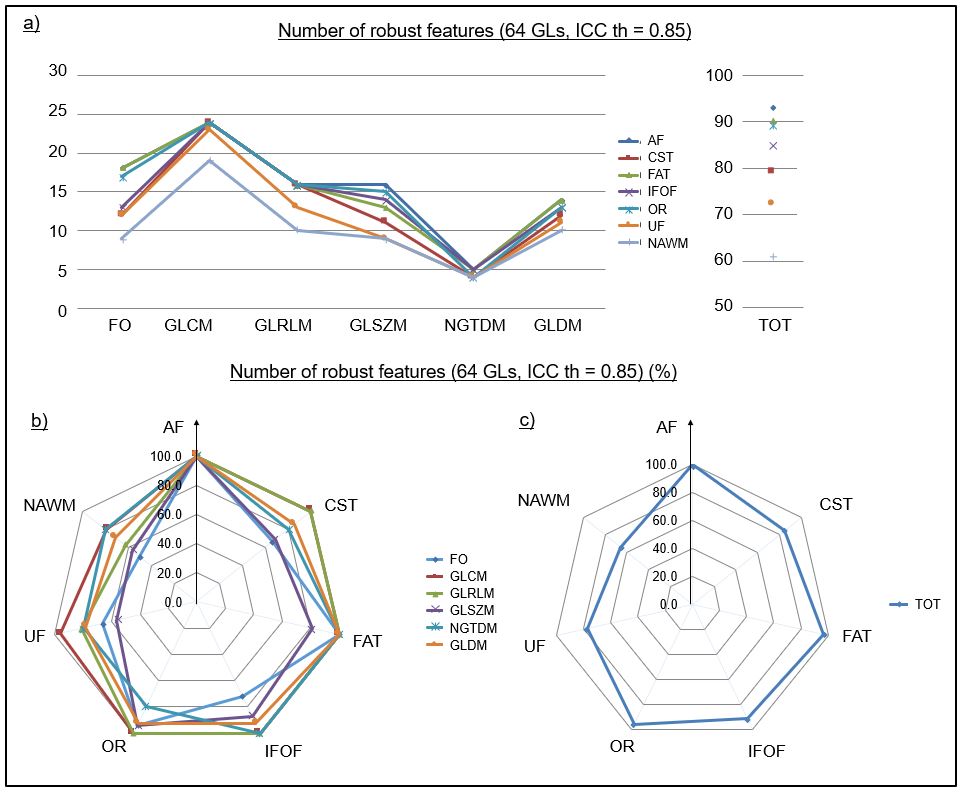
1) For each binning configuration, the ICC was measured to evaluate the optimal number of GLs. Different thresholds, from 0.85 to 0.90, were selected (Fig.1). The maximum number of robust features was obtained for 64 GLs, a reasonable value compared with other studies9.2) We analysed robust features (ICC threshold=0.85) in NAWM and individual tracts (Fig.2). In NAWM, ~65% of features were robust; tracts worked better in terms of robust features, between 75% and 100%. There are no major differences between them, but we noted that they are divided into two groups: AF, FAT, OR (~95 to 100%) and CST, IFOF, UF (~75 to 90%). The volume may partially explain this result, since CST and IFOF are the largest white matter tracts, leading to higher variability in susceptibility distributions.
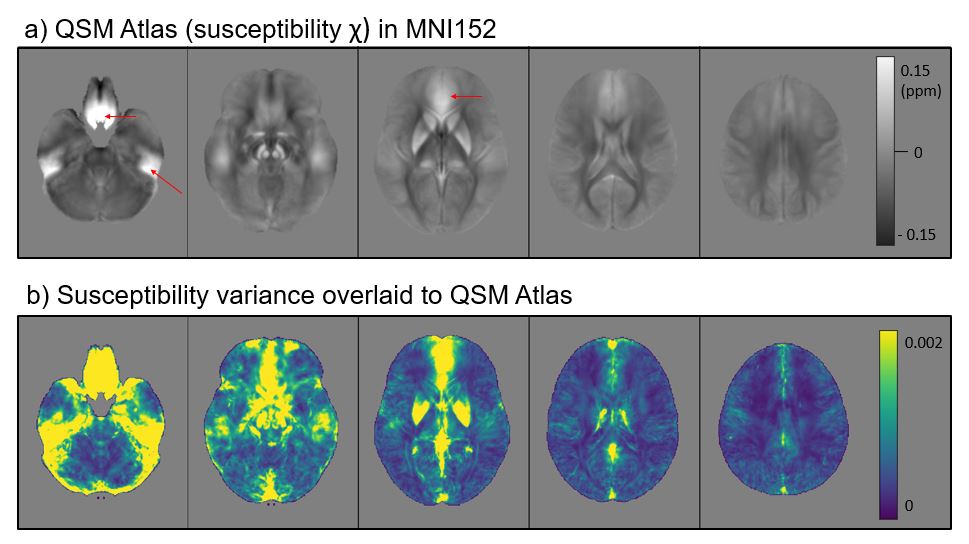
3) We built up a QSM-contrasted atlas and a voxel-wise variance map in the MNI152 space (Fig.3) using images from HCs; the regions with more variability are areas closer to the air-tissue boundaries, near the bones and the basal ganglia. CST, IFOF, and UF contain areas with higher variance, including artefacts areas in QSM; tracts reconstructions usually do not overlap those areas, but the intensity stability may be influenced by their proximity.
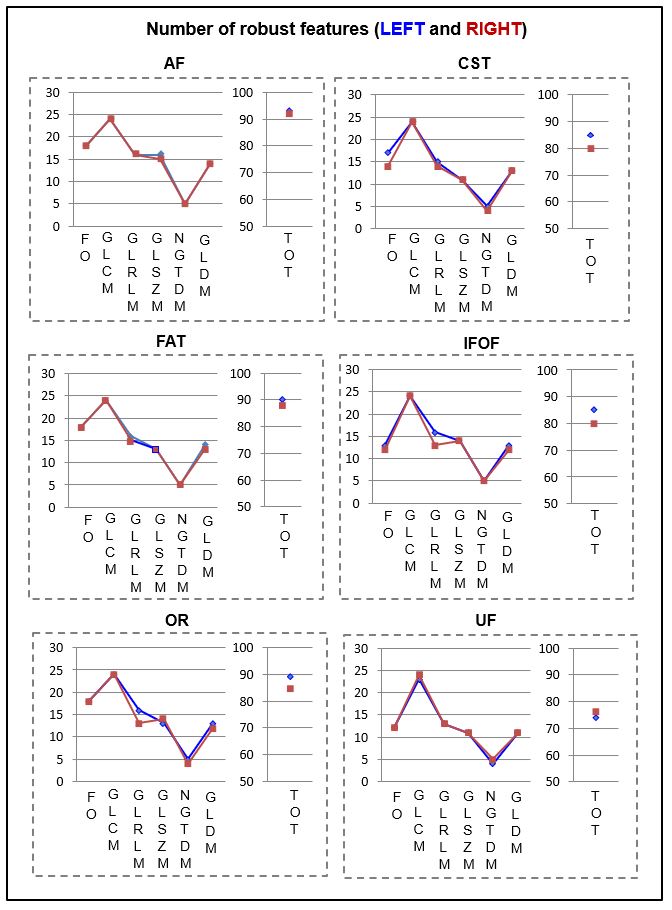
4) A sub-analysis by sides demonstrated negligible differences between left and right sides (p > 0.05), both in the tracts (Fig.4) and in the whole NAWM.
A total of 55 features (9 FO, 19 GLCM, 10 GLRLM, 4 GLSZM, 4 NGDTM, and 9 GLDM) appeared to be robust in all the ROIs and we suggest the use of those features for clinical purposes. More descriptors can be considered if we consider ROI-specific reliability.
Conclusion
We assessed the robustness of radiomic features extracted from QSM images in NAWM regions. More than 75% of features are robust in all the assessed white matter tracts, with different performance probably due to the volume and the influence of nearby structures on susceptibility values. In the entire NAWM, more than 65% of features were considered robust, which gives us valuable information to proceed with further clinical studies. In future work, we plan to use the identified robust features to characterise patients with MS, with both supervised and unsupervised techniques, and to identify different clinical phenotypes in patients with MS.Acknowledgements
No acknowledgement found.References
1. Reich DS, Lucchinetti CF and Calabresi PA. Multiple Sclerosis. N Engl J Med. 2018;378(2):169-180
2. Deistung A, Schweser F and Reichenbach JR. Overview of quantitative susceptibility mapping. NMR Biomed. 2017;30(4):e3569
3. Hamatner S, Endmayr V, Deistung A et al. The influence of brain iron and myelin on magnetic susceptibility effective transverse relaxation – A biochemical and histological validation study. Neuroimage. 2018;179:117-133
4. Marcille M, Rúa SH, Tyshkov C et al.. Disease correlates of rim lesions on quantitative susceptibility mapping in multiple sclerosis. Sci Rep. 2022;12(1):4411
5. Zivadinov R, Tavazzi E, Bergsland N et al. Brain Iron at Quantitative MRI Is Associated with Disability in Multiple Sclerosis. Radiology. 2018;289(2):487-496
6. Gillies R, Kinahan P and Hricak H. Radiomics: images are more than pictures, they are data. Radiology. 2016; 278(2):563–577
7. Li W, Wang N, Yu F et al. A method for estimating and removing streaming artifacts in quantitative susceptibility mapping. Neuroimage. 2015;108:111-222
8. Zoli M, Talozzi L, Martinoni M et al. From Neurosurgical Planning to Histopathological Brain Tumor Characterization: Potentialities of Arcuate Fasciculus Along-Tract Diffusion Tensor Imaging Tractography Measures. Front Neurol. 2021;12:633209
9. Sanchez LE, Brown E, Rundo L et al. Photoacoustic imaging radiomics in patient-derived xenografts: a study on feature sensitivity and model discrimination. Sci Rep. 2022;12(1):15142
Figures