0288
A novel method to calculate standardized quantitative maps from a single T2-weighted image: A feasibility study.
Nahla M H Elsaid1, Hemant D Tagare1,2, and Gigi Galiana1,2
1Radiology and Biomedical Imaging, Yale School of Medicine, New Haven, CT, United States, 2Biomedical Engineering, Yale University, New Haven, CT, United States
1Radiology and Biomedical Imaging, Yale School of Medicine, New Haven, CT, United States, 2Biomedical Engineering, Yale University, New Haven, CT, United States
Synopsis
T2w imaging could assist in the early diagnosis of multiple sclerosis (MS). However, these scans are inherently qualitative, and variable intensities in the images depend on hardware and acquisition parameters. On the other hand, standardized quantitative T2 maps can serve as a sensitive biomarker of MS and the longitudinal assessment of the disease progression. In this abstract, we present the first results demonstrating that calculating T2 maps from vendor T2w sequence is feasible, which could allow for an earlier diagnosis of MS disease.
Introduction
Multiple sclerosis (MS) is a neurodegenerative disease that causes a lack of integrity in the myelin layer of the nerves. Although T2-weighted imaging can diagnose most areas of the myelin damage1,2, it is inherently qualitative and depends on hardware and acquisition parameters. In contrast, quantitative T2 mapping could be more sensitive to identifying MS disease. While T2 mapping is fairly common after an MS diagnosis, the generation of T2 maps from T2w images, routinely used for a wide range of neurological assessments, could allow for earlier diagnosis of MS disease. This abstract demonstrates the feasibility of obtaining an accurate T2 map from a single Turbo Spin Echo (TSE) k-space of a product sequence.Conventional quantitative T2 mapping uses a series of images (Fig. 1a) acquired with different timings after excitation (echo-times, or TE) to fit a physics model across time for each pixel:
$$I_{TE}(x)=I_{0}(x)e^{\frac{-TE}{T_{2}(x)}},$$ where $$$I_{TE}(x) $$$ is the image brightness at a given $$$TE$$$, $$$=I_{0}(x)$$$ is the image brightness at $$$TE=0$$$, and $$$T_{2}(x)$$$ is a constant that reflects the tissue microstructure in that voxel.3
A novel method dubbed e-CAMP (Fig 1d,e) was recently proposed to computationally normalize (standardize) clinical MRI scans by computing a quantitative T2 map from a single TSE k-space. Initial results showed that the method worked on simulations and retrospective undersampling of single echo images taken with different echo times. Here we compute T2 maps directly from retrospectively undersampled multi-echo spin-echo (MESE) sequences and single image T2w-TSE. These have been demonstrated in phantoms and the human brain, corresponding well to the fully sampled T2 mapping experiments.
Methods
The images are related by a signal model characterized by one or several parameter maps, e.g., a T2 map. As previously proposed, the e-CAMP algorithm alternates between optimizing the image series and the parameter map. However, it minimizes a single cost function that incorporates: (1) consistency between each parameter image and its k-space data and (2) adherence of the image series to the relaxometry model for each pixel. Thus, the algorithm's objective function $$$J=J_1+J_2+J_3$$$ where: $$$J_1$$$ is concerned with data fidelity, $$$J_2$$$ is regularization, and $$$J_3$$$ is imposing the model constraint.The data fidelity term $$$J_1$$$ measures the error between the acquired data sets and our current estimate of the images.
$$$J_1=∑_{p=1}^P‖S_p-E_p m_p ‖^2= ∑_{p=1}^P(S_p-E_p m_p )^H (S_p-E_p m_p ),$$$ where $$$()^{H}$$$ refers to the complex conjugate transpose of a matrix.
The regularization term $$$J_2$$$ minimizes the effect of MR noise, and the solution is regularized by adding TV regularization. $$$J_2=τ∑_{p=1}^PTV(m_p) $$$, where $$$TV(m_p )=∑_{x=1}^N|∇m_p (x)|, |\Box|$$$ refers to the modulus, and $$$N$$$ is the number of pixels.
The constraint penalty is imposed using $$$J_3$$$, $$$J_3=λ∑_{x=1}^N∑_{p=1}^{P-1}‖m_{p+1} (x)-α(x) m_p (x)‖^2 $$$, where $$$λ>0$$$ scales the penalty.
Retrospective Human Brain Experiments
Cartesian spin-echo images were acquired on a 3T MRI scanner (TIM-Trio, Siemens Healthcare, Erlangen, Germany). Fully sampled k-space was acquired at each TE and retrospectively undersampled (Fig. 2a).
Cartesian 8-echo MESE images were acquired on a 3T MRI scanner (MAGNETOM Prismafit; Siemens Healthcare, Erlangen, Germany). These data were acquired with full k-space sampling at each echo, contrasts= 8. This dataset was retrospectively reconstructed with an echo spacing of 40 ms, as shown in Fig. 2b. The same dataset was retrospectively reconstructed with an echo spacing of 20 ms, as in Fig. 2c.
Prospective Human Brain Experiments
e-CAMP was used to reconstruct the T2 map using a T2w image acquired using the TSE Siemens product sequence (ETL=9, echo spacing=20 ms). For validation, we acquired fully sampled MESE images and fully sampled spin echo images. To compare the TSE reconstructions to the SE reconstructions, we used the echo modulation curve (EMC)4 corrections to be applied to the T2w images reconstructed using TSE image acquisitions, as shown in Fig. 3.
Phantom Experiments
A phantom was built in-house using six tubes filled with varying concentrations of MnCl2 solutions immersed in an agar gel solution. In addition, during the same scanning exam, a set of fully sampled Cartesian 9-echo images were acquired using a TSE sequence. Finally, a T2w image was acquired using a Siemens product sequence (ETL=9, echo spacing=20 ms). Once again, the echo modulation curve (EMC)4 corrections were applied to the T2w images reconstructed using TSE image acquisitions, as shown in Fig. 4.
Results
Fig. 2a (previously reported) shows images from retrospectively undersampled single-echo data. Fig 2b-c shows experimentally acquired fully-sampled MESE sequences, where the k-space of each image was retrospectively undersampled to a T2w-TSE k-space. Fig. 2d shows e-CAMP results using T2w image data from a Siemens TSE product sequence (i.e., prospective undersampling). In addition, a separate scan acquired fully sampled echo train MESE images for reference. These results agree with the e-CAMP image series generated from the T2w image data. This study also acquired a series of fully sampled spin echo images to generate a gold standard T2 map, shown on the left panel of Fig. 3.Fig. 4 shows T2 maps generated from gold standard spin echo phantom experiments, a MESE, and a product T2w imaging experiment reconstructed with e-CAMP.
Discussion and Conclusion
This abstract demonstrates the feasibility of reconstructing quantitative T2 maps using only the data acquired in a standard T2w acquisition.Acknowledgements
No acknowledgement found.References
- Polman, C. H. et al. Diagnostic criteria for multiple sclerosis: 2010 Revisions to the McDonald criteria. Annals of Neurology 69, 292-302, doi:https://doi.org/10.1002/ana.22366 (2011).
- Laule, C. et al. Pathological basis of diffusely abnormal white matter: insights from magnetic resonance imaging and histology. Multiple Sclerosis Journal 17, 144-150, doi:10.1177/1352458510384008 (2011).
- Abragam, A. The principles of nuclear magnetism. (Oxford university press, 1961).
- Ben-Eliezer, N., Sodickson, D. K. & Block, K. T. Rapid and accurate T2 mapping from multi-spin-echo data using Bloch-simulation-based reconstruction. Magn Reson Med 73, 809-817, doi:10.1002/mrm.25156 (2015).
Figures
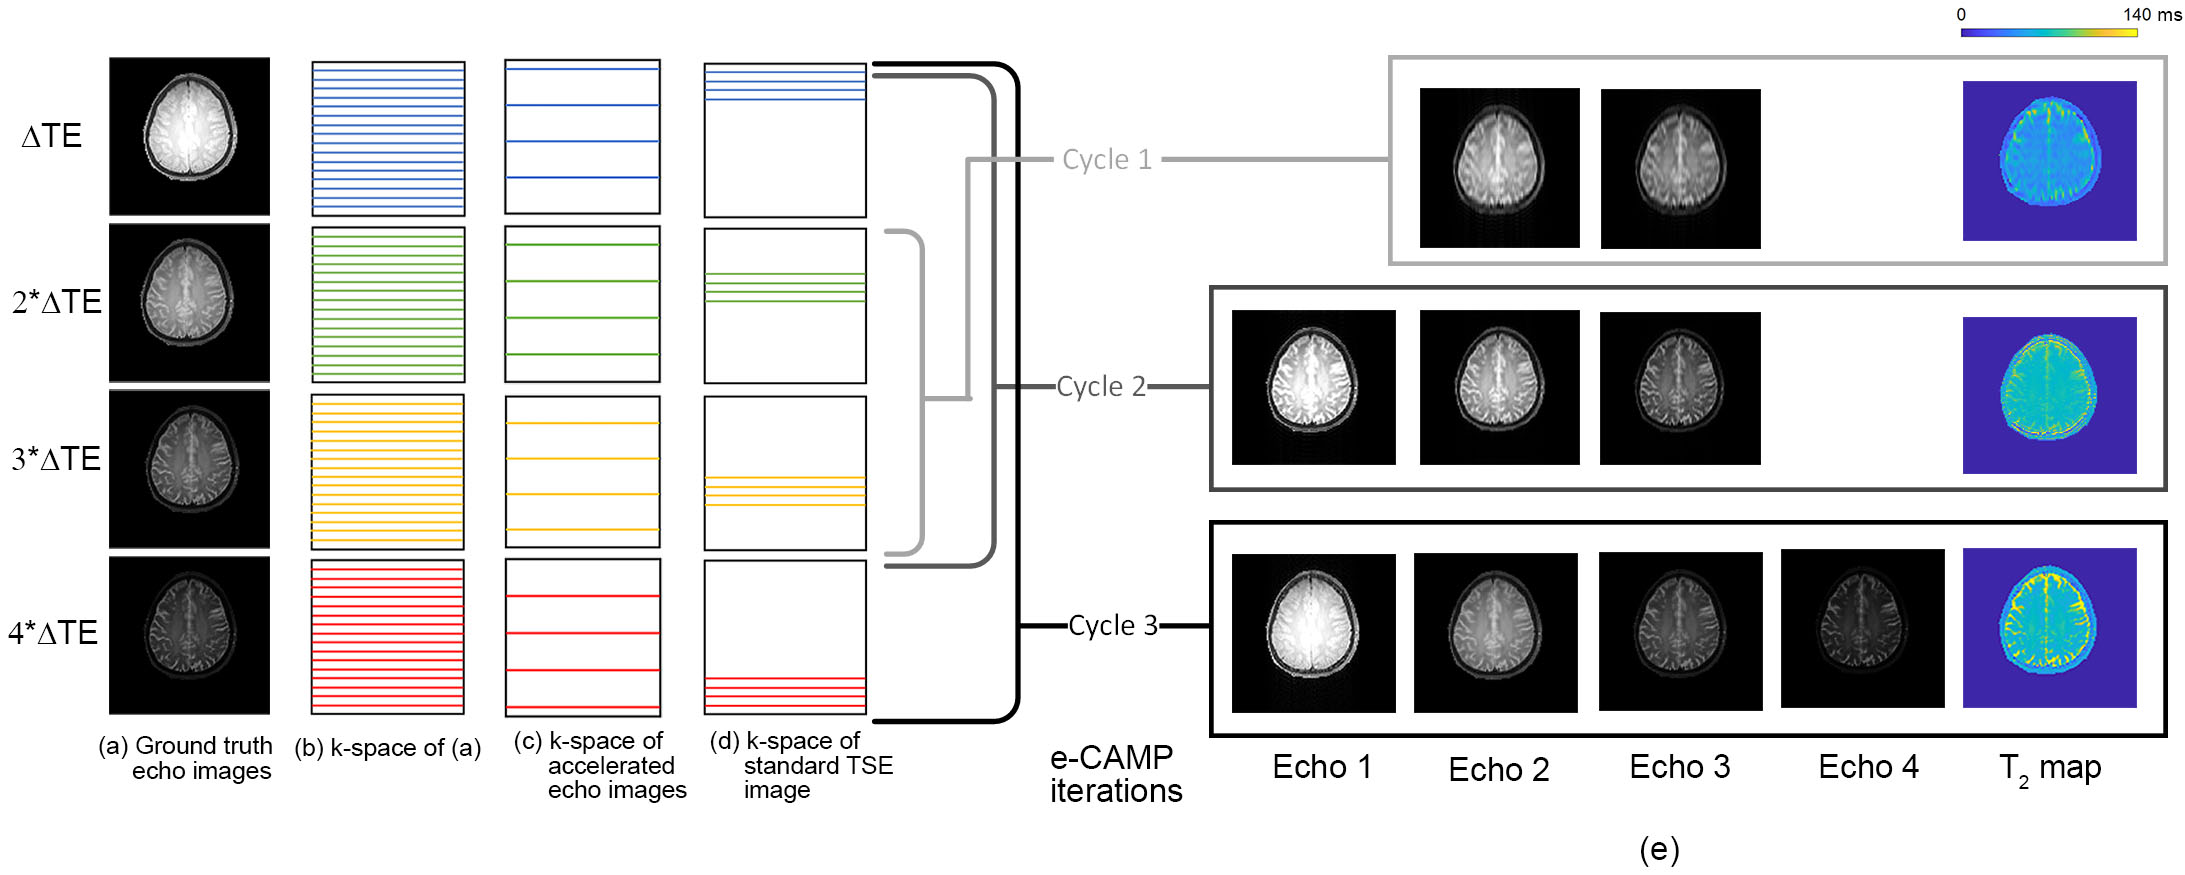
Figure 1. A framework of the e-CAMP algorithm with
four mps, where the color of the k-space lines
represents acquisition at a different ,
where (a) shows ground truth echo images (b) fully sampled k-space, (c) k-space of accelerated echo images, and (d) k-space
of standard TSE image. (e) shows the e-CAMP iterations: in cycle 1, e-CAMP
applies the CAMP algorithm to center bands until it converges. Then e-CAMP
grows the number of mps to include 3 bands (cycle 2) and finally, it
includes all the bands (cycle 3).
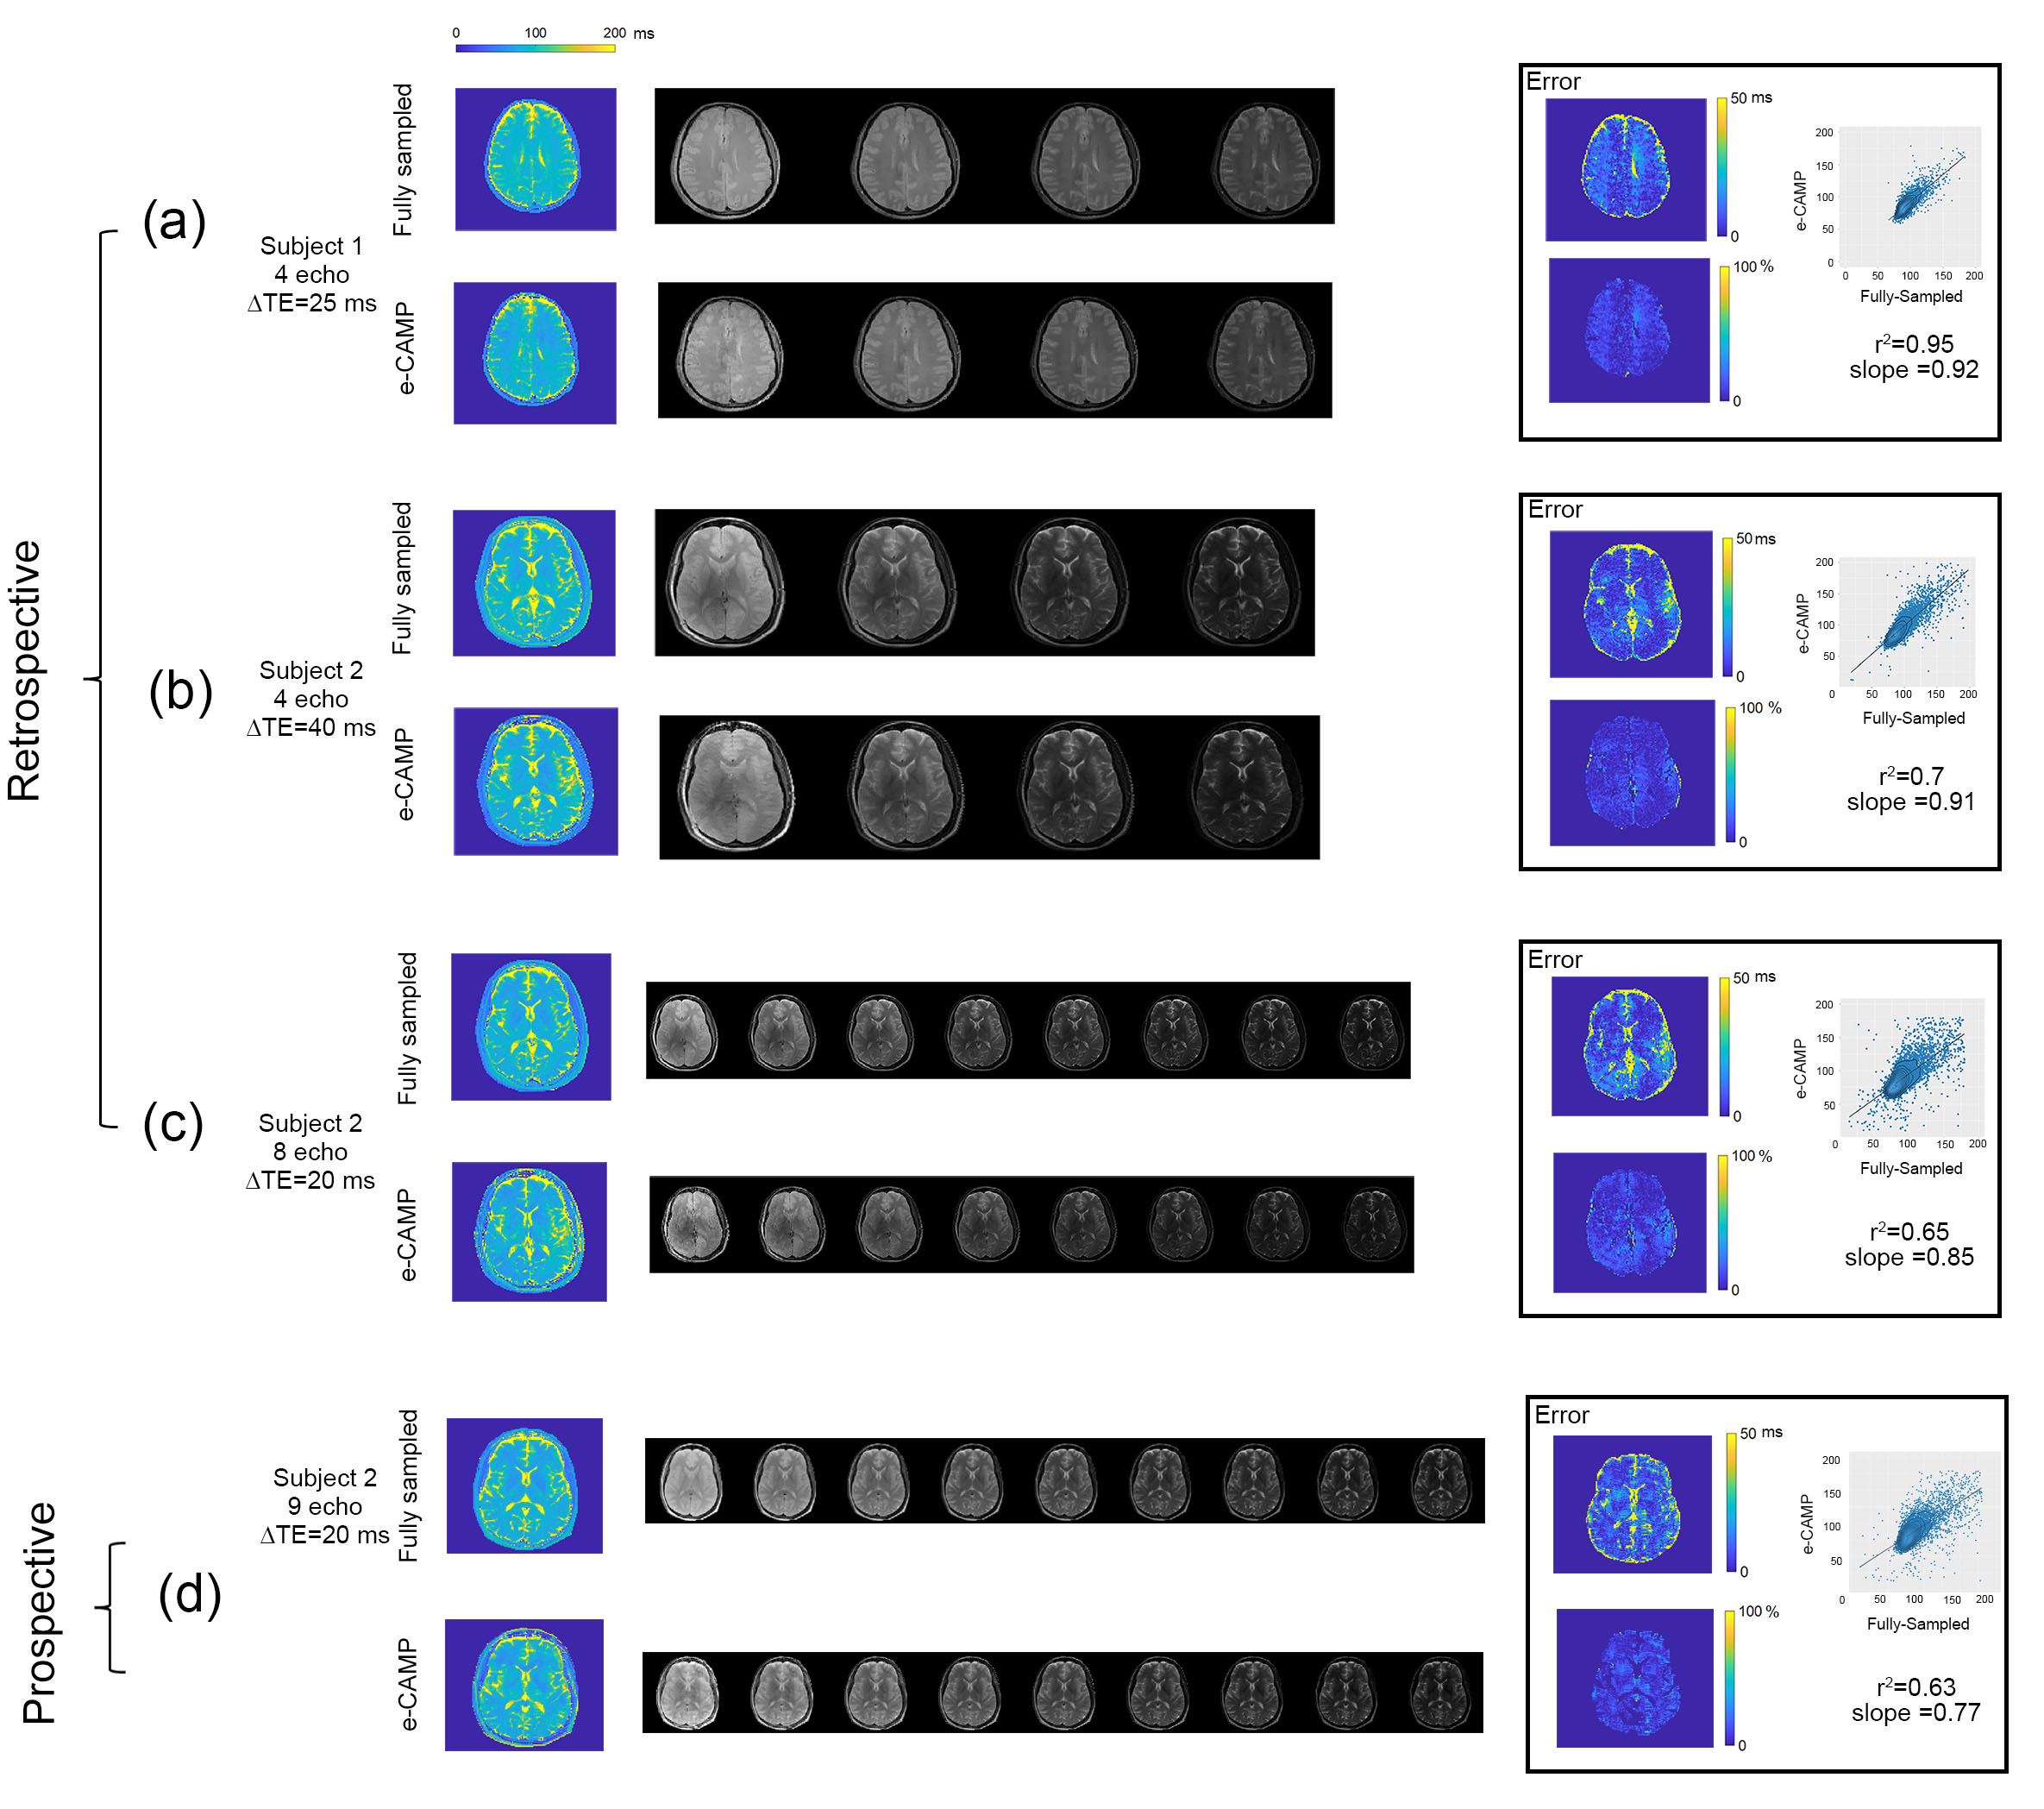
Figure 2. Retrospective and
prospective human brain experiments with: (a) four-echo results (25 ms ES), and (b) four-echo results (40 ms ES) of a different subject. (c)
eight-echo results (20 ms ES) from the same MESE acquisition of (b)
showing the fully-sampled and e-CAMP T2 maps, T2w images, absolute difference,
and normalized versions of the absolute difference. Similarly, (d) shows prospective
experiments from nine-echo experiments with 20 ms ES, showing the
fully sampled and e-CAMP T2 maps, T2w images, absolute difference, and
normalized versions of the absolute difference.
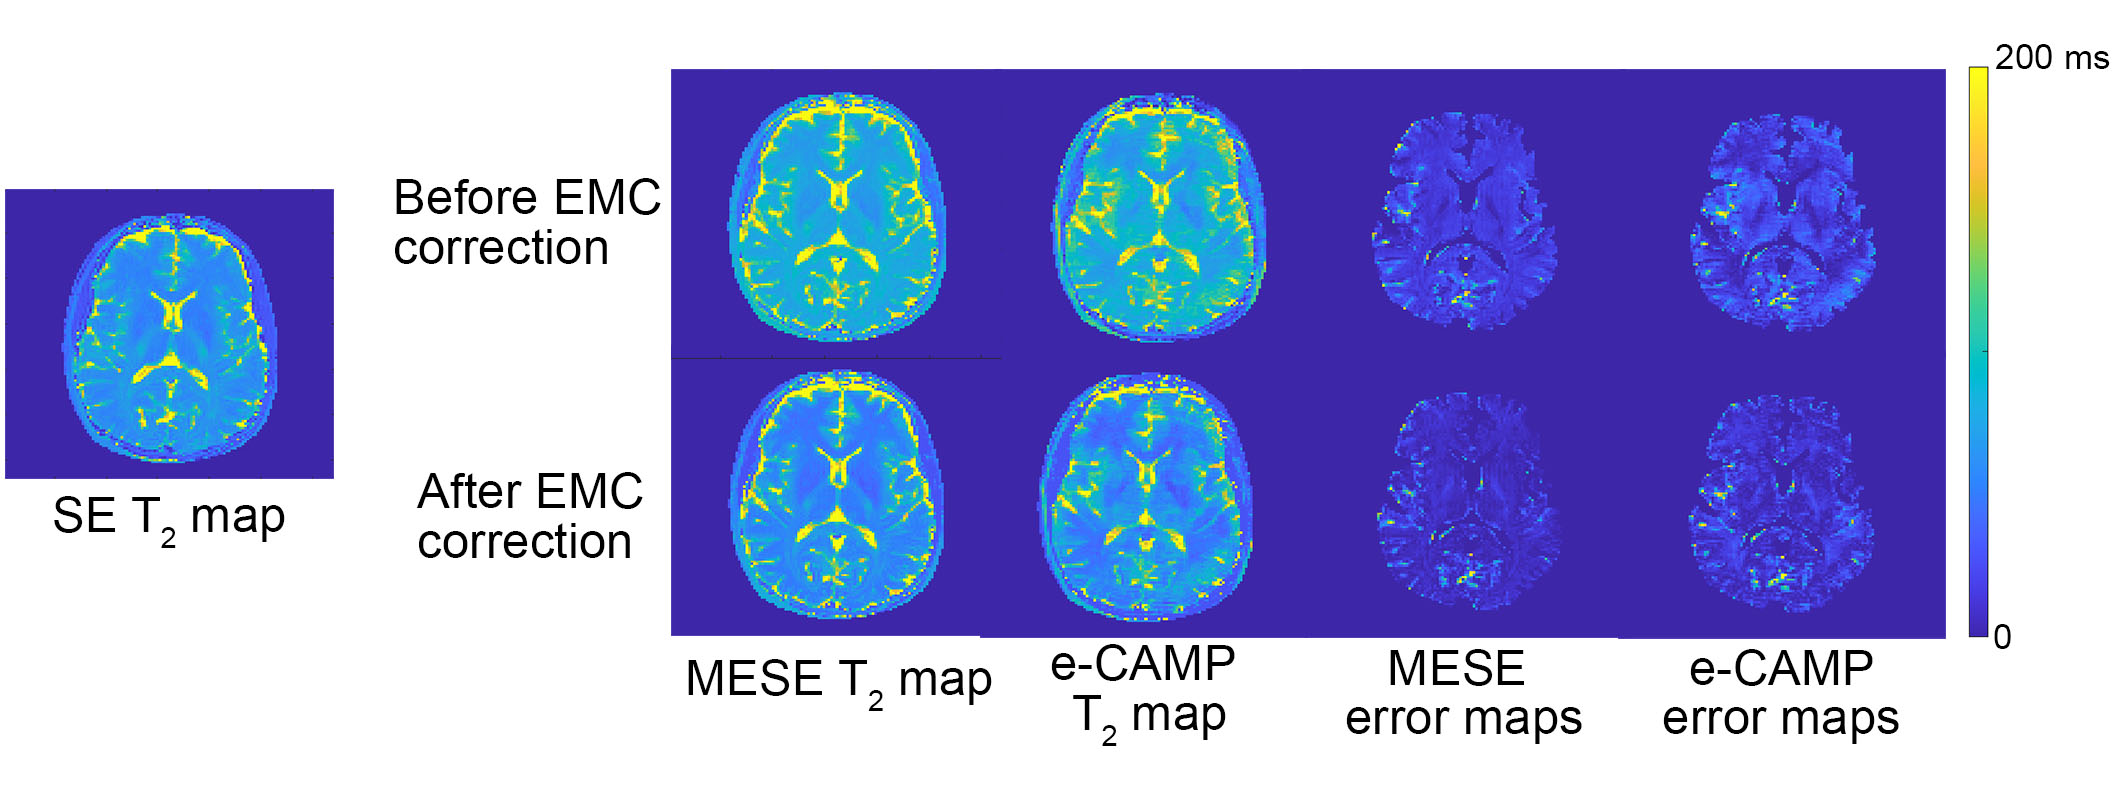
Figure 3. Prospective human
brain experiments with nine-echo results with 20 ms ES showing ground
truth SE T2 map versus fully sampled MESE T2
map and e-CAMP T2 map with their corresponding error maps. The
lower row shows the EMC-corrected versions of the fully sampled MESE T2
map and e-CAMP T2 map with their corresponding error maps.
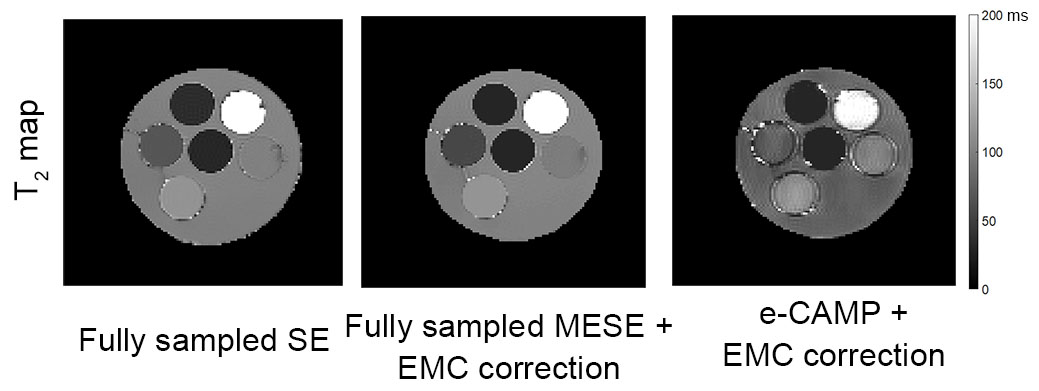
Figure 4. Prospective phantom
experiments ground truth SE T2 map versus fully sampled MESE T2
map and e-CAMP T2 map.
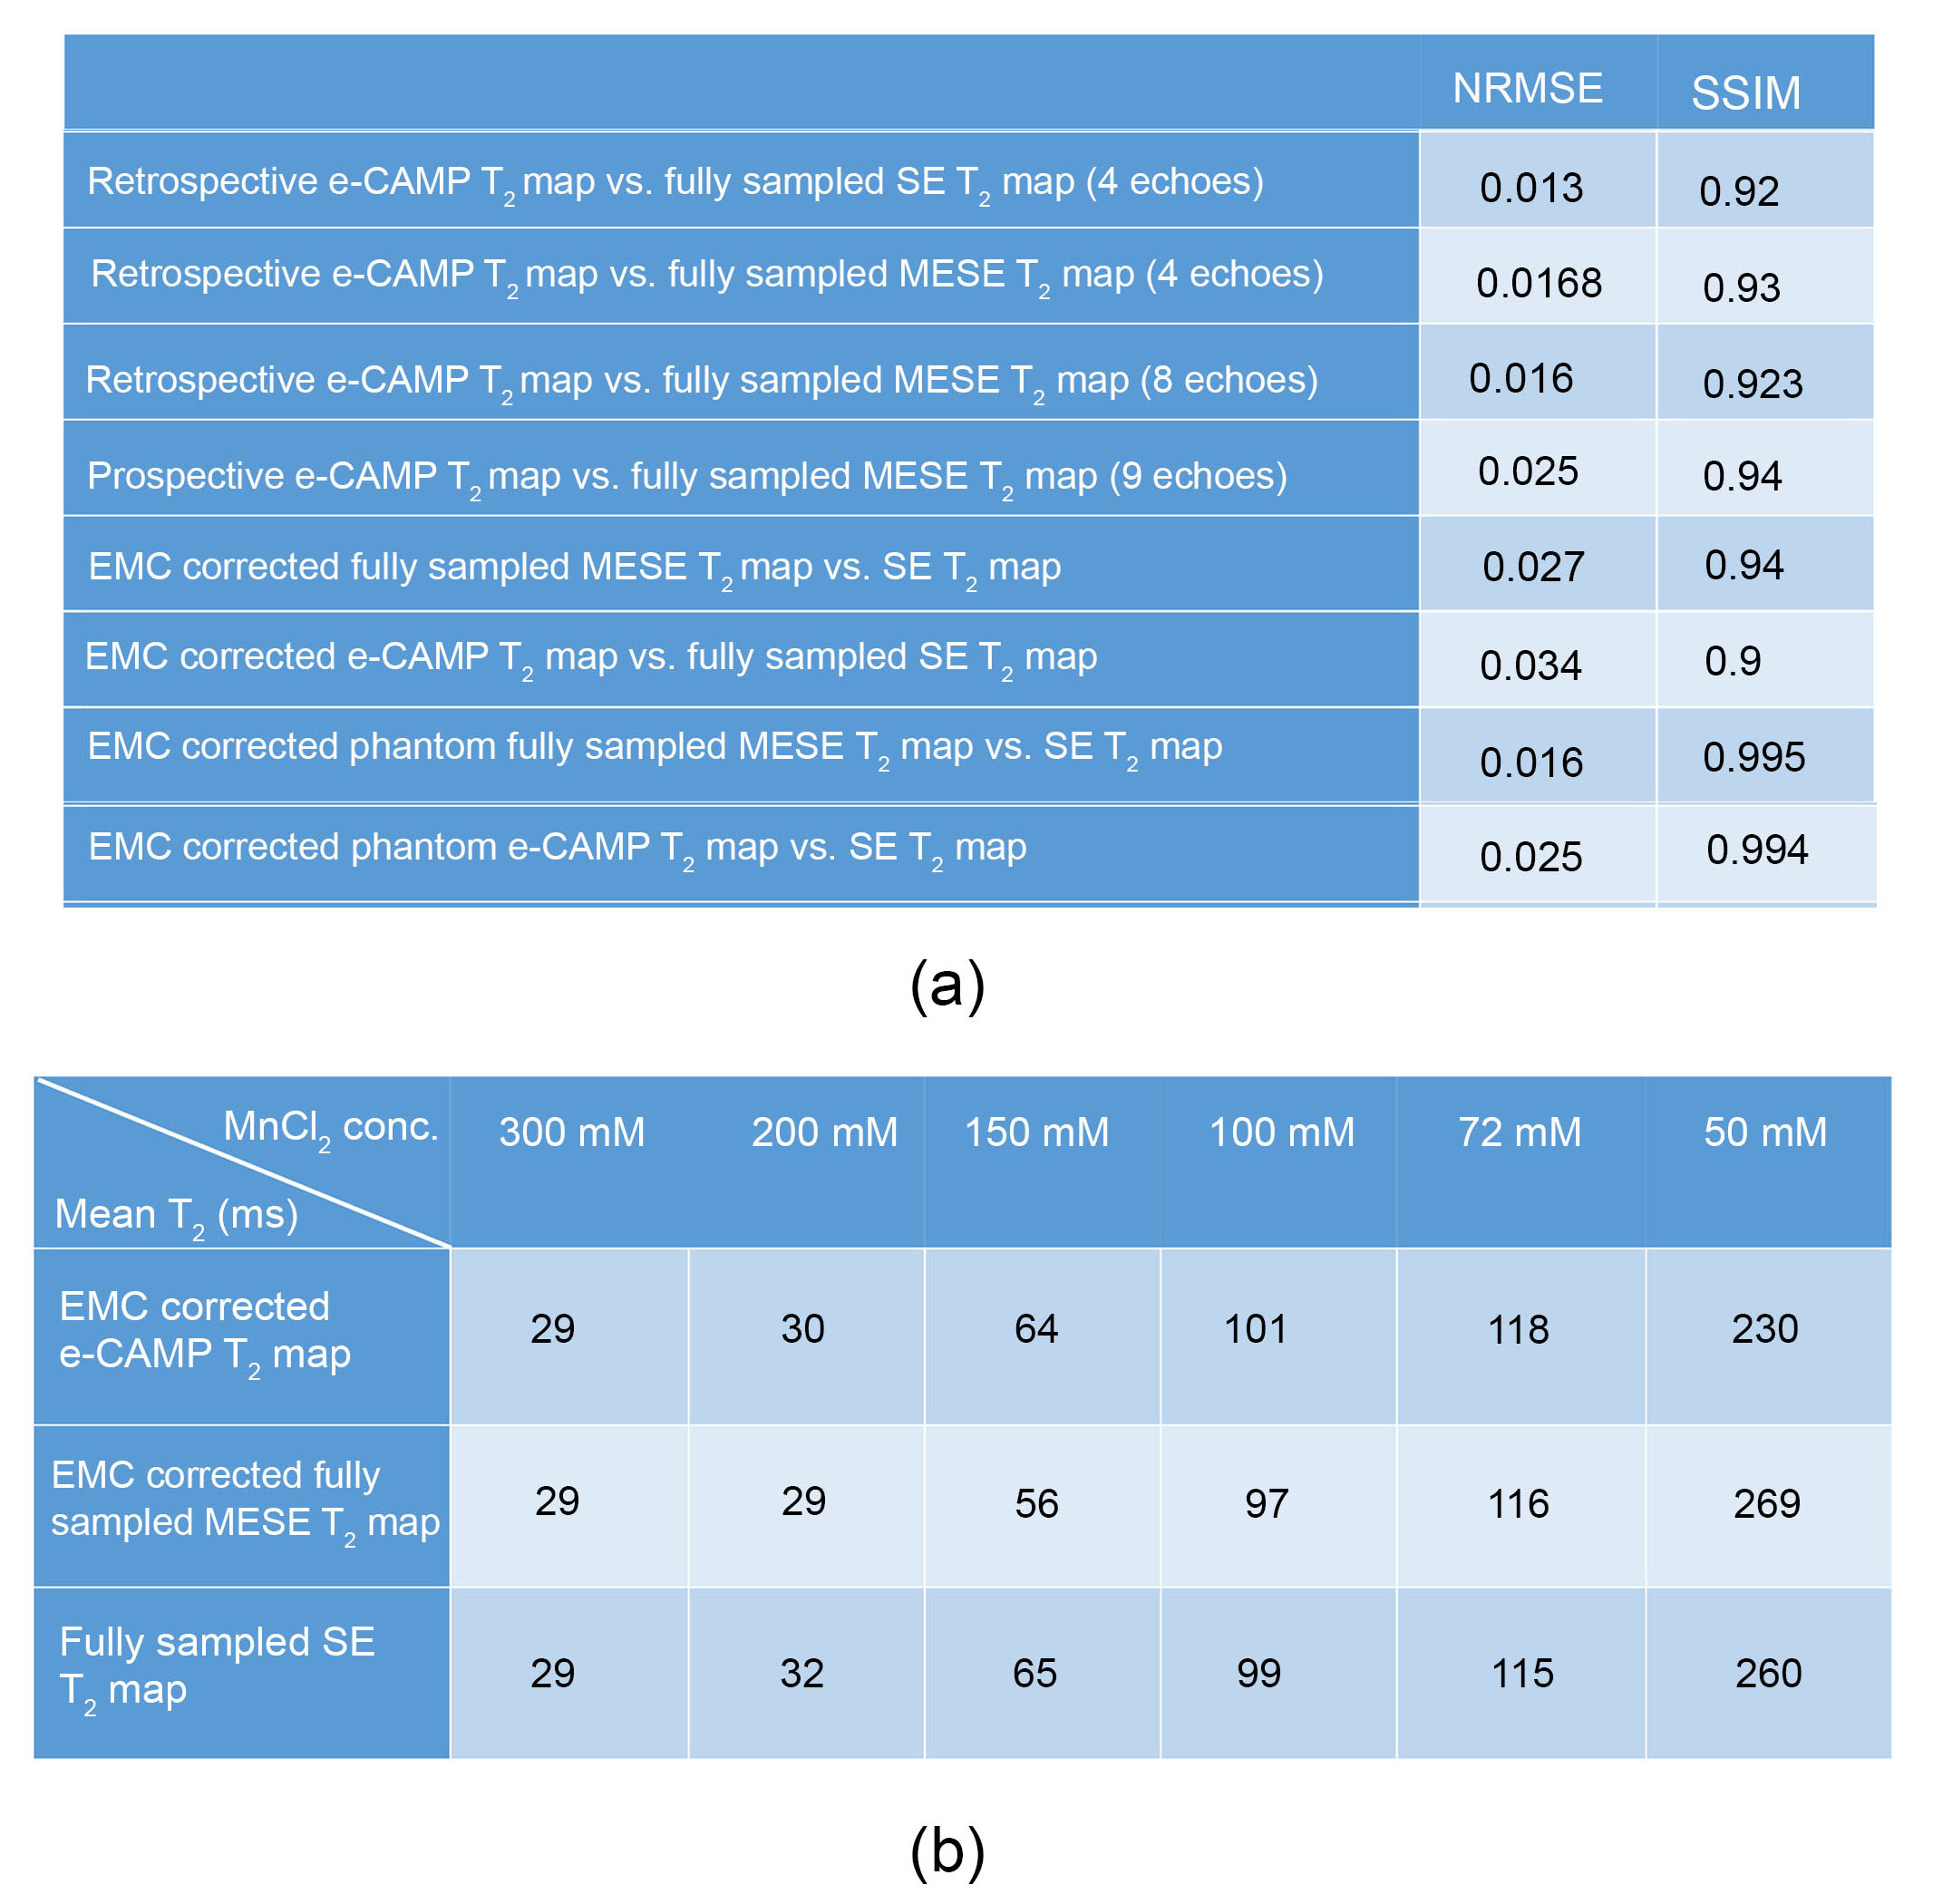
Table 1. (a) NRMSE and SSIM between
e-CAMP reconstruction T2 map and ground truth T2 map or
fully sampled reconstruction T2 map of all experiments. (b) shows e-CAMP fully sampled MESE and fully sampled SE
reconstruction mean T2 values in different MnCl2 concentrations.
DOI: https://doi.org/10.58530/2023/0288