0283
Electrical Conductivity Mapping Using Ultrashort Echo Time Double Echo Steady State1Department of Radiology, University of California, San Diego, San Diego, CA, United States, 2Radiology Service, Veterans Affairs San Diego Healthcare System, San Diego, CA, United States, 3Department of Bioengineering, University of California, San Diego, San Diego, CA, United States
Synopsis
Keywords: Quantitative Imaging, Electromagnetic Tissue Properties
Electrical conductivity is an intrinsic tissue property. At the Larmor frequency of the MR system (i.e., ~128 MHz at 3T), the electrical conductivity reflects the tissue composition and ionic contents. Electrical conductivity mapping (ECM) has recently emerged as a promising MR-based biomarker. In this study, we show the feasibility of ECM using ultrashort echo time double echo steady state (UTE-DESS). In addition, three ECM methods, including forward Laplacian, parabolic fitting, and inverse Laplacian, are compared in computer simulation and ex vivo experiments with four cadaveric human brain specimens.Introduction
Electrical conductivity is a fundamental characteristic of substances. The conductivity of biological tissues depends on frequency1. At a low frequency (~100Hz), the tissue undergoes alpha dispersion, where the conductivity is a function of both cell membrane and composition. In the high-frequency range (~100MHz), such as in MRI, the tissue undergoes delta dispersion where the impedance from the cell membrane becomes negligible, and the conductivity reflects the tissue composition and ionic contents. In an MRI system, the phase of the transmit B1 field (B1+) is influenced by the electrical conductivity of the object. Recently, electrical conductivity mapping (ECM) utilizing this property has emerged as a new promising MRI technique2–5. The simplest approach to estimating a conductivity map from the B1+ phase map is directly applying Laplacian to the B1+ phase, termed the forward Laplacian (FL) approach. This approach is highly susceptible to noise, so appropriate pre- or post-processing is necessary6. Another promising approach is 3D parabolic fitting (PF)3,7, which is more robust to noise. Alternatively, the inverse Laplacian (IL) approach has been investigated8,9, in which nonlinear optimization is used to solve an equation to find the best estimate of the conductivity map based on the measured B1+ phase and additional regularization. To obtain the B1+ phase, conventional spin echo1,3,10 and steady-state free precession (SSFP) have been commonly used11,12. In this study, we investigated the feasibility of ultrashort echo time double echo steady state (UTE-DESS) based ECM.Methods
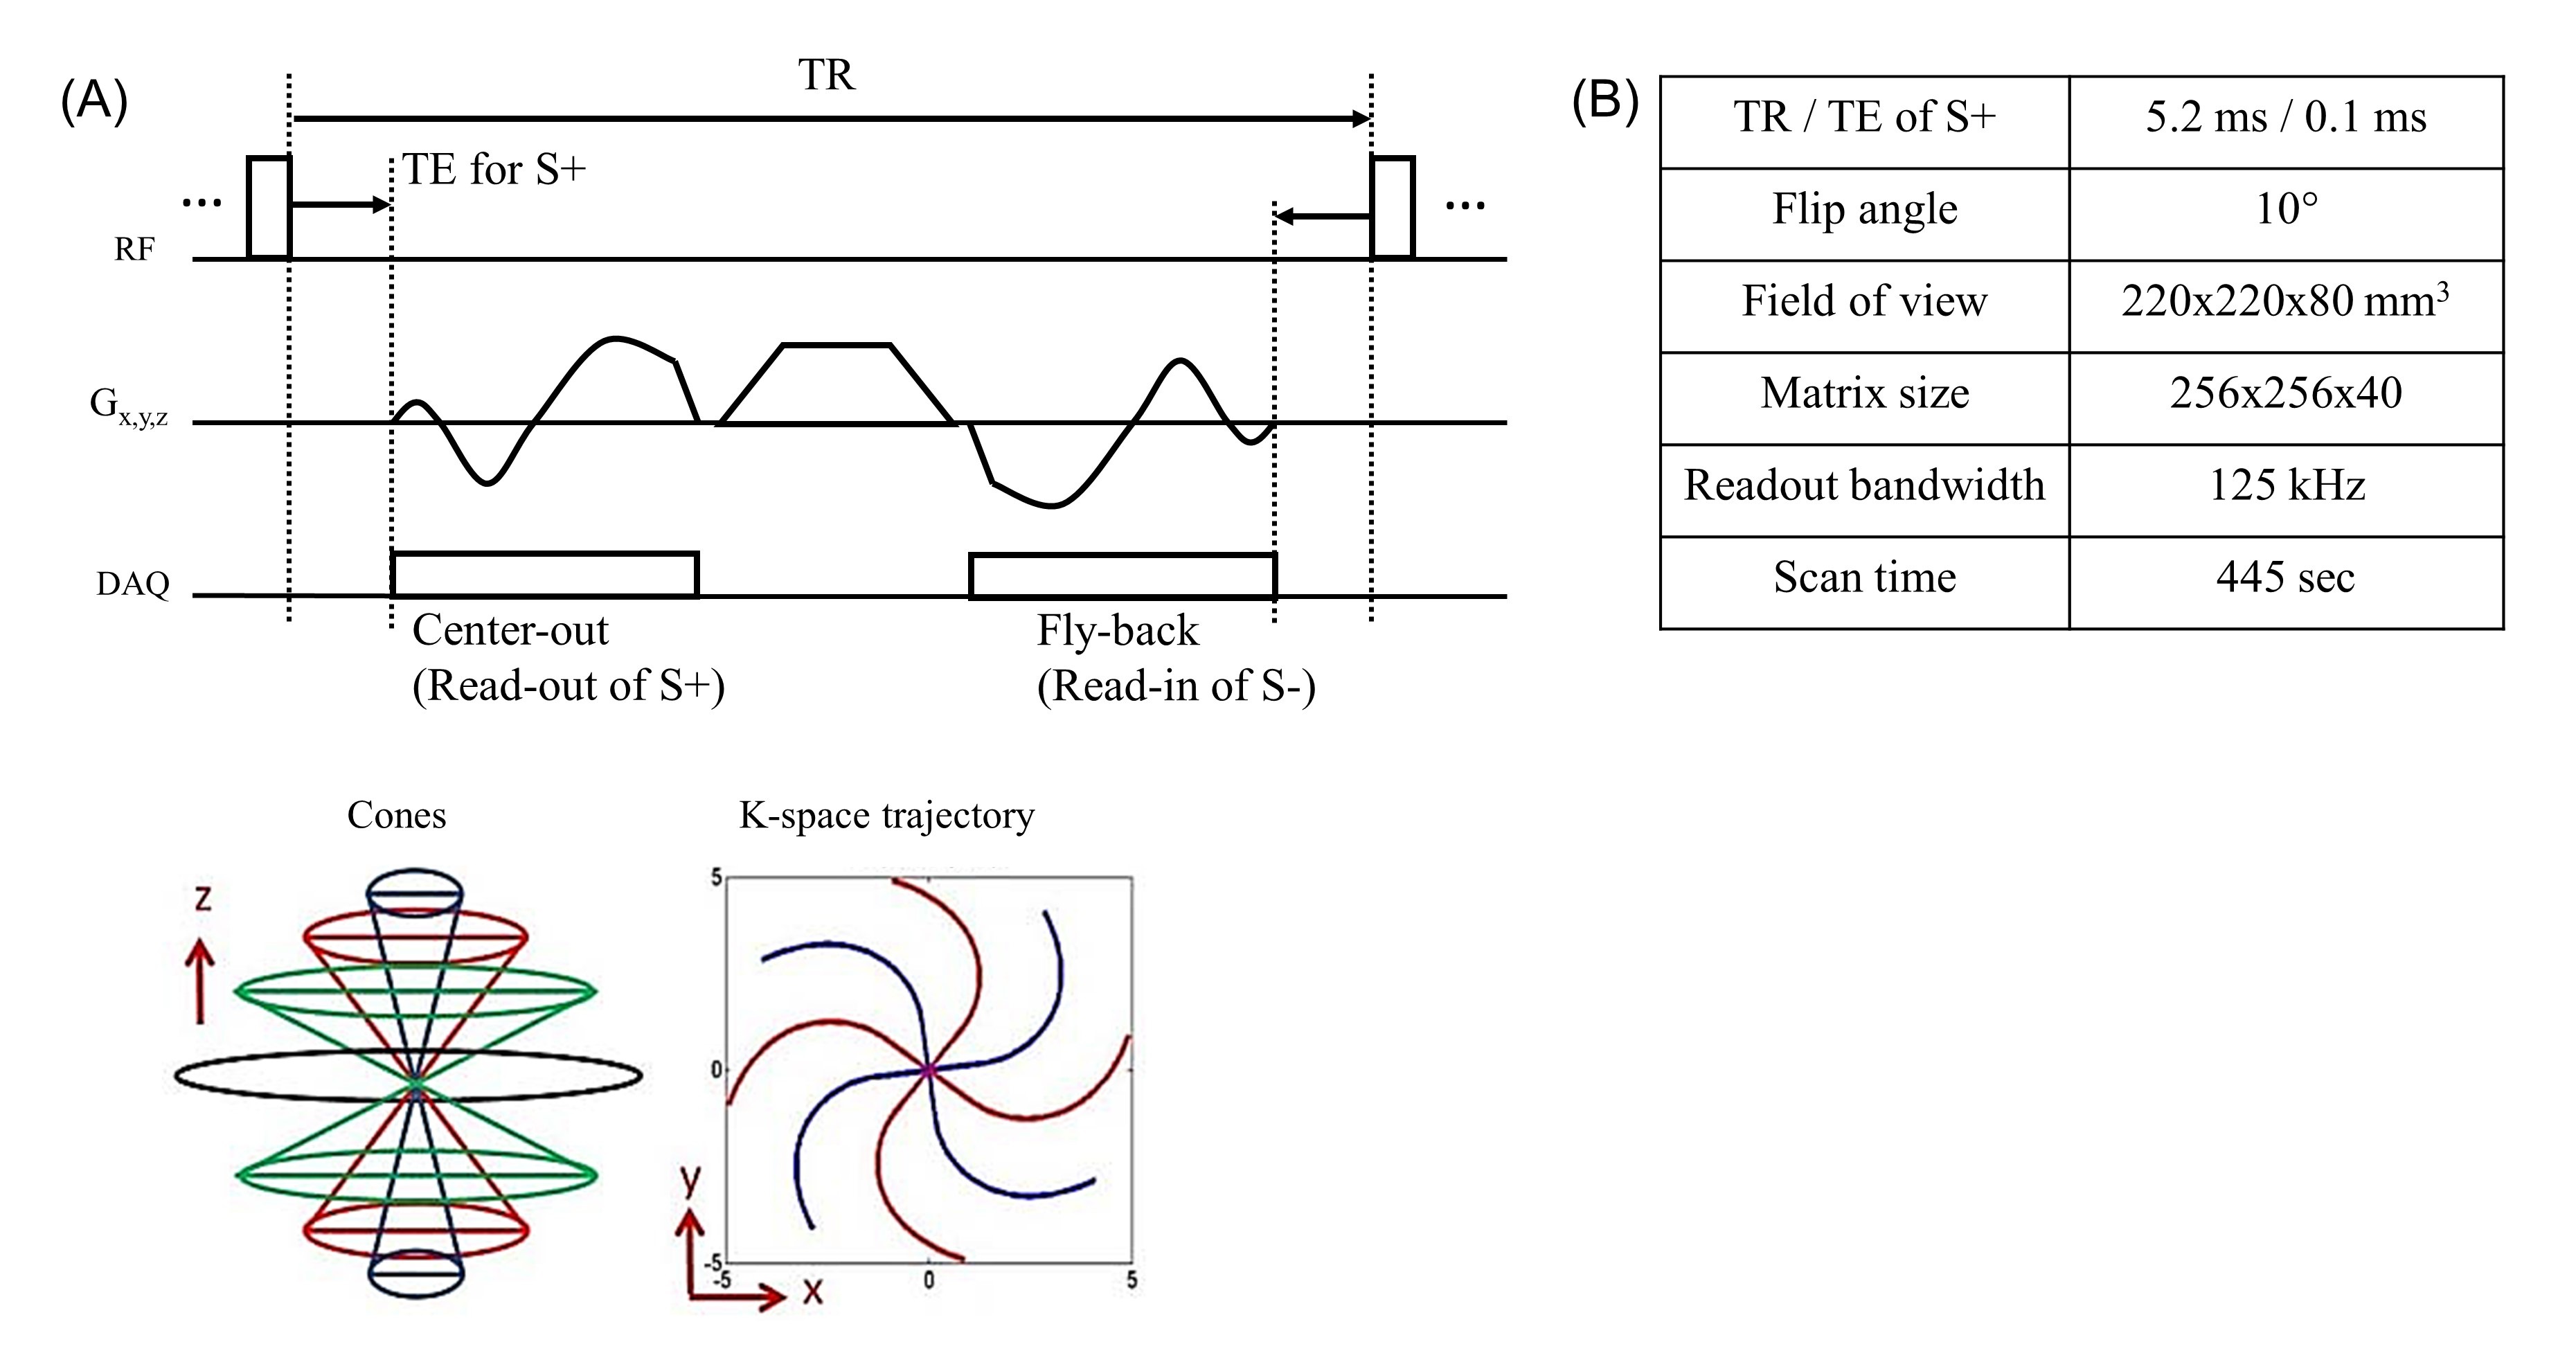
UTE-DESS: The UTE-DESS sequence based on a 3D Cones-trajectory13 was utilized to acquire the input B1+ phase map. Figure 1 shows the pulse sequence diagram and imaging parameters. UTE-DESS is based on the steady state of transverse magnetization similar to SSFP, but the signal is separated into S+ and S- using a spoiling gradient. In UTE-DESS, the B1 phase can be estimated by averaging S- and S+ phases13. This is possible because of time-reversed signal formation of S- which can be used to cancel other phase errors occurring through free induction decay, leaving only B1 phase. The B1+ phase was assumed to be half of the total B1 phase14.ECM: ECM was based on a simplified Maxwell's equation using B1+ phase, $$$\phi^+$$$, such that $$$\sigma=\frac{\nabla^{2}\phi^+}{\omega\mu _0}$$$, where $$$\sigma$$$ denotes electrical conductivity, $$$\omega$$$ represents a resonance frequency, and $$$\mu _0$$$ denotes magnetic permeability in free space. The measured B1+ phase was preprocessed with bilateral filtering to suppress noise. In the FL method, the B1+ phase was directly convolved with a 3x3x3 Laplacian kernel. In the PF method, the coefficients for 3D second-order polynomial were determined by conducting least square fitting on the B1+ phase within a 3D kernel (8x8x8mm3) in the manner of a sliding window. The resultant net curvature was used to calculate conductivity. The IL method was implemented using a gradient descent method to solve $$$\sigma=argmin||\phi^+_m-\phi^+(\sigma)||^2 + \lambda TV(\sigma)$$$, where $$$\phi^+_m$$$ denotes the measured B1+ phase, $$$\phi^+(\sigma)$$$ denotes the B1+ phase inversely calculated based on estimated conductivity, TV represents a total variation operator used as a smoothness constraint, and $$$\lambda$$$ is the regularization parameter.
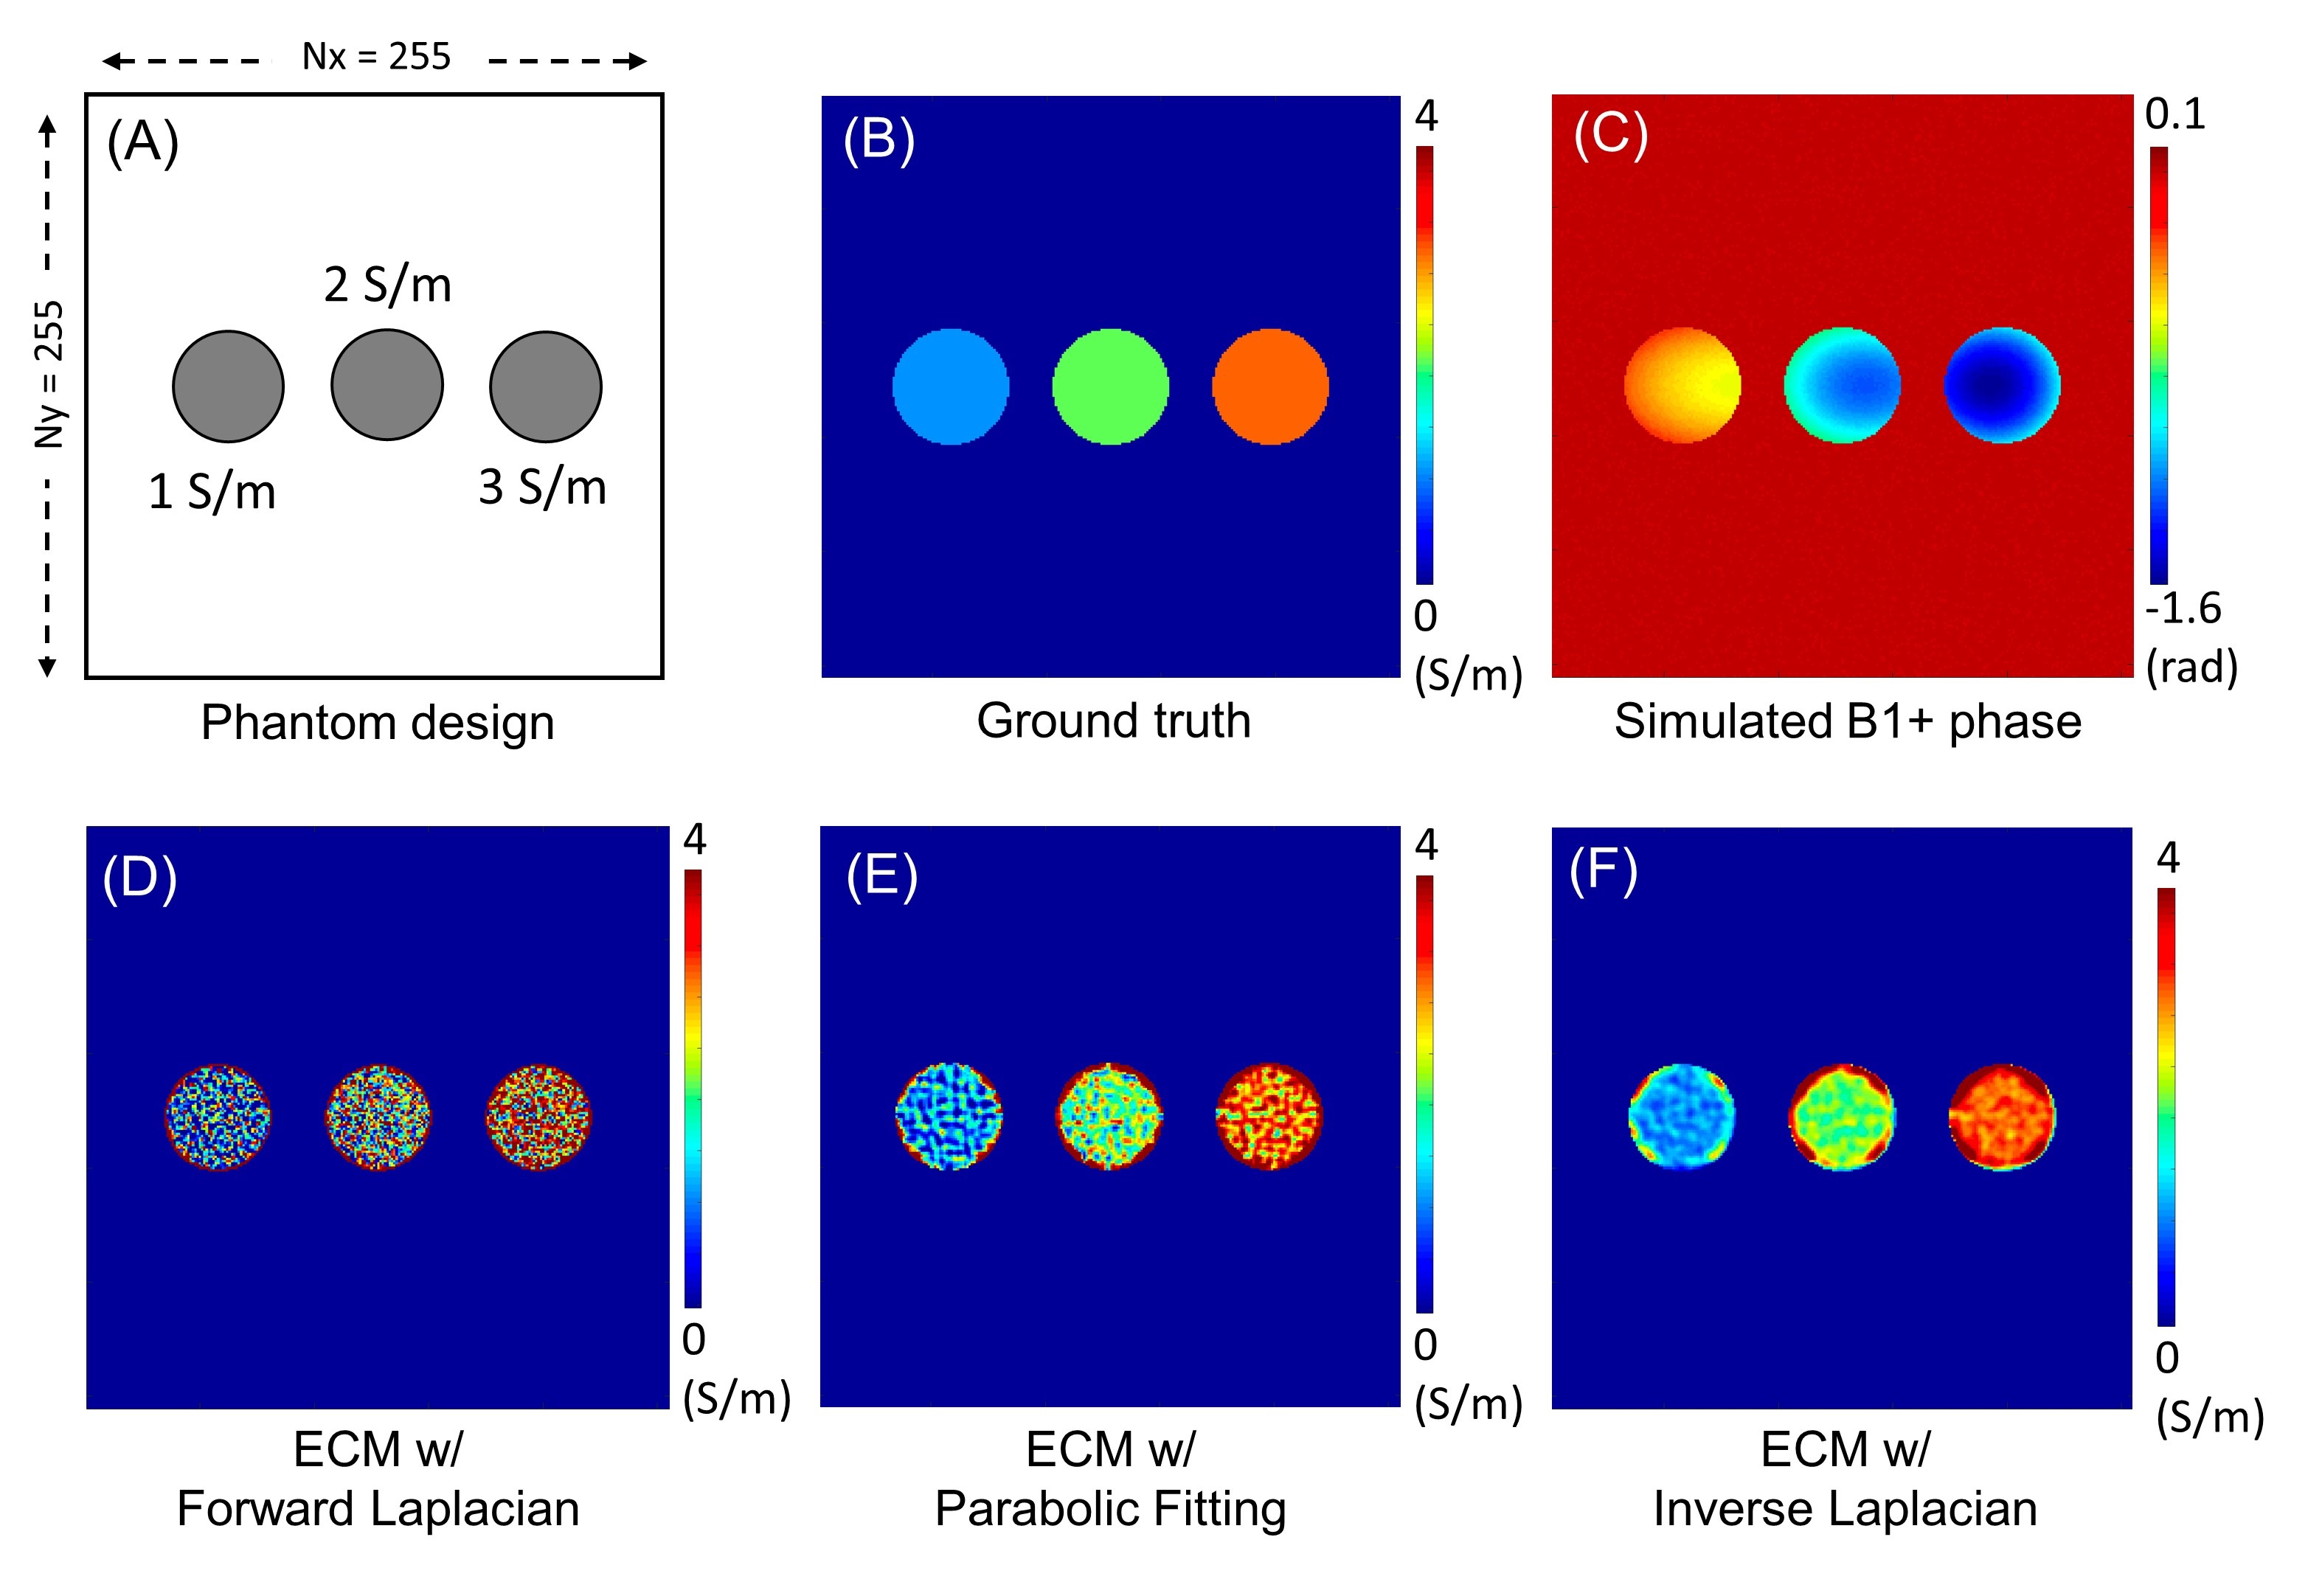
Experiments: A computer simulation was performed to evaluate the implemented ECM methods using a 2D digital phantom comprised of tubes with conductivities of 1, 2, and 3 S/m. The simulated B1+ phase was added with Gaussian noise with a standard deviation of 0.001 radians and processed with the three developed ECM algorithms (FL, PF, and IL). An ex vivo MRI experiment was performed in a 3T clinical MRI scanner (MR750, GE Healthcare). A total of four fresh human brain specimens were scanned using the UTE-DESS sequence with an 8-channel receive-only head coil.
Results
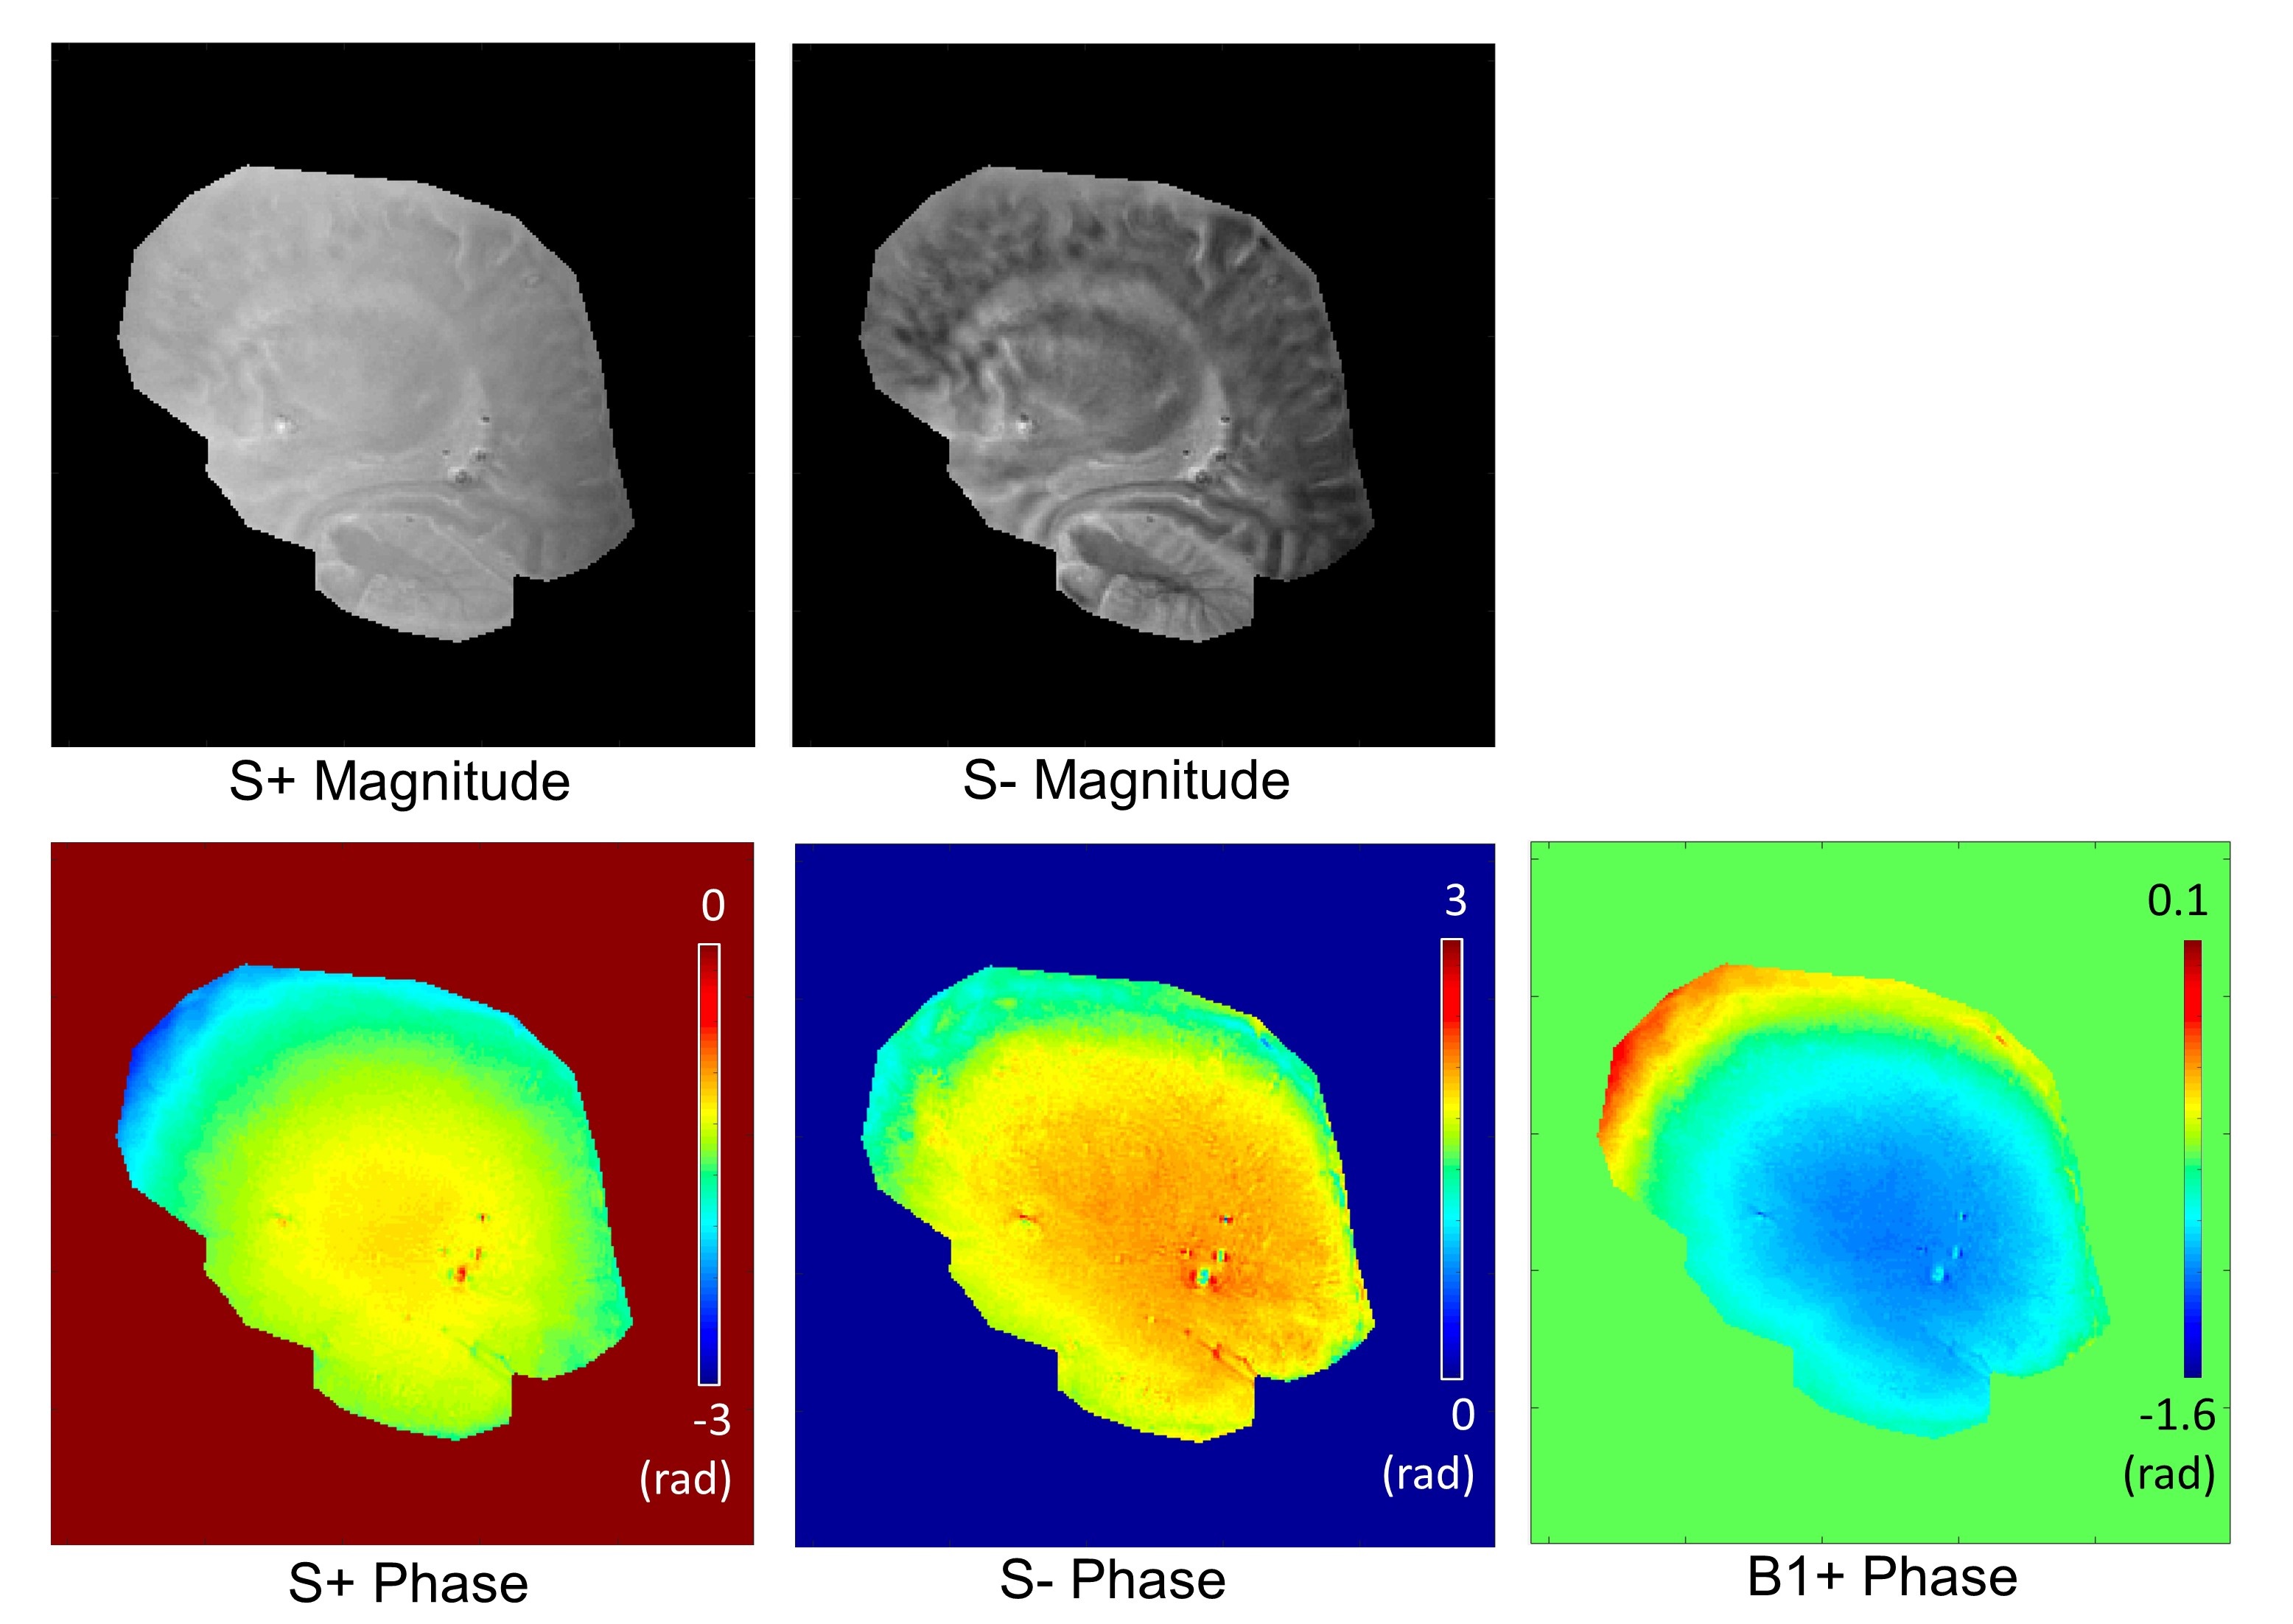
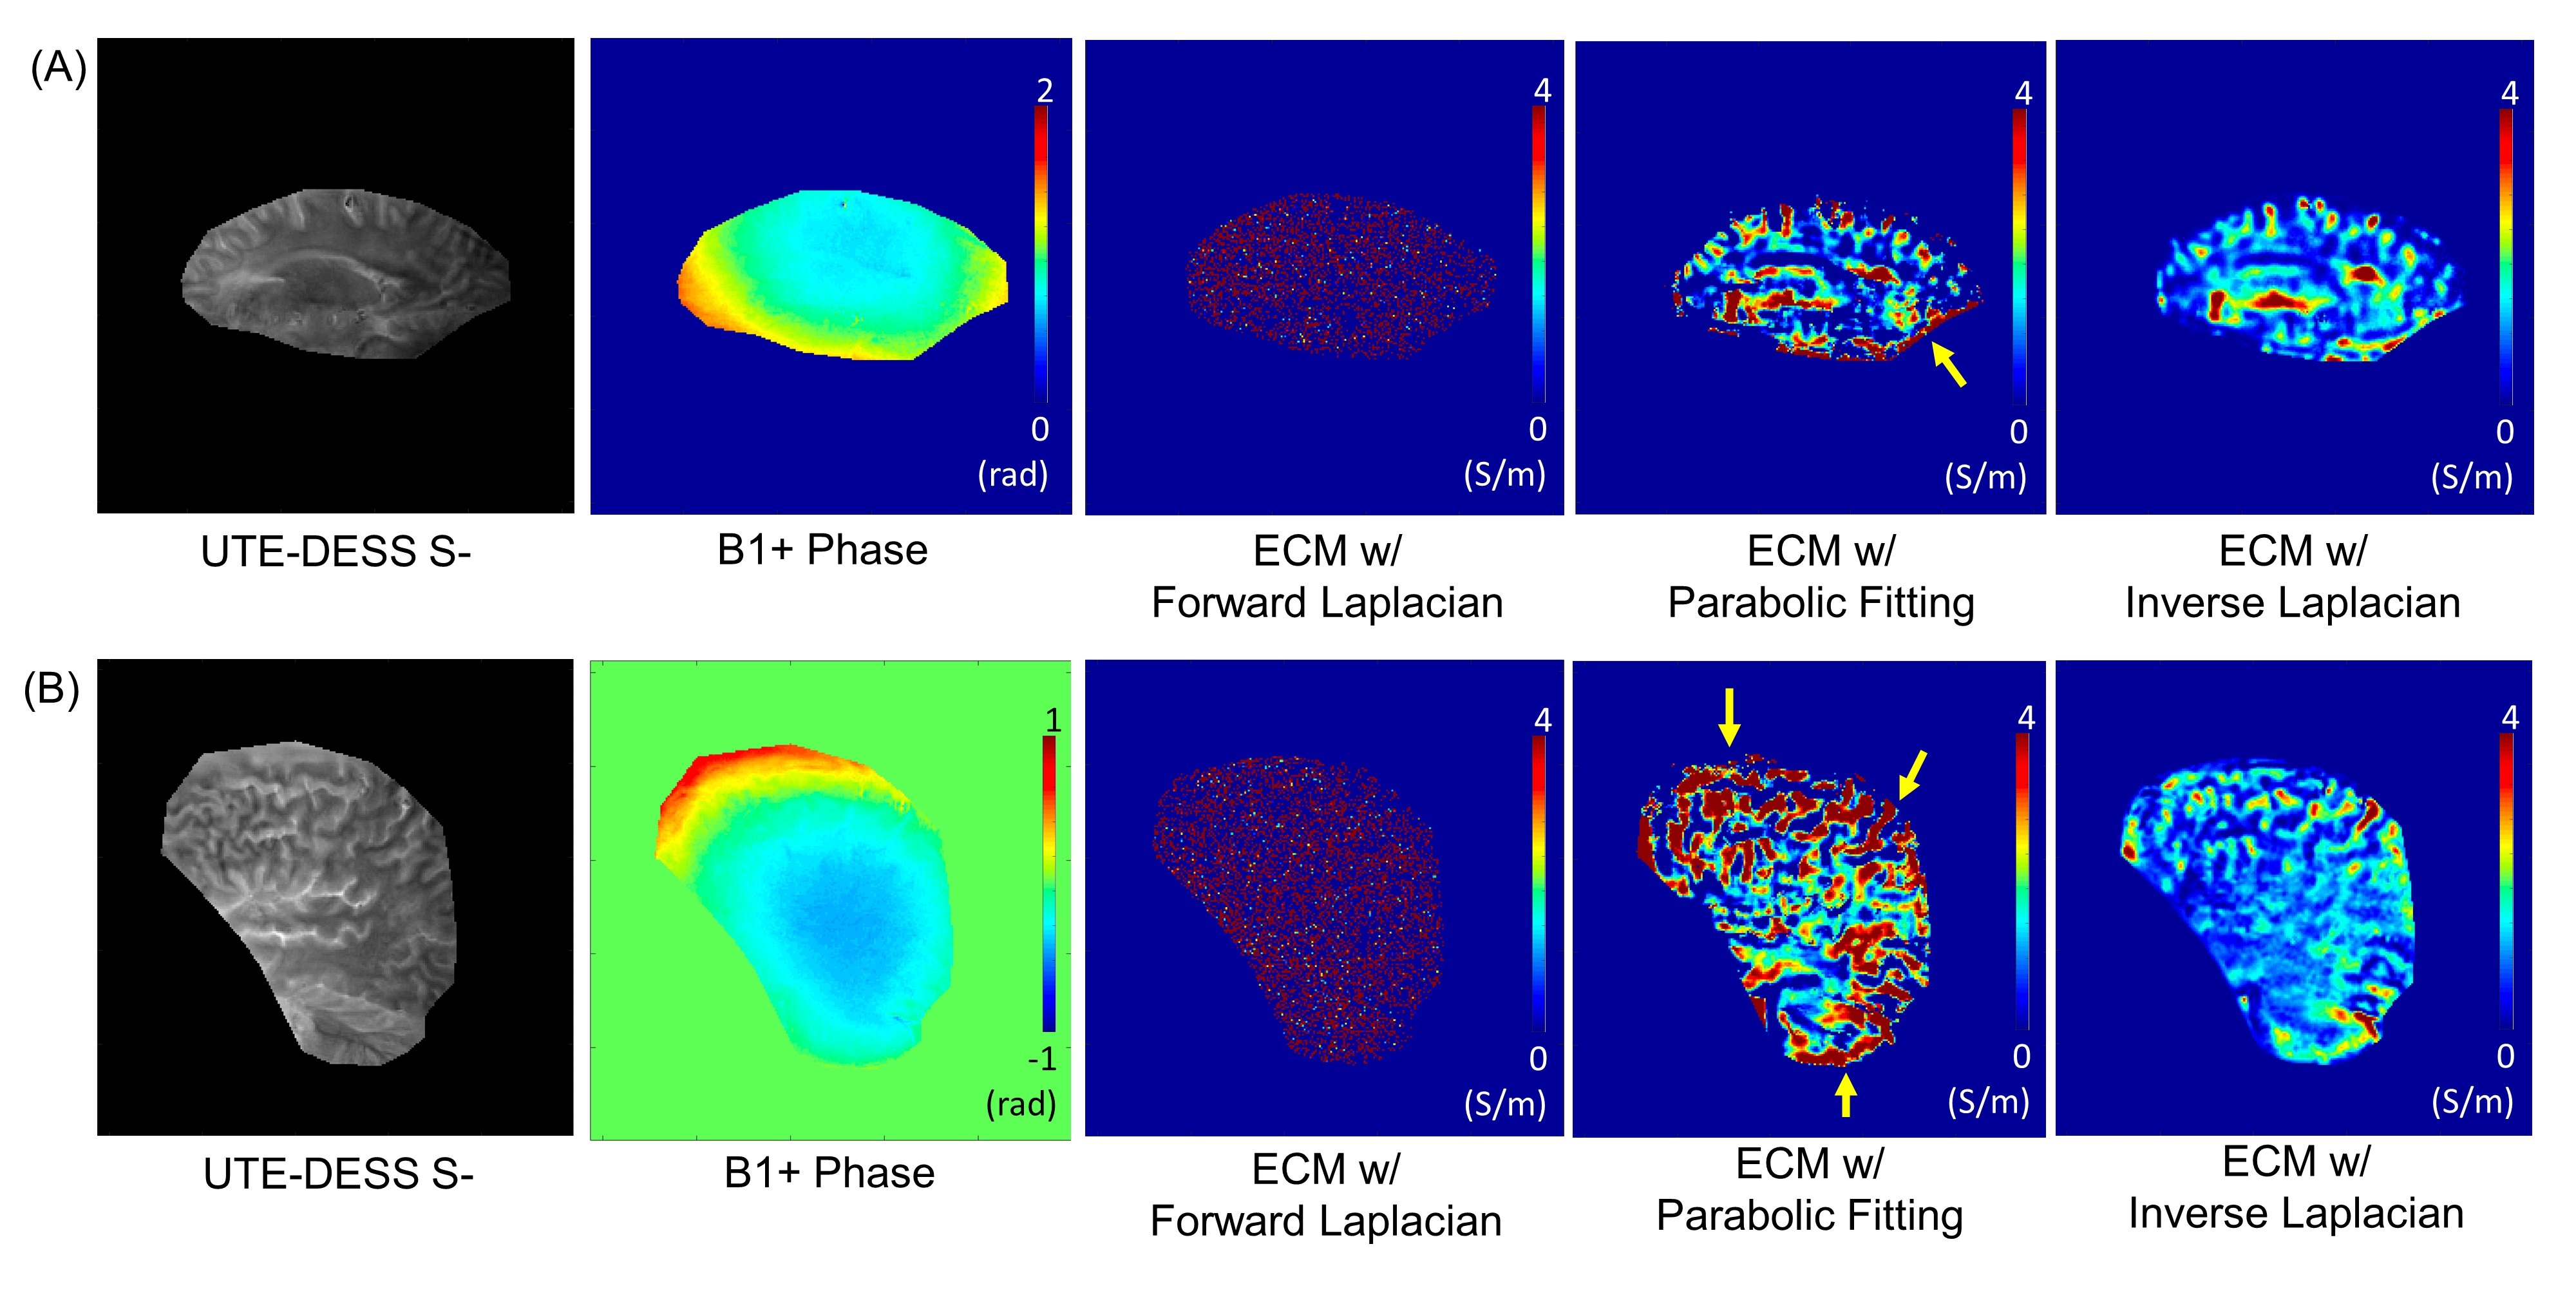
Figure 2 shows the computer simulation results. The simulated B1+ phase shows a typical parabolic shape where the curvature increases with higher conductivity (Figure 2C). FL yielded a highly noisy conductivity map (Figure 2D), while PF improved the result (Figure 2E). IL showed the best results with much-reduced sensitivity to the noise (Figure 2F). This finding was consistently observed in all human brain specimens. Figure 3 shows the S+ and S- images from UTE-DESS and the resultant B1+ phase used for the subsequent ECM process. Figure 4 shows two representative brain specimens showing ECM results. FL showed very noisy conductivity maps, while PF improved the results with reduced noise. IL noticeably improved the conductivity maps with dramatically reduced boundary artifacts (yellow arrows), a typical artifact in ECM resulting from the violation of homogeneous assumption15. Overall, in the ECM with IL, the conductivity values of gray matter (~2 S/m) appeared to be higher than that of white matter (< 1 S/m), which is consistent with the previous findings in the literature8,16.Discussion and Conclusion
We showed the feasibility of the UTE-DESS sequence for ECM in the MRI system. UTE-DESS allows much shorter echo times than conventional spin echo or SSFP, which may be beneficial for ECM of short T2 tissues. As ECM is highly sensitive to noise, the proposed UTE-DESS with a time-efficient 3D Cones-trajectory will be beneficial for improving the signal-to-noise ratio for in vivo ECM targeting both long and short T2 tissues. In future studies, we will apply the developed sequence and ECM processing algorithms in neuro and musculoskeletal applications.Acknowledgements
The authors acknowledge grant support from the NIH (R01AR078877, R01AR062581, R01AR068987, R01AR075825, R01AR079484, RF1AG075717, and R21AR075851), Veterans Affairs (I01CX001388, I01CX002211, I01RX00260), the DFG (SE 3272/1-1), and GE Healthcare.References
1. Kim D-H, Chauhan M, Kim M-O, et al. Frequency-Dependent Conductivity Contrast for Tissue Characterization Using a Dual-Frequency Range Conductivity Mapping Magnetic Resonance Method. IEEE Trans. Med. Imaging 2015;34:507–513.
2. Van Lier ALHMW, Raaijmakers A, Voigt T, et al. Electrical properties tomography in the human brain at 1.5, 3, and 7T: A comparison study. Magn. Reson. Med. 2014;71:354–363.
3. Shin J, Kim MJ, Lee J, et al. Initial study on in vivo conductivity mapping of breast cancer using MRI. J. Magn. Reson. Imaging 2015;42:371–378.
4. Michel E, Hernandez D, Lee SY. Electrical conductivity and permittivity maps of brain tissues derived from water content based on T1-weighted acquisition. Magn. Reson. Med. 2017;77:1094–1103.
5. Katscher U, Kim D-H, Seo JK. Recent Progress and Future Challenges in MR Electric Properties Tomography. Comput. Math. Methods Med. 2013;2013:1–11.
6. Liu C, Jin J, Guo L, et al. MR-based electrical property tomography using a modified finite difference scheme. Phys. Med. Biol. 2018;63.
7. Katscher U, Djamshidi K, Voigt T, et al. Estimation of breast tumor conductivity using parabolic phase fitting. Proc. Intl. Soc. Mag. Reson. Med. 2012;20:3482.
8. Ropella KM, Noll DC. A regularized, model-based approach to phase-based conductivity mapping using MRI. Magn. Reson. Med. 2017;78:2011–2021.
9. Borsic A, Perreard I, Mahara A, Halter RJ. An inverse problems approach to MR-EPT image reconstruction. IEEE Trans. Med. Imaging 2016;35:244–256.
10. Kim SY, Shin J, Kim DH, et al. Correlation between conductivity and prognostic factors in invasive breast cancer using magnetic resonance electric properties tomography (MREPT). Eur. Radiol. 2016;26:2317–2326.
11. Tha KK, Katscher U, Yamaguchi S, et al. Noninvasive electrical conductivity measurement by MRI: a test of its validity and the electrical conductivity characteristics of glioma. Eur. Radiol. 2018;28:348–355.
12. Liu J, Wang Y, Katscher U, He B. Electrical Properties Tomography Based on B1Maps in MRI: Principles, Applications, and Challenges. IEEE Trans. Biomed. Eng. 2017;64:2515–2530.
13. Jang H, Ma Y, Carl M, Jerban S, Chang EY, Du J. Ultrashort echo time Cones double echo steady state (UTE‐Cones‐DESS) for rapid morphological imaging of short T 2 tissues. Magn. Reson. Med. 2021;86:881–892.
14. Lee J, Shin J, Kim DH. MR-based conductivity imaging using multiple receiver coils. Magn. Reson. Med. 2016;76:530–539.
15. Seo JK, Kim MO, Lee J, et al. Error analysis of nonconstant admittivity for MR-based electric property imaging. IEEE Trans. Med. Imaging 2012;31:430–437.
16. Kim DH, Choi N, Gho SM, Shin J, Liu C. Simultaneous imaging of in vivo conductivity and susceptibility. Magn. Reson. Med. 2014;71:1144–1150.
Figures