0281
Systematic assessment of published QSM inversion algorithms for detecting longitudinal changes in brain susceptibility1Buffalo Neuroimaging Analysis Center, Department of Neurology, Jacobs School of Medicine and Biomedical Sciences, University at Buffalo, The State University of New York, Buffalo, NY, United States, 2Department of Computer Science and Automation, Technische Universität Ilmenau, Ilmenau, Germany, 3IRCCS, Fondazione Don Carlo Gnocchi ONLUS, Milan, Italy, 4Center for Biomedical Imaging, Clinical and Translational Science Institute, University at Buffalo, The State University of New York, Buffalo, NY, United States
Synopsis
Keywords: Quantitative Imaging, Quantitative Susceptibility mapping
Quantitative susceptibility mapping (QSM) calculates the tissue magnetic susceptibility from gradient-echo phase images. Tissue magnetic susceptibility is of high clinical interest because it reflects tissue iron, myelin, and calcium. However, the clinical significance of these findings remains unclear. In particular, it is unknown if algorithms differ in their ability to detect group differences and longitudinal changes in susceptibility.The present work compared a large number of published algorithms with respect to their ability to detect aging-related changes over time.Introduction
Quantitative susceptibility mapping (QSM) calculates the tissue magnetic susceptibility from gradient-echo phase images.1,2 Tissue magnetic susceptibility is of high clinical interest because it reflects tissue iron,3 myelin,4 and calcium.5 Numerous clinical studies have shown that susceptibility is altered in neurodegenerative diseases and during normal aging.6–8 An integral step of QSM is the solution of an ill-posed dipole inversion problem for which numerous algorithms have been presented over the past decade. The QSM community has attempted to benchmark the algorithms in two challenges since 2016.9,10 Both challenges compared algorithms based on the fidelity of a single reconstructed susceptibility map relative to a gold standard susceptibility map.11 The two challenges have revealed that susceptibility maps can show substantial differences depending on the algorithm and parameters used.9,10 However, the clinical significance of these findings remains unclear. In particular, it is unknown if algorithms differ in their ability to detect group differences and longitudinal changes in susceptibility.The present work compared a large number of published algorithms with respect to their ability to detect aging-related changes over time.Methods
Participants: We enrolled 32 healthy subjects from the institutional database of controls that had participated in previous IRB-approved studies. We called subjects in the order of the first available scan and invited them to participate in a follow-up exam. Data acquisition: All participants underwent MRI at the same 3T scanner that was used for the first exam (GE Signa Excite HD 12.0; multi-channel head-neck coil) using the identical 3D GRE sequence (256x192x64 matrix, 256x192x128mm3, TE/TR=22ms/40ms, BW=13.9kHz, flip=12°). A scan-rescan experiment was performed for N=4 participants where subjects received the same sequence three times, interleaved with full repositioning.Analysis: We applied best-path unwrapping and LBV12 to the wrapped phase. We applied the following algorithms to the background corrected field maps (using the original code provided by the inventors): DEEPOLE,13 FANSI,14 HEIDI,15 iSWIM, LSQR, MATV, MEDI,16 SDI,17 STAR, WH-FANSI.18 We referenced all susceptibility maps to the whole brain and analyzed regional mean susceptibility values using a custom bi-modal T1-QSM atlas.19 We assessed scan-rescan reproducibility by the inter-subject mean of the regional subject-level standard deviation of the scan-rescan susceptibility maps. We quantified sensitivity toward longitudinal changes as the ratio of over-time change to scan-rescan reproducibility.
Results
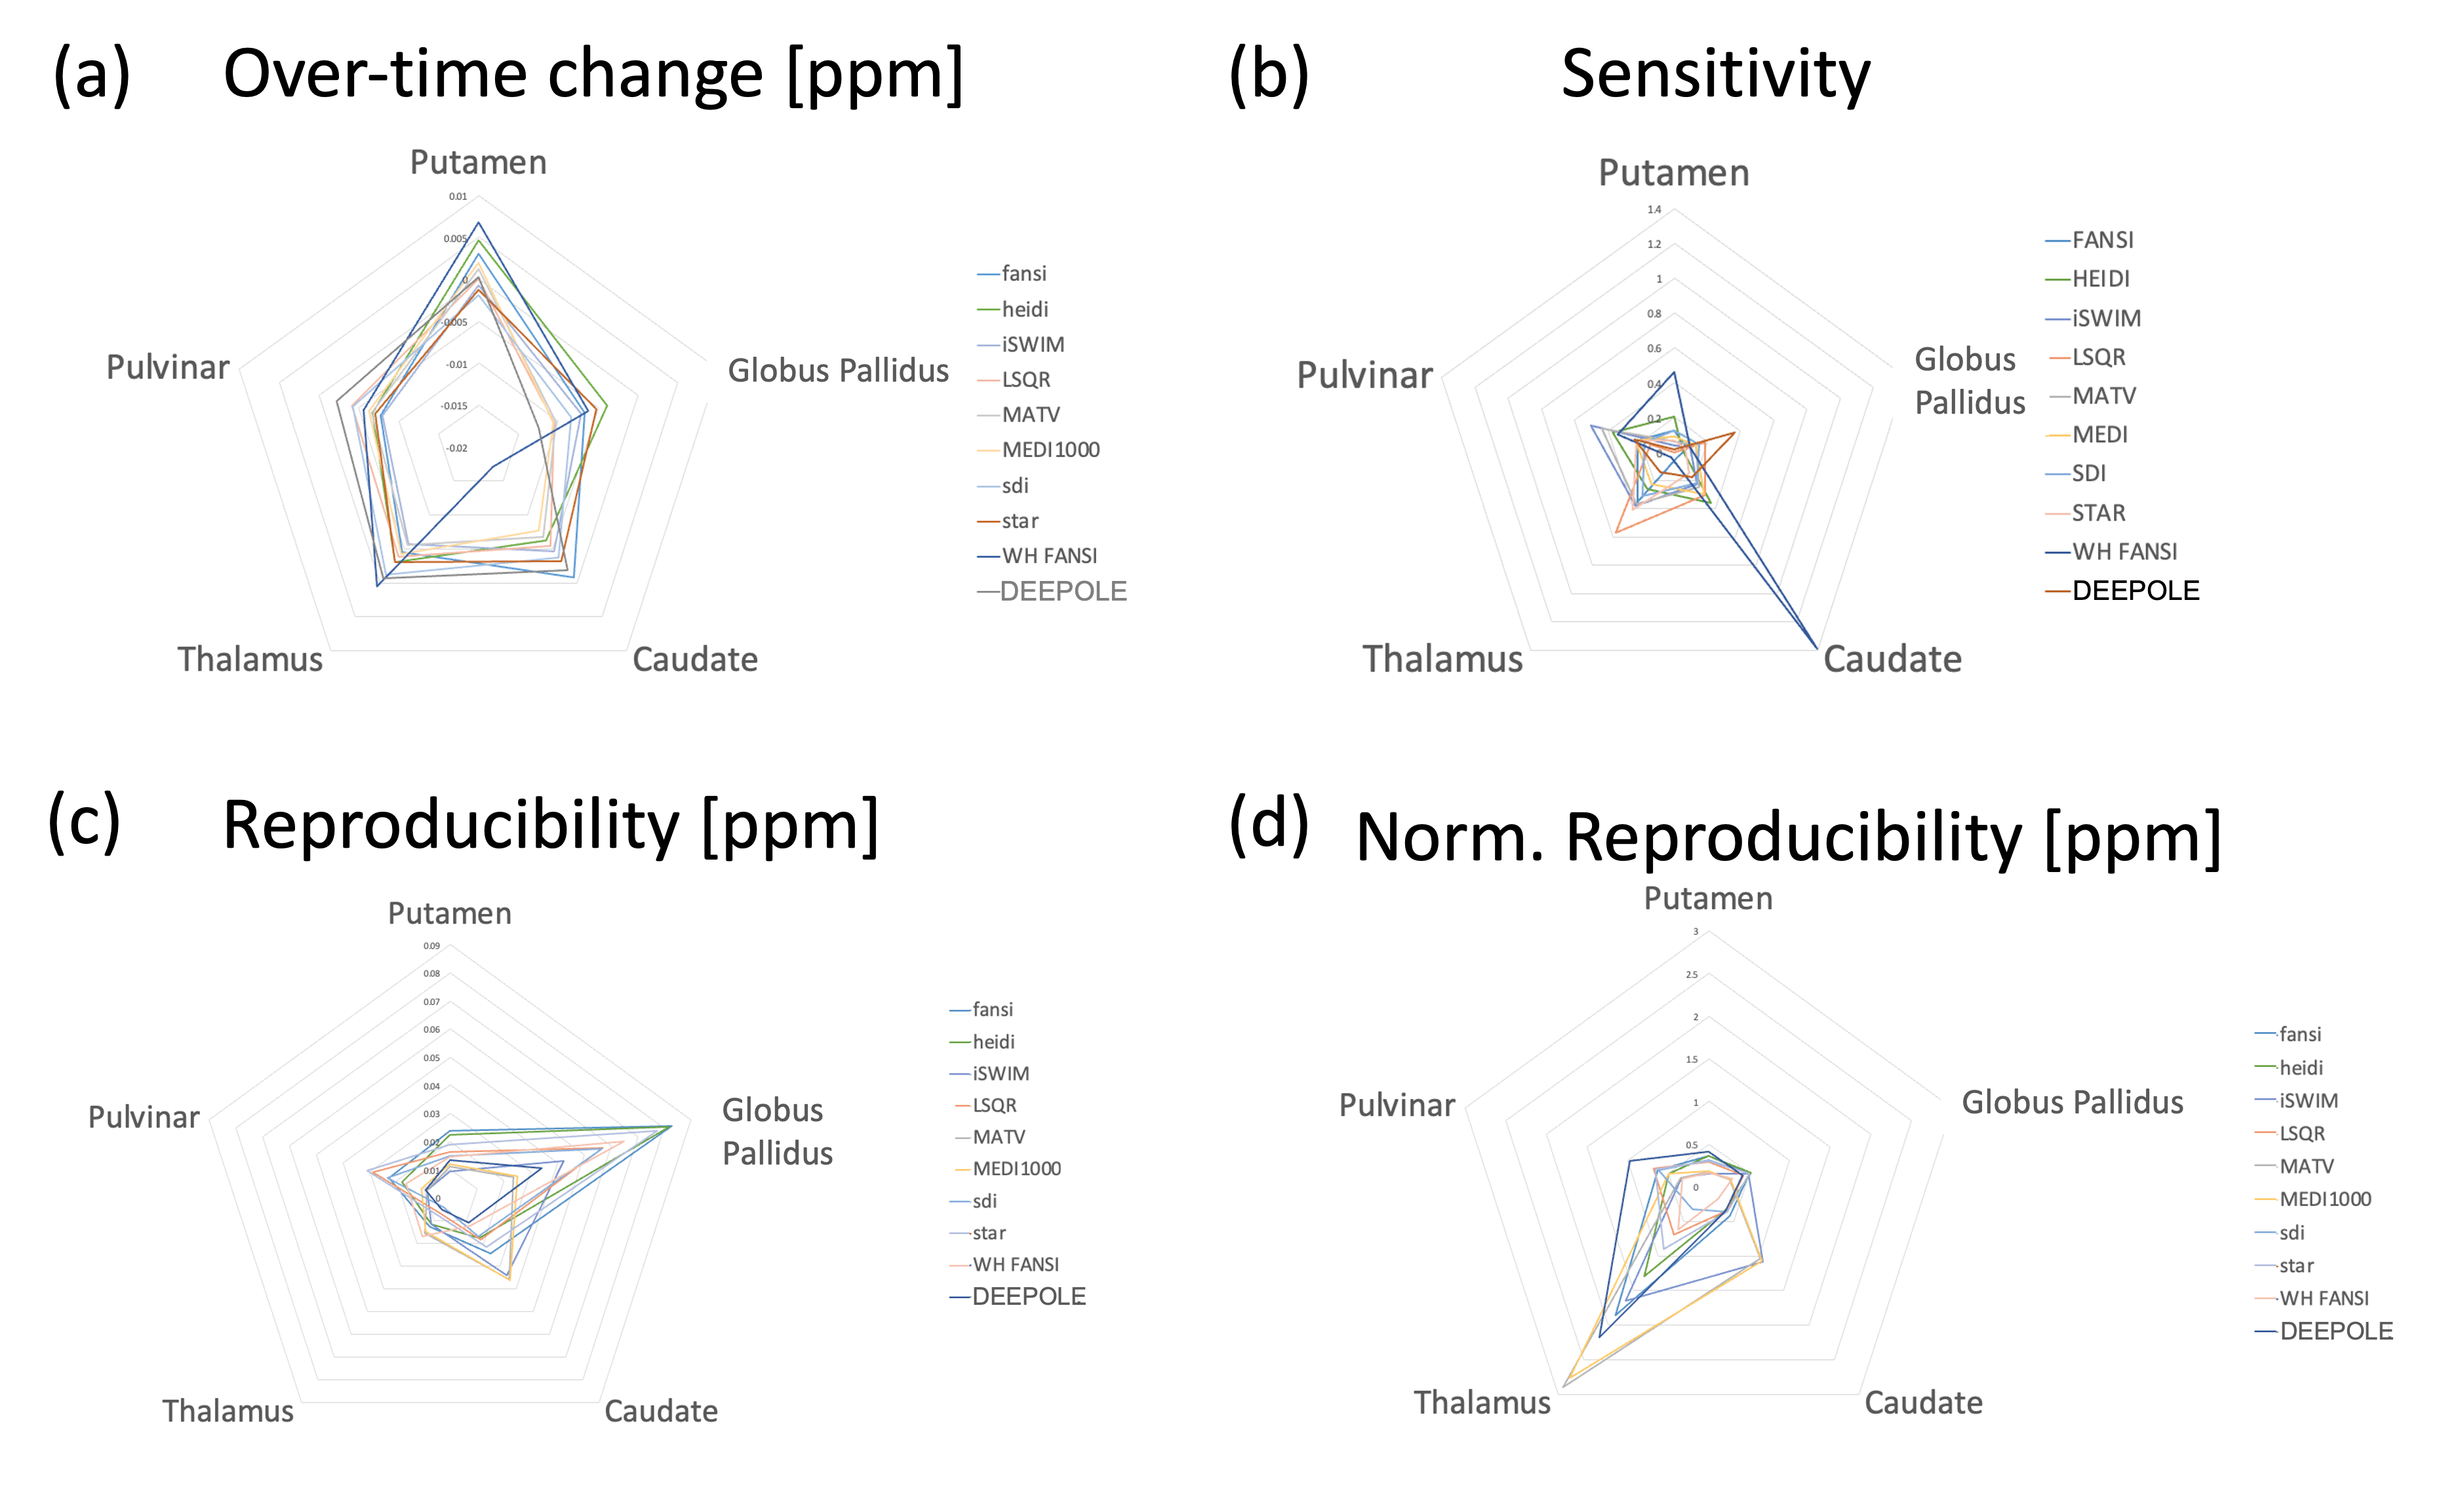
Participants: The average age of the subjects was 47±18 years at the time of baseline. The median time between baseline and follow-up scans was 11.09 years (8-13 years).Reproducibility: Reproducibility greatly varied between algorithms and regions (Fig. 1c). The lowest reproducibility was observed in the globus pallidus (GP; 0.02 to 0.08ppm), followed by caudate (CAU), and Pulvinar (PUL). Highest overall reproducibility was observed in Putamen (PUT; 0.011 to 0.024ppm) and Thalamus (THA; 0.004 to 0.017ppm). DEEPOLE scored among the top 4 algorithms of highest reproducibility in all regions, whereas iSWIM, MATV, and MEDI were among the top 4 in at least three regions. When normalizing the standard deviation by the average susceptibility in the region (Fig. 1d), only WH-FANSI scored among the top 4 in more than three regions, whereas MATV was the only top 4 algorithm in three regions.
Aging-related change over time: All algorithms detected declining magnetic susceptibility over the follow-up time in GP, CAU, THA, and PUL, except for WH-FANSI in THA (Fig. 1a). In the PUT, FANSI, HEIDI, LSQR, MATV, MEDI, WH-FANSI, and DEEPOLE detected increasing susceptibility, whereas iSWIM, SDI, and STAR detected decreasing susceptibility. Absolute change over time varied substantially between algorithms, particularly in the CAU with DEEPOLE detecting -1.9 ppb and WH-FANSI detecting -17 ppb.
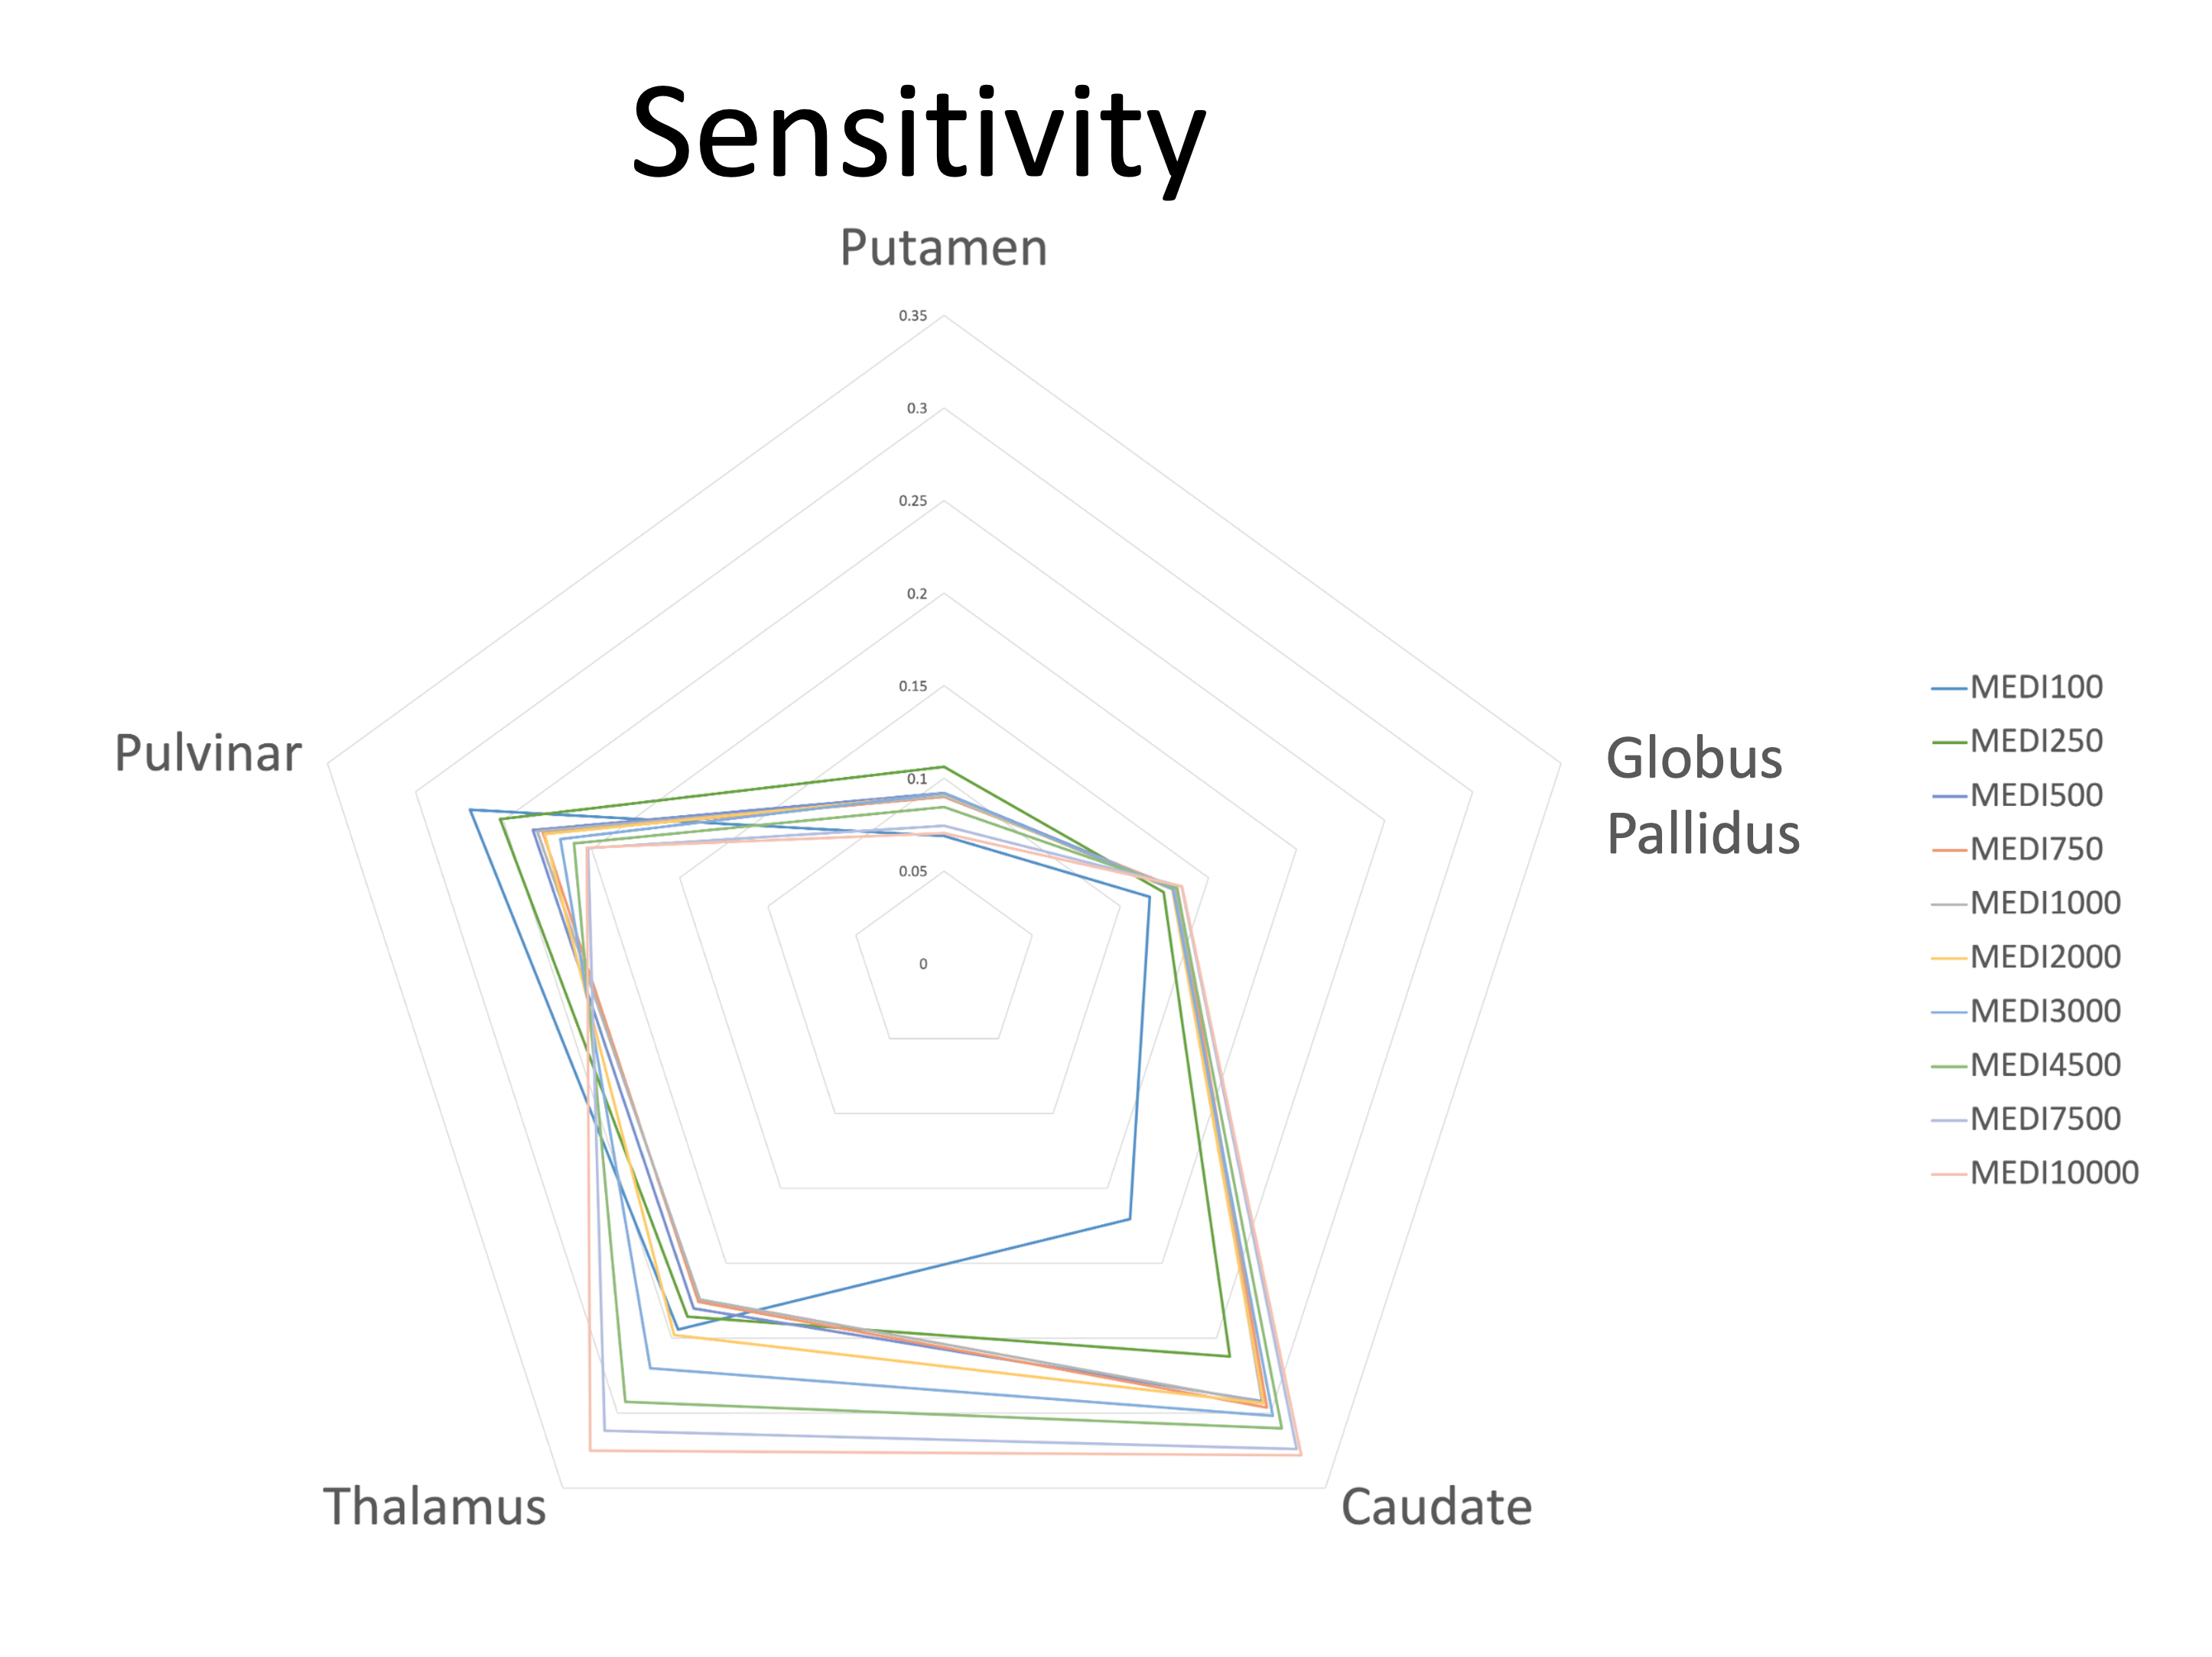
Sensitivity (Fig. 1b): WH-FANSI achieved the highest sensitivity in PUT (46%) and CAU (139%). DEEPOLE was most sensitive in GP (36%), LSQR in THA (57%), and iSWIM in PUL (50%). The lowest sensitivity was achieved by LSQR in PUT (0.1%), HEIDI in GP (5%), FANSI in CAU (3.1%), WH-FANSI in THA (3%), and SDI in PUL (18%). For MEDI, the choice of the regularization parameter affected sensitivity only to a moderate degree (Fig. 2).
Discussion and Conclusion
We presented the first comprehensive assessment of QSM dipole inversion algorithms in a cohort-based study setting. While overall trends in aging-related susceptibility changes were largely comparable between algorithms, our study revealed substantial differences in the amount of susceptibility change between algorithms and regions. Declining susceptibility over time with age, as detected by most of the algorithms, has only occasionally been reported in the literature and may be attributed to the advanced age of our cohort. Our results suggest that algorithms can be used to quantify tissue changes, but comparison between studies using different algorithms may be difficult. Large differences in sensitivity toward changes in regional susceptibility may explain observed variations in study outcomes in the literature. The cause of the observed differences between algorithms remains unclear and will have to be investigated by future studies. The high reproducibility of the DEEPOLE algorithm, suggests that variations between algorithms are related to nonsusceptibility frequency shifts.Acknowledgements
We are grateful to Dr. Carlos Milovic (Pontificia Universidad Católica de Valparaíso) for his advice on the implementation and parameter optimization of FANSI and WH-FANSI. Research reported in this publication was partially supported by the National Institute Of Neurological Disorders And Stroke of the National Institutes of Health under Award Number R01NS114227, and the National Center for Advancing Translational Sciences of the National Institutes of Health under Award Number UL1TR001412. The content is solely the responsibility of the authors and does not necessarily represent the official views of the funding agencies. Furthermore, the research was supported by the Free State of Thuringia within the ThiMEDOP project (2018 IZN 0004) with funds of the European Union (EFRE), the Free State of Thuringia within the thurAI project (2021 FGI 0008), the German Academic Exchange Service (DAAD PPP 57599925), and an ISMRM Research Exchange Grant awarded to T.J.References
1. Wang, Y. & Liu, T. Quantitative susceptibility mapping (QSM): Decoding MRI data for a tissue magnetic biomarker. Magn Reson Med 73, 82–101 (2015).
2. Schweser, F., Deistung, A. & Reichenbach, J. R. Foundations of MRI phase imaging and processing for Quantitative Susceptibility Mapping (QSM). Z Med Phys 26, 6–34 (2016).
3. Langkammer, C. et al. Quantitative susceptibility mapping (QSM) as a means to measure brain iron? A post mortem validation study. NeuroImage 62, 1593–1599 (2012).
4. Deh, K. et al. Magnetic susceptibility increases as diamagnetic molecules breakdown: Myelin digestion during multiple sclerosis lesion formation contributes to increase on QSM: Myelin Breakdown in MS Lesion Formation. J. Magn. Reson. Imaging 48, 1281–1287 (2018).
5. Schweser, F., Deistung, A., Lehr, B. W. & Reichenbach, J. R. Differentiation Between Diamagnetic and Paramagnetic Cerebral Lesions Based on Magnetic Susceptibility Mapping. Med Phys 37, 5165–5178 (2010).
6. Eskreis-Winkler, S. et al. The clinical utility of QSM: disease diagnosis, medical management, and surgical planning. NMR Biomed. 30, e3668 (2017).
7. Wang, Y. et al. Clinical quantitative susceptibility mapping (QSM): Biometal imaging and its emerging roles in patient care. J. Magn. Reson. Imaging 46, 951–971 (2017).
8. Ravanfar, P. et al. Systematic Review: Quantitative Susceptibility Mapping (QSM) of Brain Iron Profile in Neurodegenerative Diseases. Front. Neurosci. 15, 618435 (2021).
9. Langkammer, C. et al. Quantitative susceptibility mapping: Report from the 2016 reconstruction challenge. Magn. Reson. Med. 79, 1661–1673 (2018).
10. QSM Challenge 2.0 Organization Committee et al. QSM reconstruction challenge 2.0: Design and report of results. Magn. Reson. Med. 86, 1241–1255 (2021).
11. Marques, J. P. et al. QSM reconstruction challenge 2.0: A realistic in silico head phantom for MRI data simulation and evaluation of susceptibility mapping procedures. Magn. Reson. Med. 86, 526–542 (2021).
12. Zhou, D., Liu, T., Spincemaille, P. & Wang, Y. Background field removal by solving the Laplacian boundary value problem. NMR Biomed 27, 312–319 (2014).
13. Jochmann, T. et al. Quantitative mapping of susceptibility and non-susceptibility frequency with DEEPOLE QUASAR. in Proc Intl Soc Mag Reson Med 29 (2021)p3468 (2021).
14. Milovic, C., Bilgic, B., Zhao, B., Acosta-Cabronero, J. & Tejos, C. Fast nonlinear susceptibility inversion with variational regularization. Magn. Reson. Med. 80, 814–821 (2018).15. Schweser, F., Sommer, K., Deistung, A. & Reichenbach, J. R. Quantitative susceptibility mapping for investigating subtle susceptibility variations in the human brain. NeuroImage 62, 2083–2100 (2012).
16. Liu, J. et al. Morphology enabled dipole inversion for quantitative susceptibility mapping using structural consistency between the magnitude image and the susceptibility map. NeuroImage 59, 2560–8 (2012).
17. Schweser, F., Deistung, A., Sommer, K. & Reichenbach, J. R. Toward online reconstruction of quantitative susceptibility maps: Superfast dipole inversion. Magn Reson Med 69, 1581–93 (2013).
18. Milovic, C. et al. Weak‐harmonic regularization for quantitative susceptibility mapping. Magn. Reson. Med. 81, 1399–1411 (2019).
19. Hanspach, J. et al. Methods for the computation of templates from quantitative magnetic susceptibility maps (QSM): Toward improved atlas- and voxel-based analyses (VBA). J. Magn. Reson. Imaging JMRI 46, 1474–1484 (2017).
Figures