0279
Effects of hypertension and type 2 diabetes on cerebrovascular reactivity in older adults1Rotman Research Institute, Baycrest Health Sciences, Toronto, ON, Canada, 2Departments of Psychology and Psychiatry, University of Toronto, Toronto, ON, Canada, 3Department of Medical Biophysics, University of Toronto, Toronto, ON, Canada, 4Department of Biomedical Engineering, University of Toronto, Toronto, ON, Canada
Synopsis
Keywords: Quantitative Imaging, Diabetes, Cerebrovascular reactivity, CVR
Differences in CVR amplitude and time delay were assessed among patients with hypertension (HT), hypertension-plus-type-2 diabetes (HT+DM), and age-matched controls (CTL) using a pipeline for adaptive capturing of the BH response directly from BOLD data, ensuring greater robustness. The lowest CVR amplitude and the longest delay were found in the HT+DM group. CTL had the highest CVR amplitude, and the HT group had the shortest time delays. CVR delay was more sensitive to group differences than amplitude.
Introduction
Cerebrovascular reactivity (CVR) changes have been reported in various chronic conditions.1–6 Chronic hypertension7 and diabetes mellitus8 have been associated with changes in CVR1,5,6,9,10, and are commonly comorbid, but the study of CVR in these populations is still scarce. The breath-hold (BH) task has been commonly used to estimate CVR by measuring the BOLD response.11 However, CVR estimation is not always reliable due to the inability of patients to follow the BH paradigm.12 This study uses a recently proposed data-driven pipeline for BH CVR estimation to assess differences in CVR amplitude and time delay among patients with hypertension (HT), hypertension-plus-type-2 diabetes (HT+DM), and age-matched controls (CTL) using our pipeline for adaptive capturing of the BH response directly from BOLD data13, ensuring greater robustness.Methods
The study consisted of 18 CTL, 20 HT, and 11 HT+DM subjects with mean ages of 71.42, 72.22 and 70.22 years, and male/female ratios of 1.25, 0.43 and 0.57, respectively. Each subject followed a 15 s breath-hold (BH) followed by a 30 s resting and 2 s exhale guided by visual clues (period = 47 s), repeated 6 times during an fMRI image acquisition with T2*-weighted EPI (voxel size = 3.4x3.4x6.0 mm, TE1/TE2/TR = 9.1/25/4000 ms). Respiratory bellows were recorded using the scanner’s built-in belt. A T1-anatomical scan was also acquired and used to generate brain parcellations by nonlinear spatial registration to the default GCA atlas in FreeSurfer. The BH response was modelled as a sinusoid whose fundamental frequency was determined from the BOLD data informed by task design but independent of external recordings. A detailed description of the fMRI data processing algorithm is presented in a separate abstract.13 The BOLD signal properties at this data-driven frequency were used to determine the CVR amplitude and time delay. The CVR time delay was expressed in reference to the respiratory belt signal, but could equally be referenced to other meaningful BOLD-based time courses. The permutation inference for the GLM14 was used for a voxelwise comparison of CVR amplitude and time delay with multiple comparisons correction via threshold-free cluster enhancement.15 Two-way ANOVA with multiple comparisons was used to compare region-wise (ROI) CVR data, corrected for multiple comparisons by controlling the false discovery rate (Benjamini-Hochberg procedure).Results
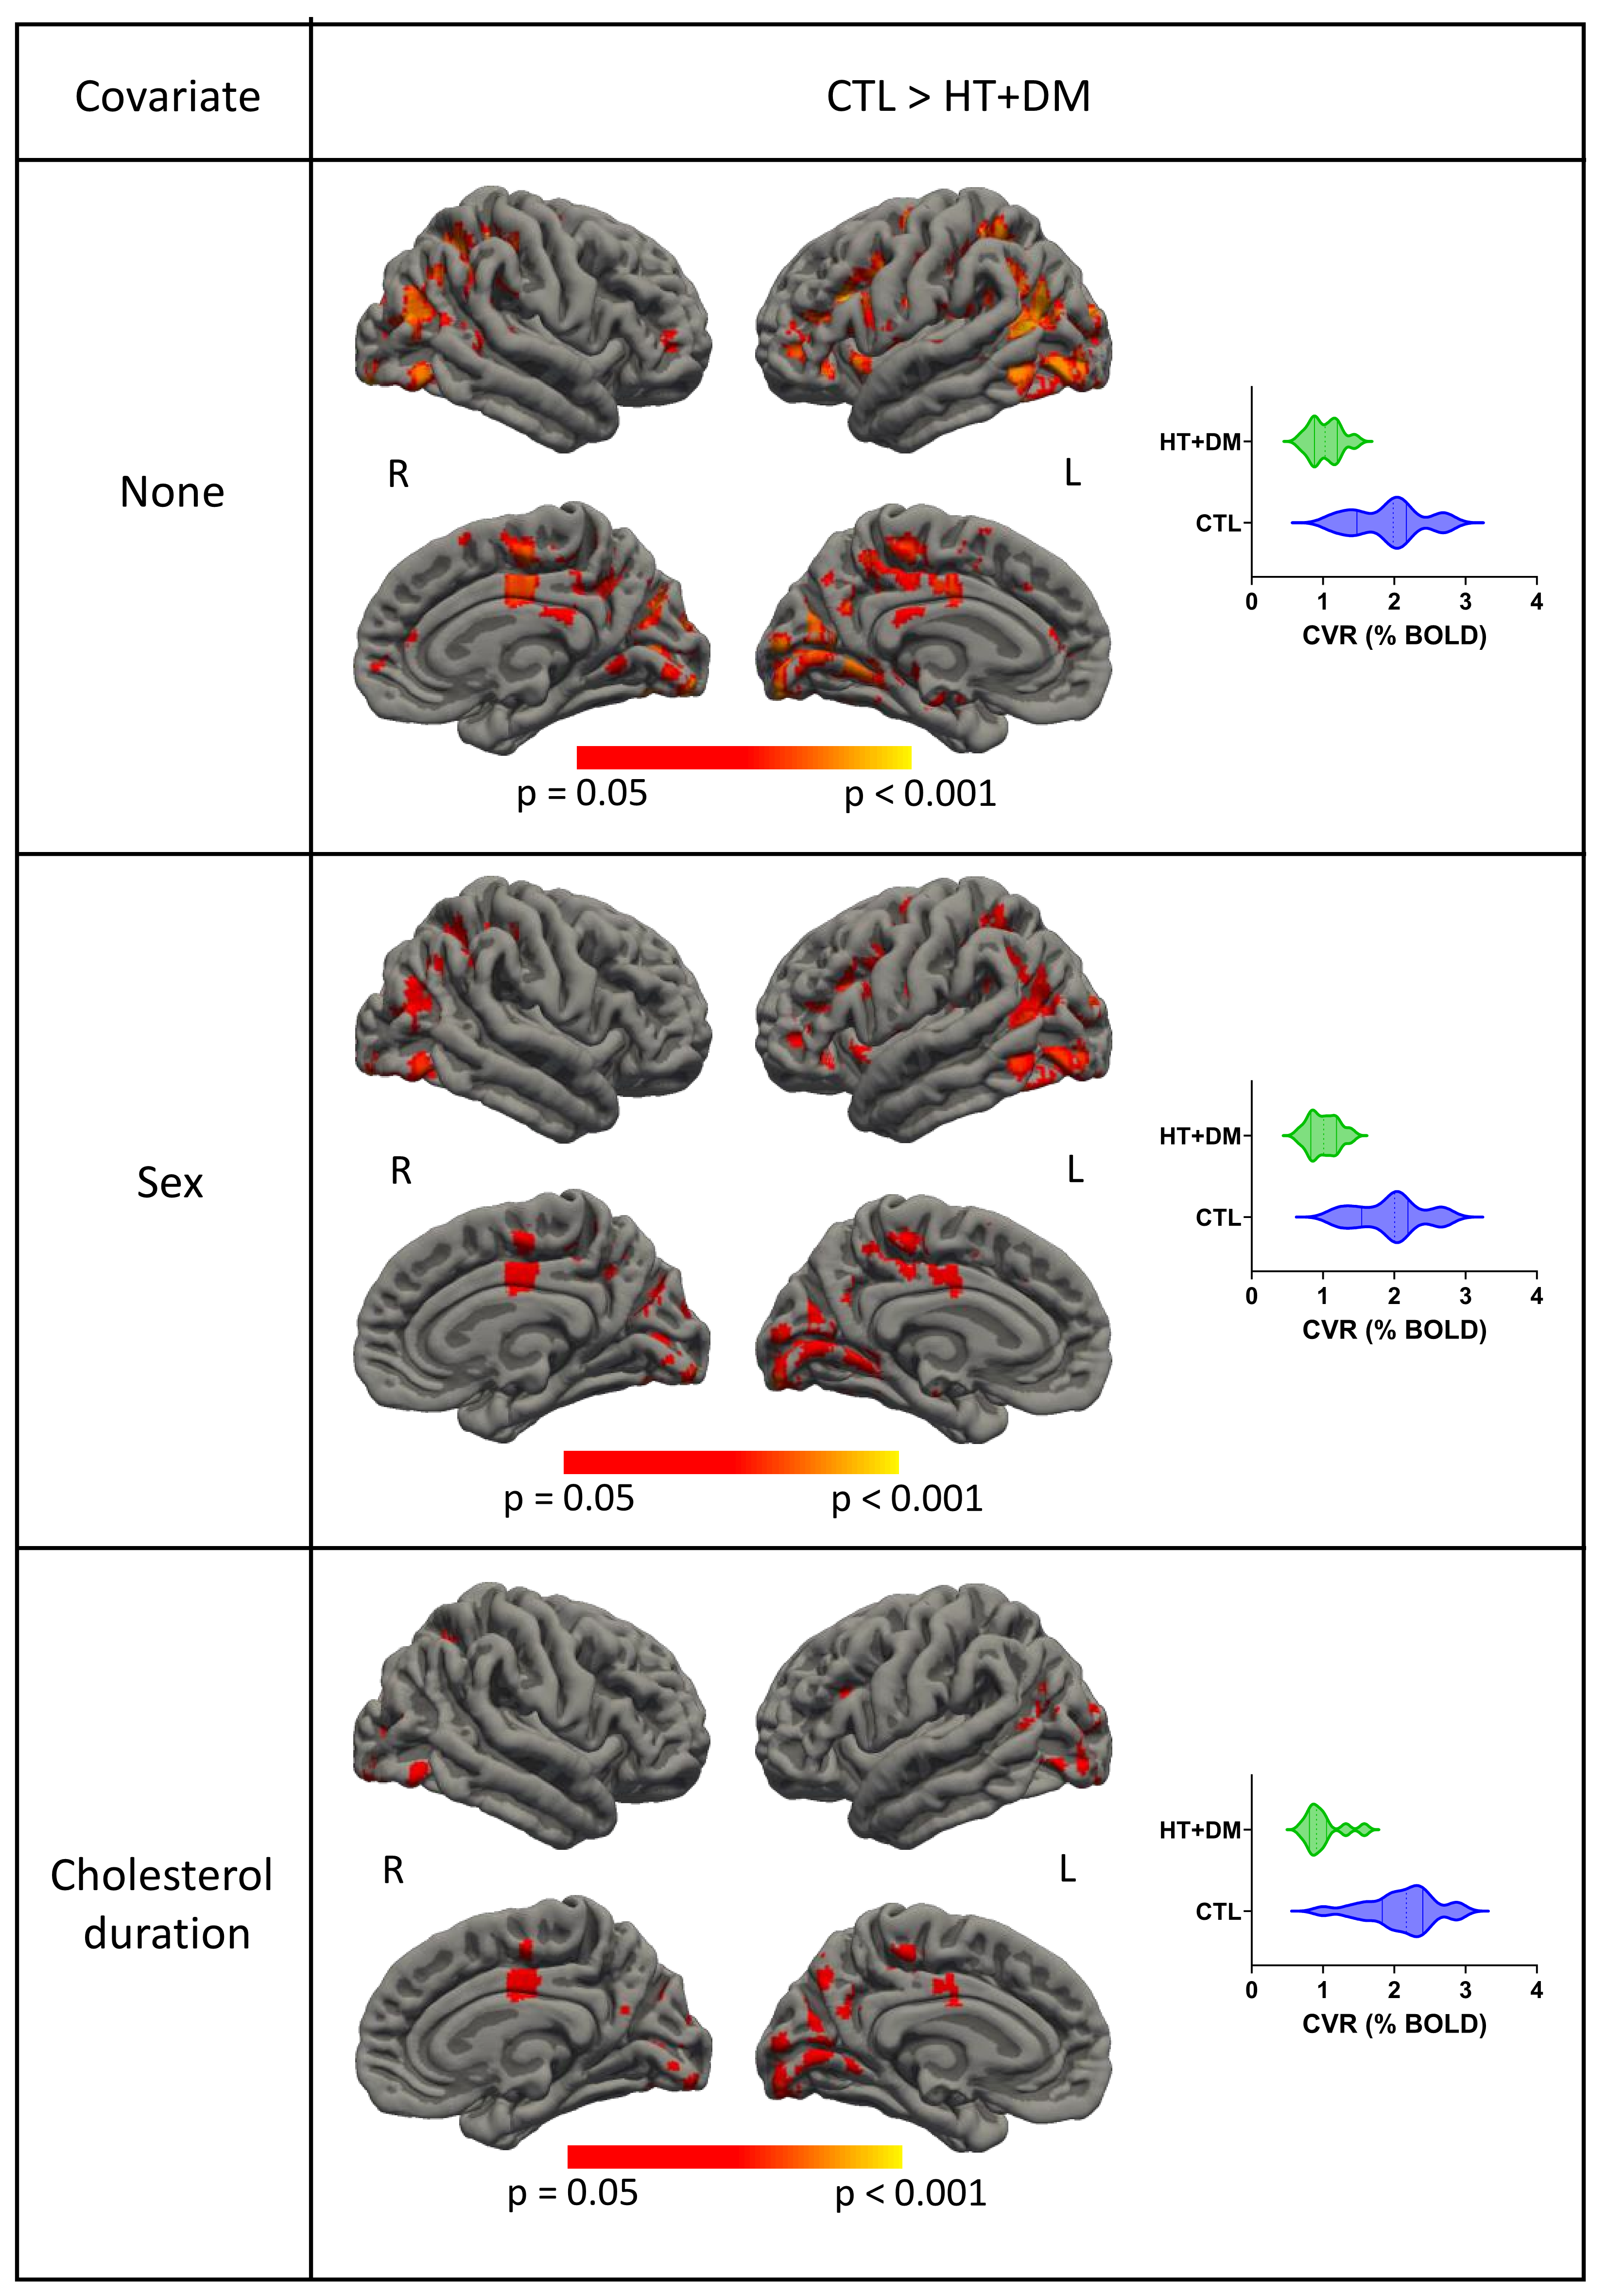
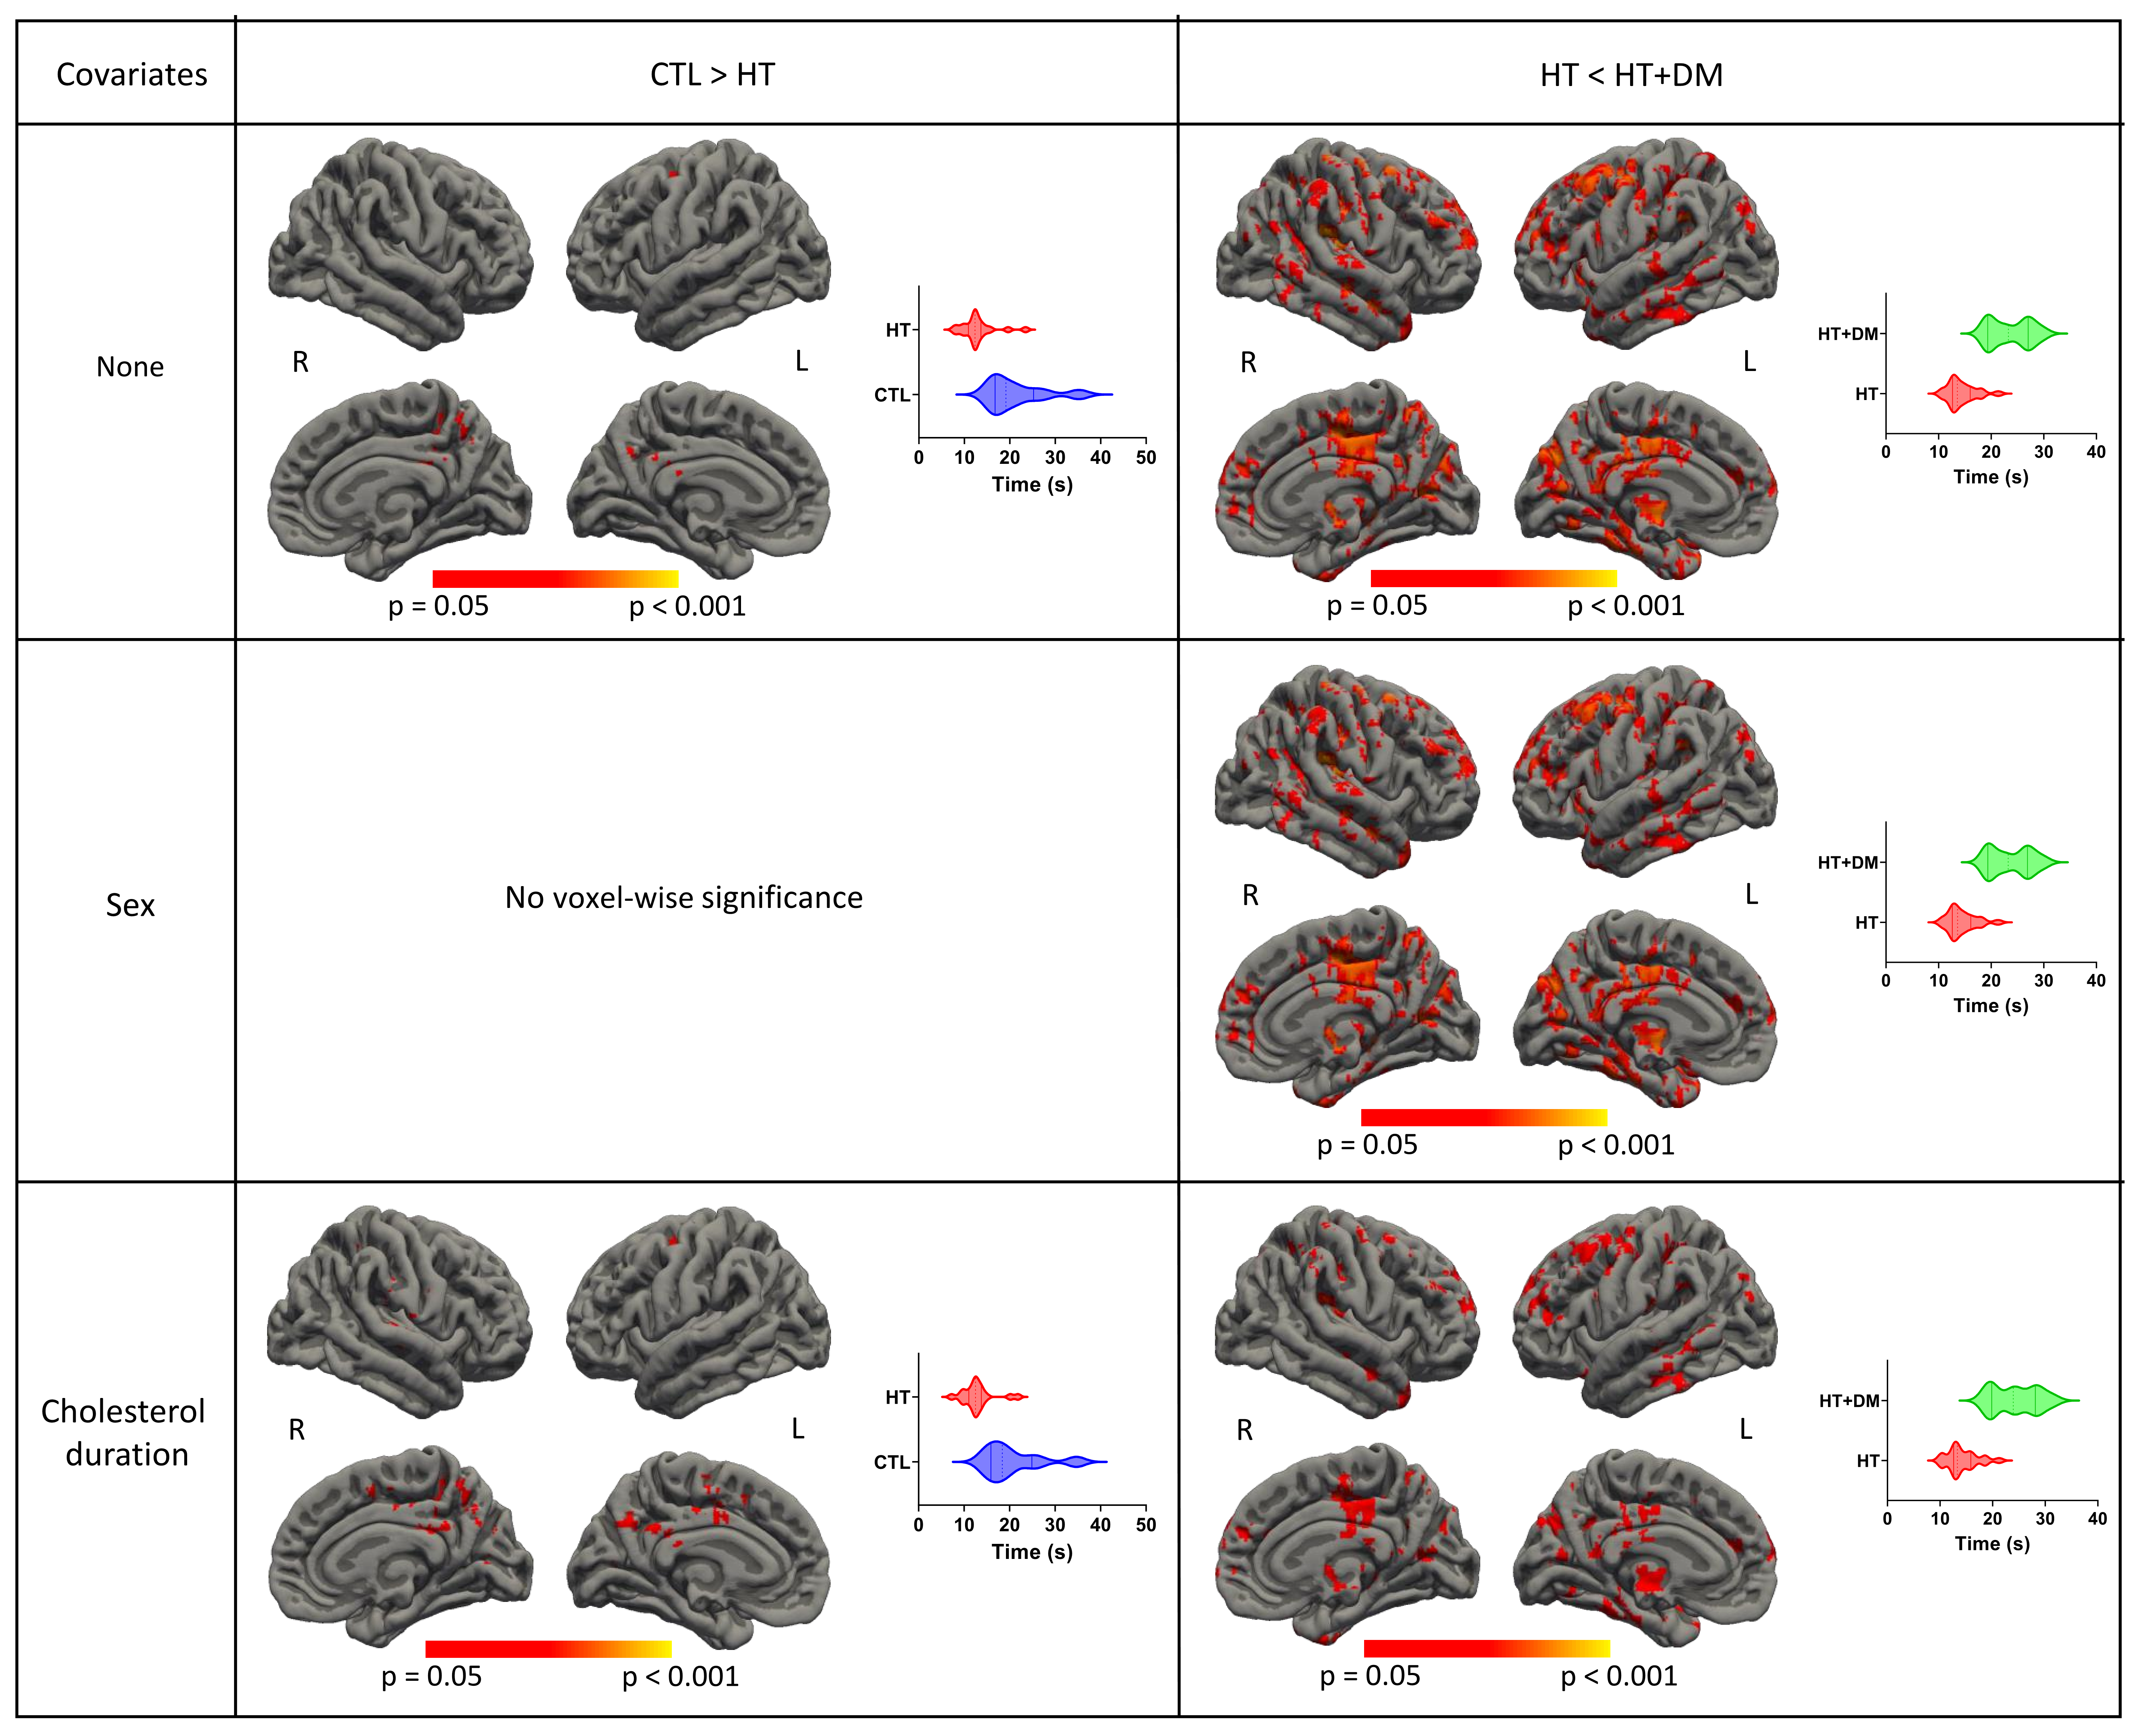
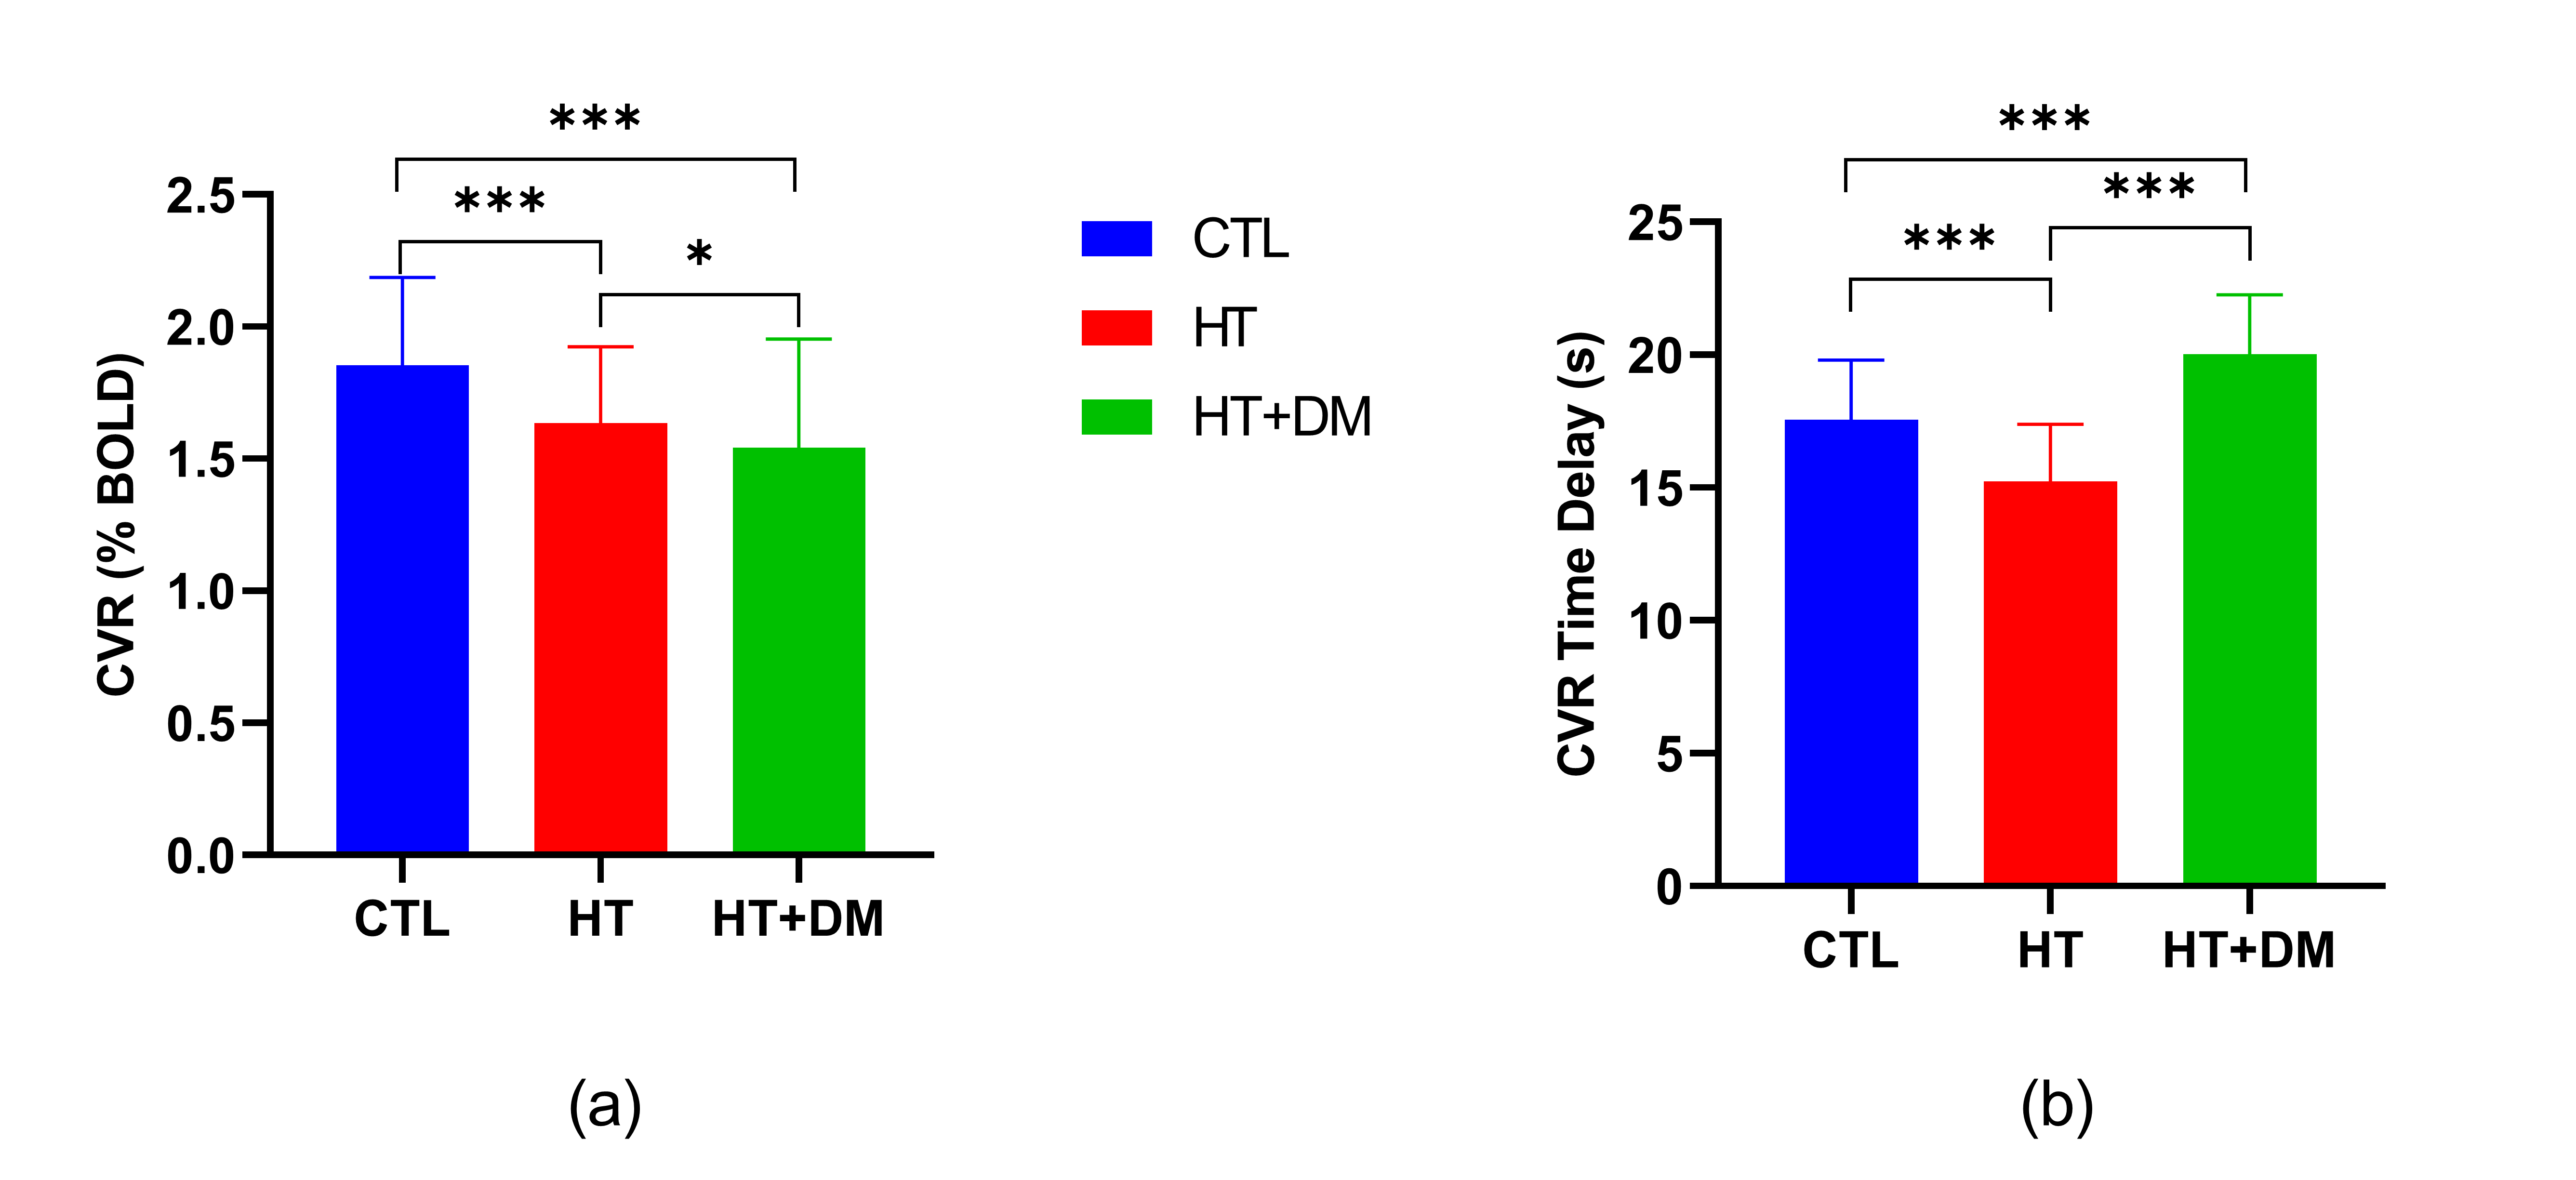
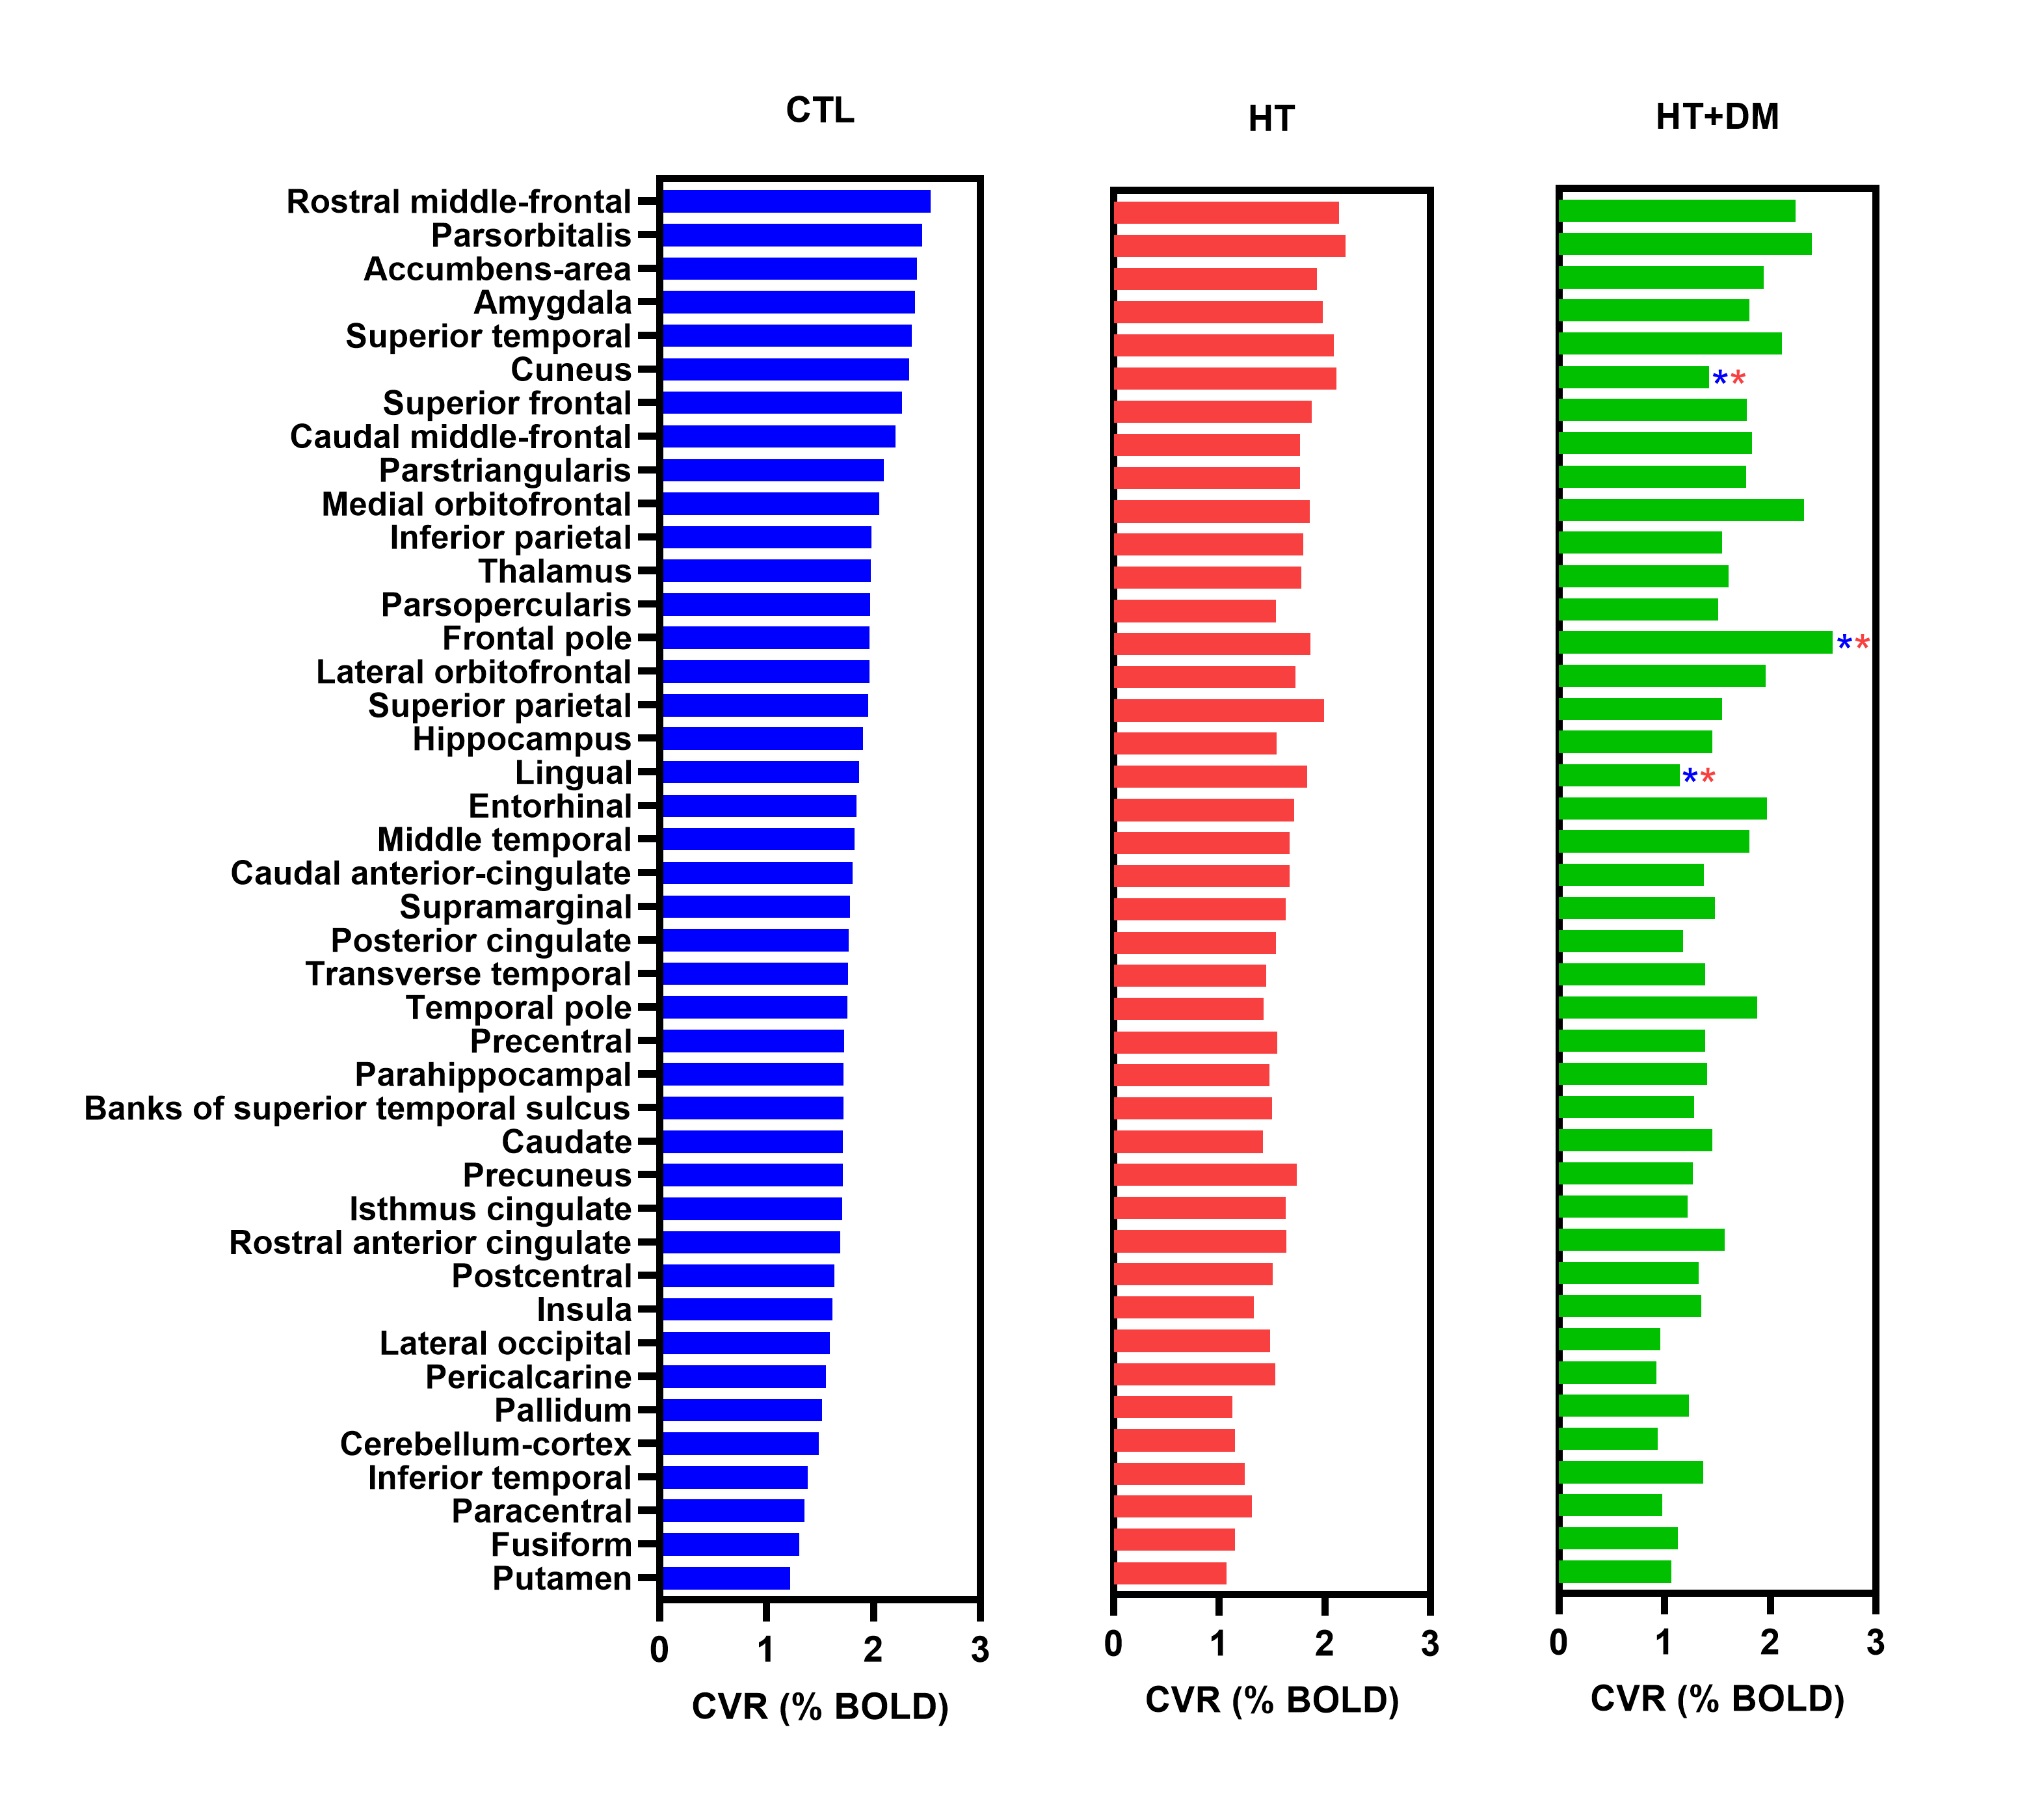
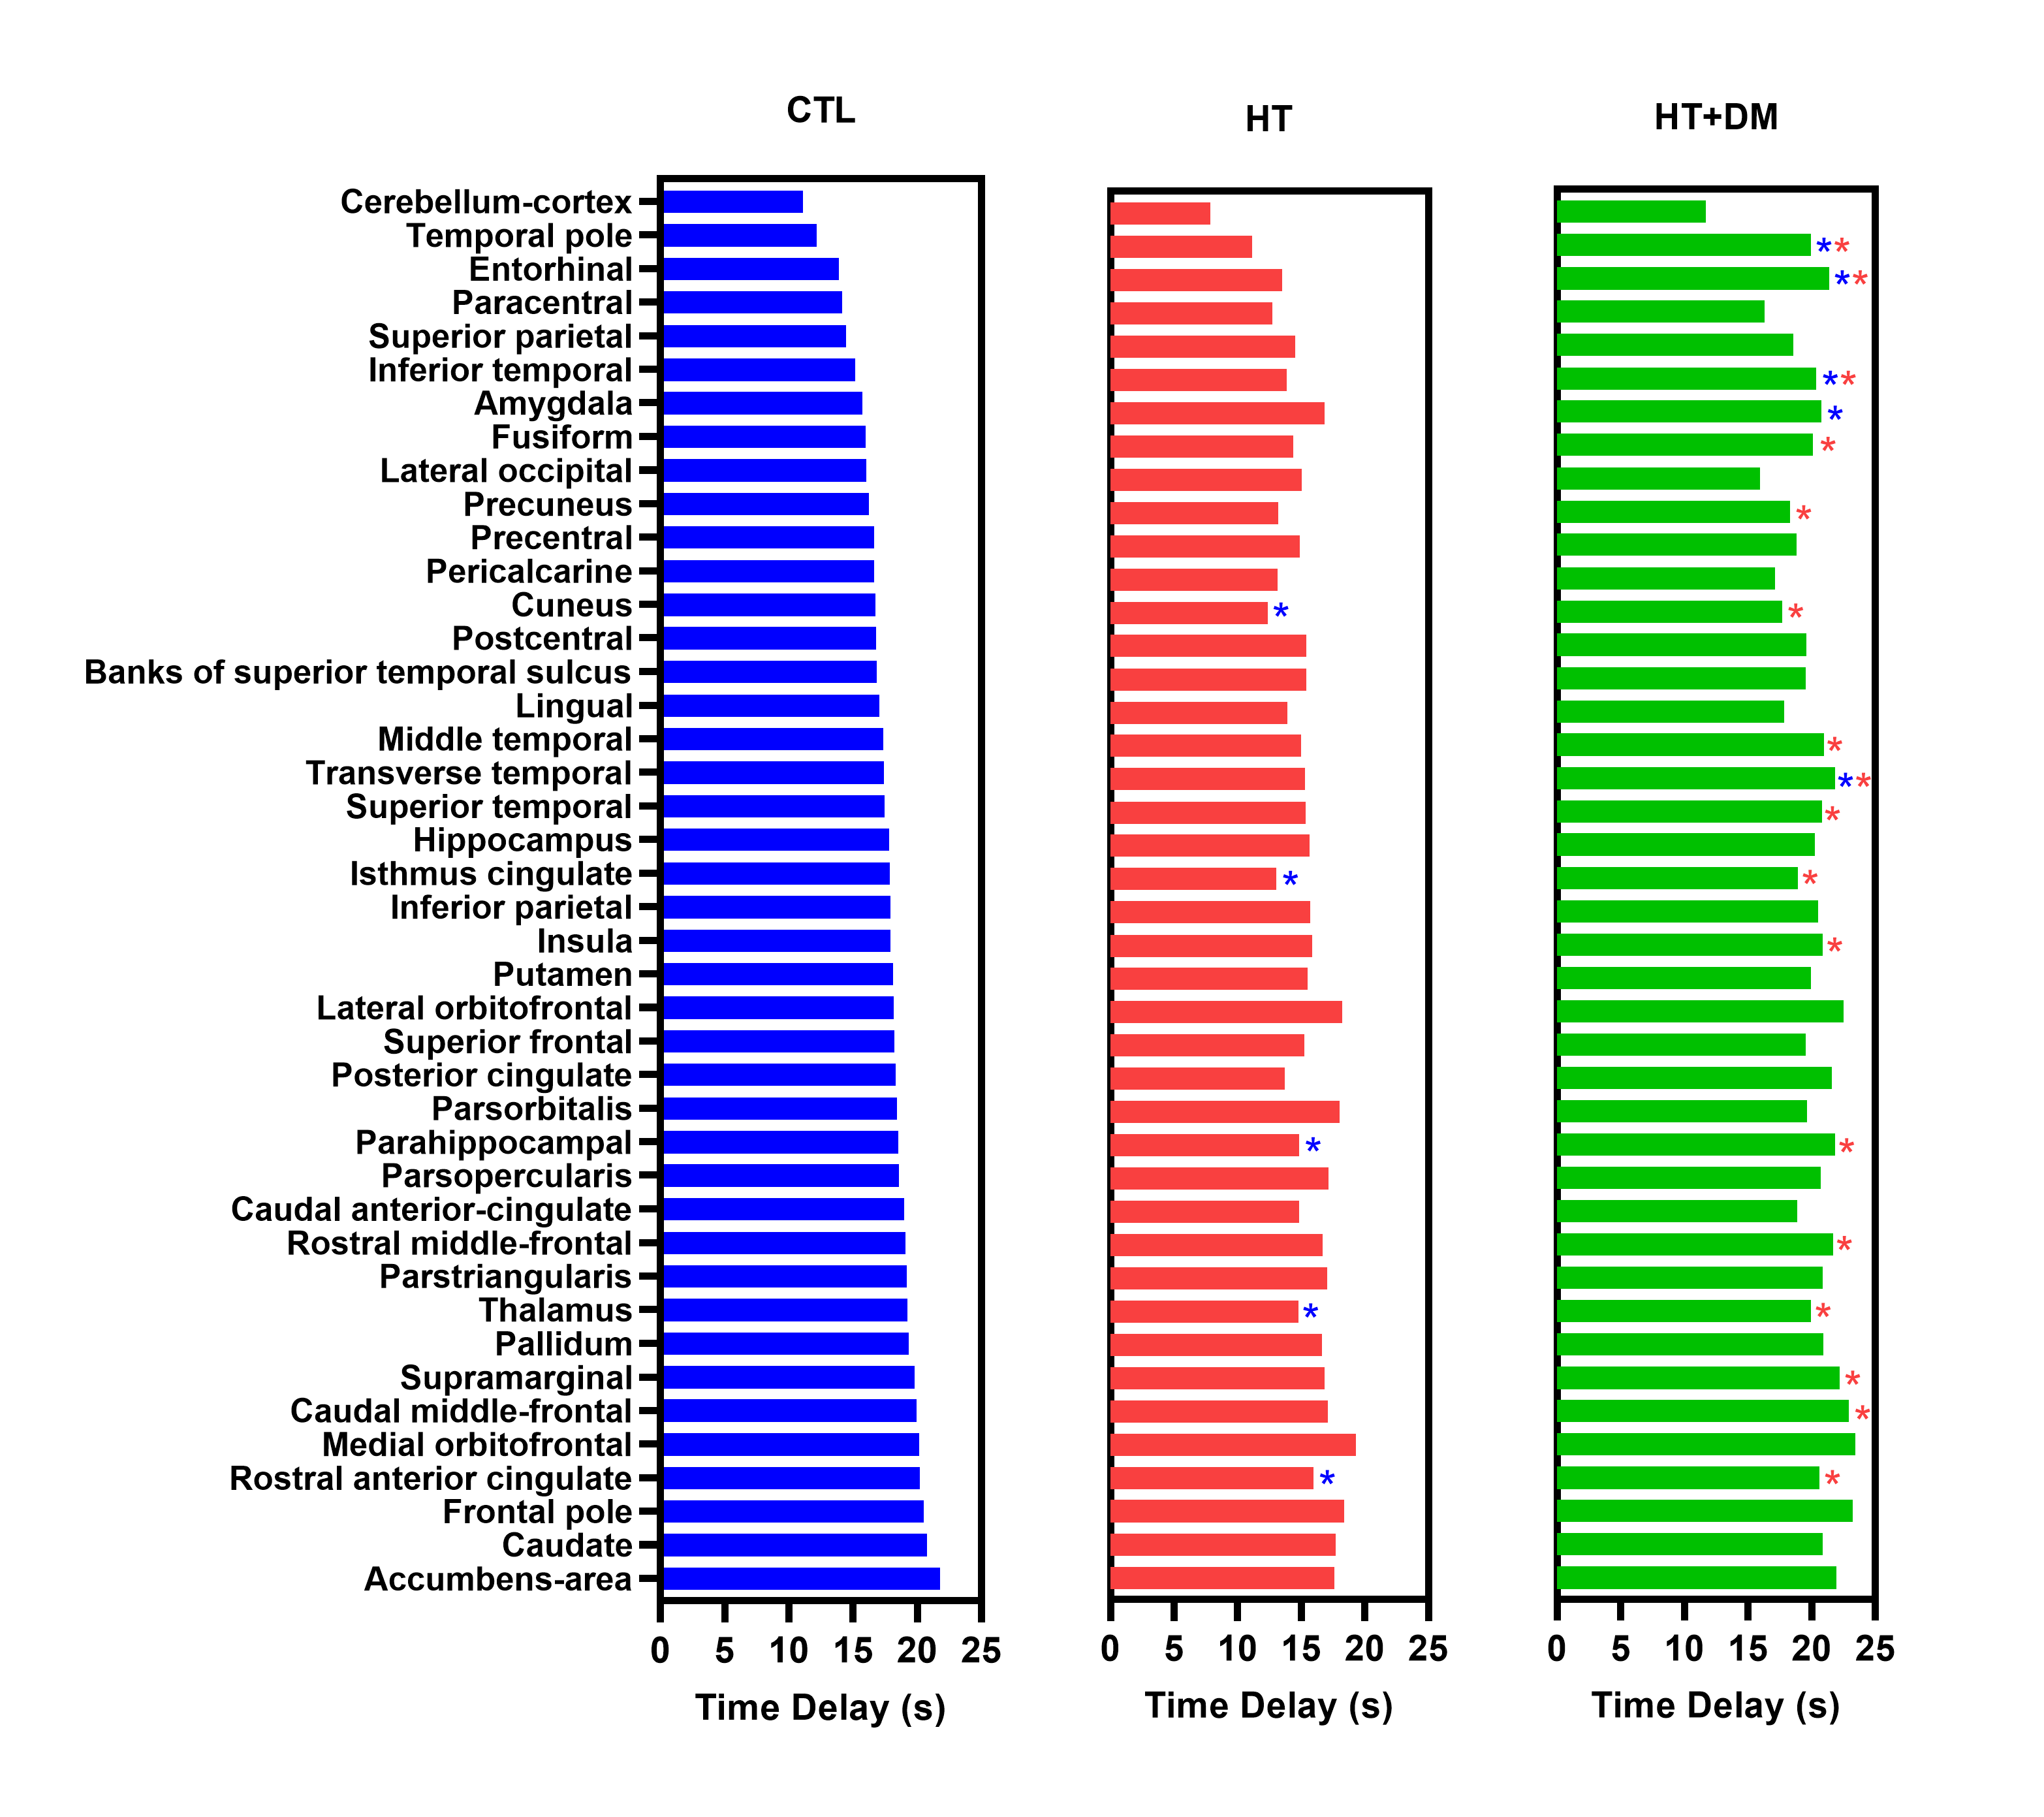
Figure 1 shows voxels that demonstrate statistically significant CVR amplitude differences (p < 0.05) where CVRCTL > CVRHT+DM. No significant voxelwise differences in CVR amplitudes were detected between CTL and HT or between HT and HT+DM. However, the CVR time delay for CTL was significantly longer than for HT, and was significantly shorter for HT than for HT+DM, as shown in Figure 2. Most CVR amplitude and time delay differences were reduced when controlling for sex and for the duration of hypercholesterolemia. No significant differences in CVR time delay was detected between CTL and HT+DM. Across cortical ROIs, the mean CVRCTL amplitude was significantly higher (q < 0.0001) than both CVRHT and CVRHT+DM by 0.2196 and 0.3108 %BOLD, respectively (Figure 3). CVRHT was significantly higher (0.0912 %BOLD) than CVRHT+DM (q < 0.05). HT also had a significantly shorter time delay than CTL and HT+DM (q < 0.0001). In turn, CTL had a significantly shorter time delay than HT+DM. Figures 4 and 5 show the regional means of CVR amplitude and time delay, respectively, for each cortical ROI. CVRHT+DM is significantly lower than both CVRCTL and CVRHT in the cuneus and the lingual gyrus, and significantly higher in the frontal pole. The CVR time delay was significantly longer in HT+DM than in both CTL and HT in the temporal pole, entorhinal, inferior temporal, and transverse temporal ROIs. HT+DM also showed a significantly longer CVR time delay in the amygdala compared to CTL, and in many regions compared to the HT. HT exhibited significantly shorter delays than CTL in the cuneus, the isthmus cingulate, the parahippocampal, the thalamus, and the rostral anterior cingulate.Discussion and Conclusions
This study used a data-driven pipeline that includes adaptive capturing of the BH response directly from BOLD data, ensuring greater robustness to address the issues of subject compliance associated with BH tasks.12 The CVR amplitude was lowest in HT+DM, as expected based on similar studies.16 HT had a lower CVR than CTL regionally, also as expected,6,17 but the voxelwise comparison did not yield statistical significance. Interestingly, the CVR time delay was far more sensitive than CVR amplitude to differences across the groups. While HT+DM seems to confer longer CVR delays, HT seems to confer shorter delays than CTL. These are the first MRI-based observations of CVR time delay differences between hypertensive-diabetes patients and healthy controls, demonstrating the feasibility of extracting CVR time delay using BH challenges, as well as the unique clinical value of CVR time delay information. The interpretation of the BOLD dynamic CVR response is complex, and the full interpretation of the observed CVR delays remains to be clarified in future research.Acknowledgements
This work was funded by grants from the Canadian Institutes for Health Research (MOP 111244 and FDN 148398).References
1. Ivankovic, M. et al. Influence of hypertension and type 2 diabetes mellitus on cerebrovascular reactivity in diabetics with retinopathy. Ann. Saudi Med. 33, 130–133 (2013).
2. Geranmayeh, F., Wise, R. J. S., Leech, R. & Murphy, K. Measuring vascular reactivity with breath-holds after stroke: a method to aid interpretation of group-level BOLD signal changes in longitudinal fMRI studies. Hum. Brain Mapp. 36, 1755–1771 (2015).
3. Iranmahboob, A. et al. Vascular Reactivity Maps in Patients with Gliomas Using Breath-Holding BOLD fMRI. J. Neuroimaging 26, 232–239 (2016).
4. Atwi, S. et al. BOLD-based cerebrovascular reactivity vascular transfer function isolates amplitude and timing responses to better characterize cerebral small vessel disease. NMR Biomed. 32, e4064 (2019).
5. Yazdani, N., Kindy, M. S. & Taheri, S. CBF regulation in hypertension and Alzheimer’s disease. Clin. Exp. Hypertens. 42, 622–639 (2020).
6. Li, Y. et al. MRI study of cerebral blood flow, vascular reactivity, and vascular coupling in systemic hypertension. Brain Res. 1753, 147224 (2021).
7. Harvey, A., Montezano, A. C. & Touyz, R. M. Vascular biology of ageing-Implications in hypertension. J. Mol. Cell. Cardiol. 83, 112–121 (2015).
8. Feener, E. P. & King, G. L. Vascular dysfunction in diabetes mellitus. Lancet 350 Suppl 1, SI9–13 (1997).
9. Petrica, L. et al. Cerebrovascular reactivity is impaired in patients with non-insulin-dependent diabetes mellitus and microangiopathy. Wien. Klin. Wochenschr. 119, 365–371 (2007).
10. Kadoi, Y. et al. Diabetic patients have an impaired cerebral vasodilatory response to hypercapnia under propofol anesthesia. Stroke 34, 2399–2403 (2003).
11. Bright, M. G. & Murphy, K. Reliable quantification of BOLD fMRI cerebrovascular reactivity despite poor breath-hold performance. Neuroimage 83, 559–568 (2013).
12. Jahanian, H. et al. Measuring vascular reactivity with resting-state blood oxygenation level-dependent (BOLD) signal fluctuations: A potential alternative to the breath-holding challenge? J. Cereb. Blood Flow Metab. 37, 2526–2538 (2017).
13. Nanayakkara, N.D., Meusel, L., Anderson, N., Chen, J.J. A robust method for estimating CVR dynamics from breath-hold BOLD data without end-tidal carbon dioxide recordings. ISMRM 2023 (Submitted).
14. Winkler, A. M., Ridgway, G. R., Webster, M. A., Smith, S. M. & Nichols, T. E. Permutation inference for the general linear model. Neuroimage 92, 381–397 (2014).
15. Smith, S. M. & Nichols, T. E. Threshold-free cluster enhancement: addressing problems of smoothing, threshold dependence and localisation in cluster inference. Neuroimage 44, 83–98 (2009).
16. Tchistiakova, E., Anderson, N. D., Greenwood, C. E. & MacIntosh, B. J. Combined effects of type 2 diabetes and hypertension associated with cortical thinning and impaired cerebrovascular reactivity relative to hypertension alone in older adults. Neuroimage Clin 5, 36–41 (2014).
17. Lee, B.-C. et al. Arterial Spin Labeling Imaging Assessment of Cerebrovascular Reactivity in Hypertensive Small Vessel Disease. Front. Neurol. 12, 640069 (2021).
Figures