0278
Dependency of Proton MR Spectroscopy Neuro-Metabolite Concentrations on Grey Matter Fraction and Location in the Healthy Human Brain1Division of Informatics, Imaging and Data Sciences, School of Health Sciences, Faculty of Biology, Medicine and Health, The University of Manchester, Manchester, United Kingdom, 2Division of Psychology, Communication and Human Neuroscience, School of Health Sciences, Faculty of Biology, Medicine and Health, The University of Manchester, Manchester, United Kingdom
Synopsis
Keywords: Quantitative Imaging, Spectroscopy, Brain
Variations in six neuro-metabolite (N-acetylaspartate, creatine, myo-inositol, glutamate, glutamine and glycerophosphorylcholine) signals from MR spectroscopy (MRS) data across eleven brain regions were tested for regional differences and for dependence on the spectroscopic volume tissue composition (fractional grey matter (GM)), using a linear mixed-effect model. We found significant positive correlations of N-acetylaspartate, creatine and glutamate concentrations with fractional GM across all eleven regions and a significant regional effect for all six metabolites. This provides clear evidence that brain metabolite measurements are dependent on both the region and fractional GM, demonstrating the importance of knowing tissue fractions when interpreting MRS measurements.Introduction
The large voxel sizes typically used in MR spectroscopy (MRS) inhibit the sampling of pure grey matter (GM) and white matter (WM) regions. Most studies do not correct for GM and WM volume fraction effects and interpretation of difference in metabolite concentrations can be confounded by differences in tissue composition. Linear regression has been applied by others to MRS imaging data to estimate tissue-specific metabolite concentrations assuming homogeneous metabolite concentrations in GM and WM throughout the brain1. They showed an increase of N-acetylaspartate (NAA), creatine (Cr), and myo-inositol (mIno) concentrations in GM compared to WM and the opposite relation for choline-containing-compounds. The differences between GM and WM metabolite concentrations and how these values vary across brain regions is still unclear. We aimed to untangle these factors by independently assessing the dependency of metabolite concentrations on both region and tissue composition within the spectroscopic volume of interest (VOI).Methods
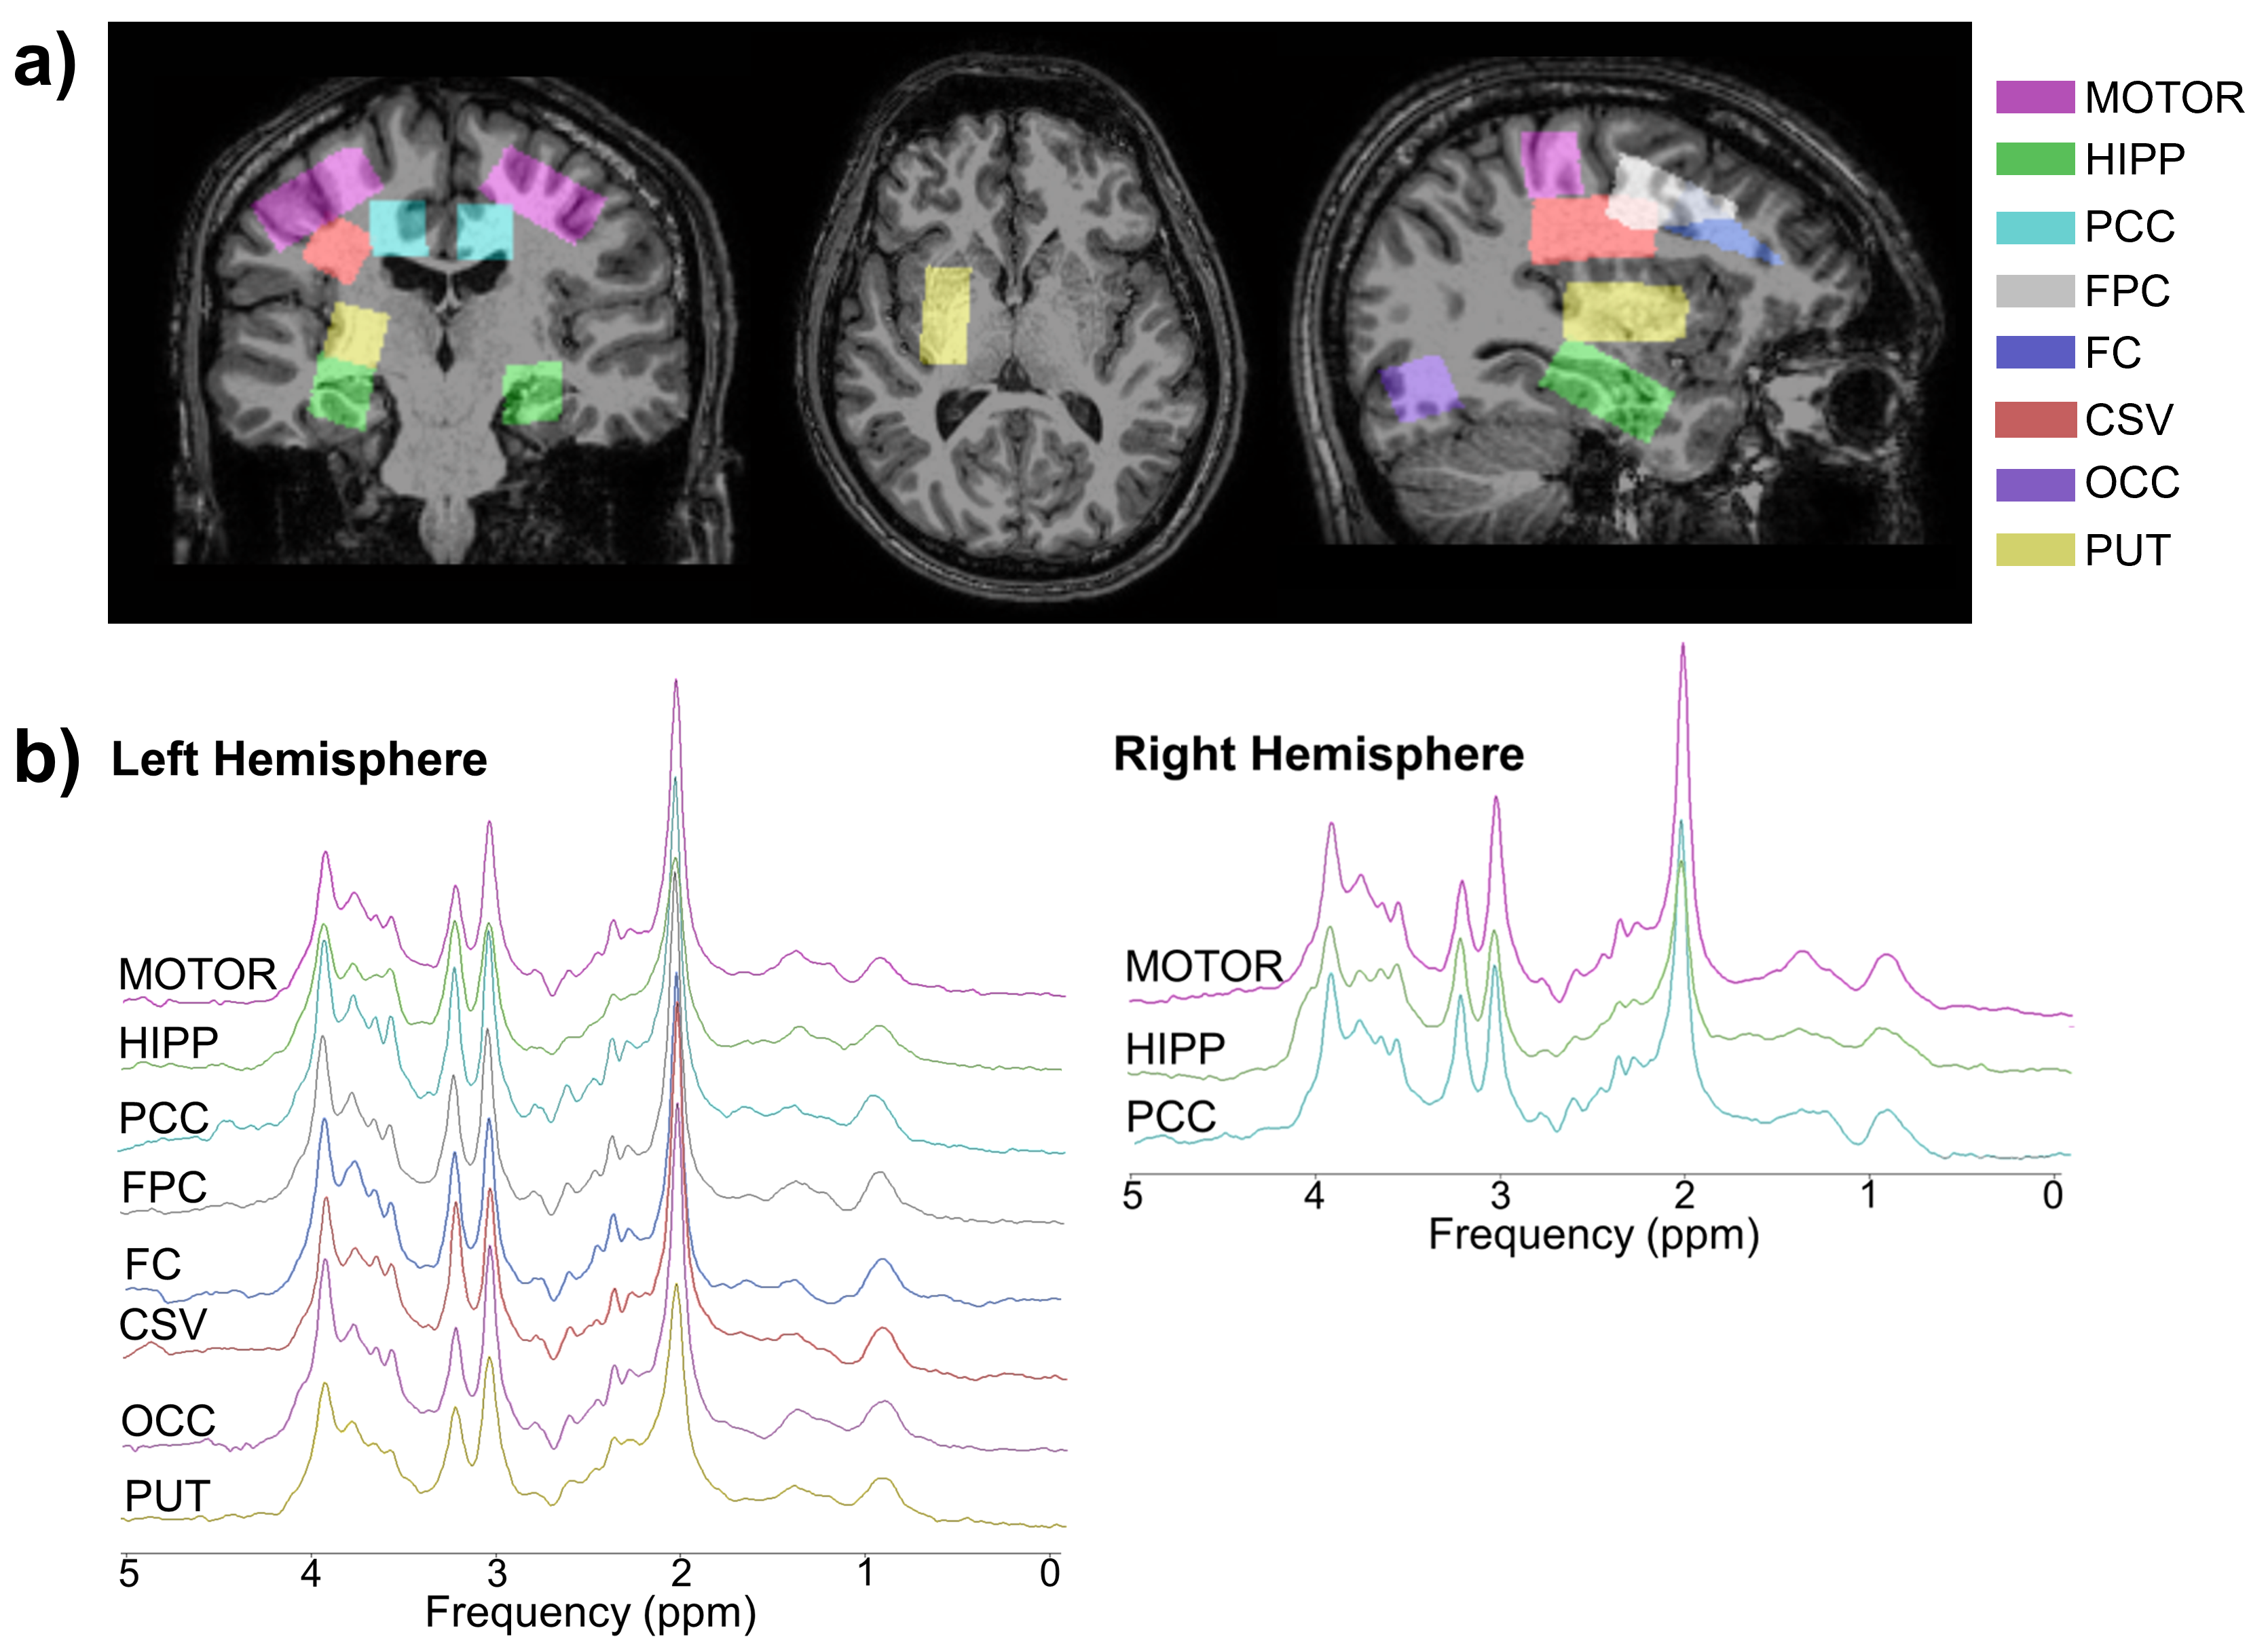
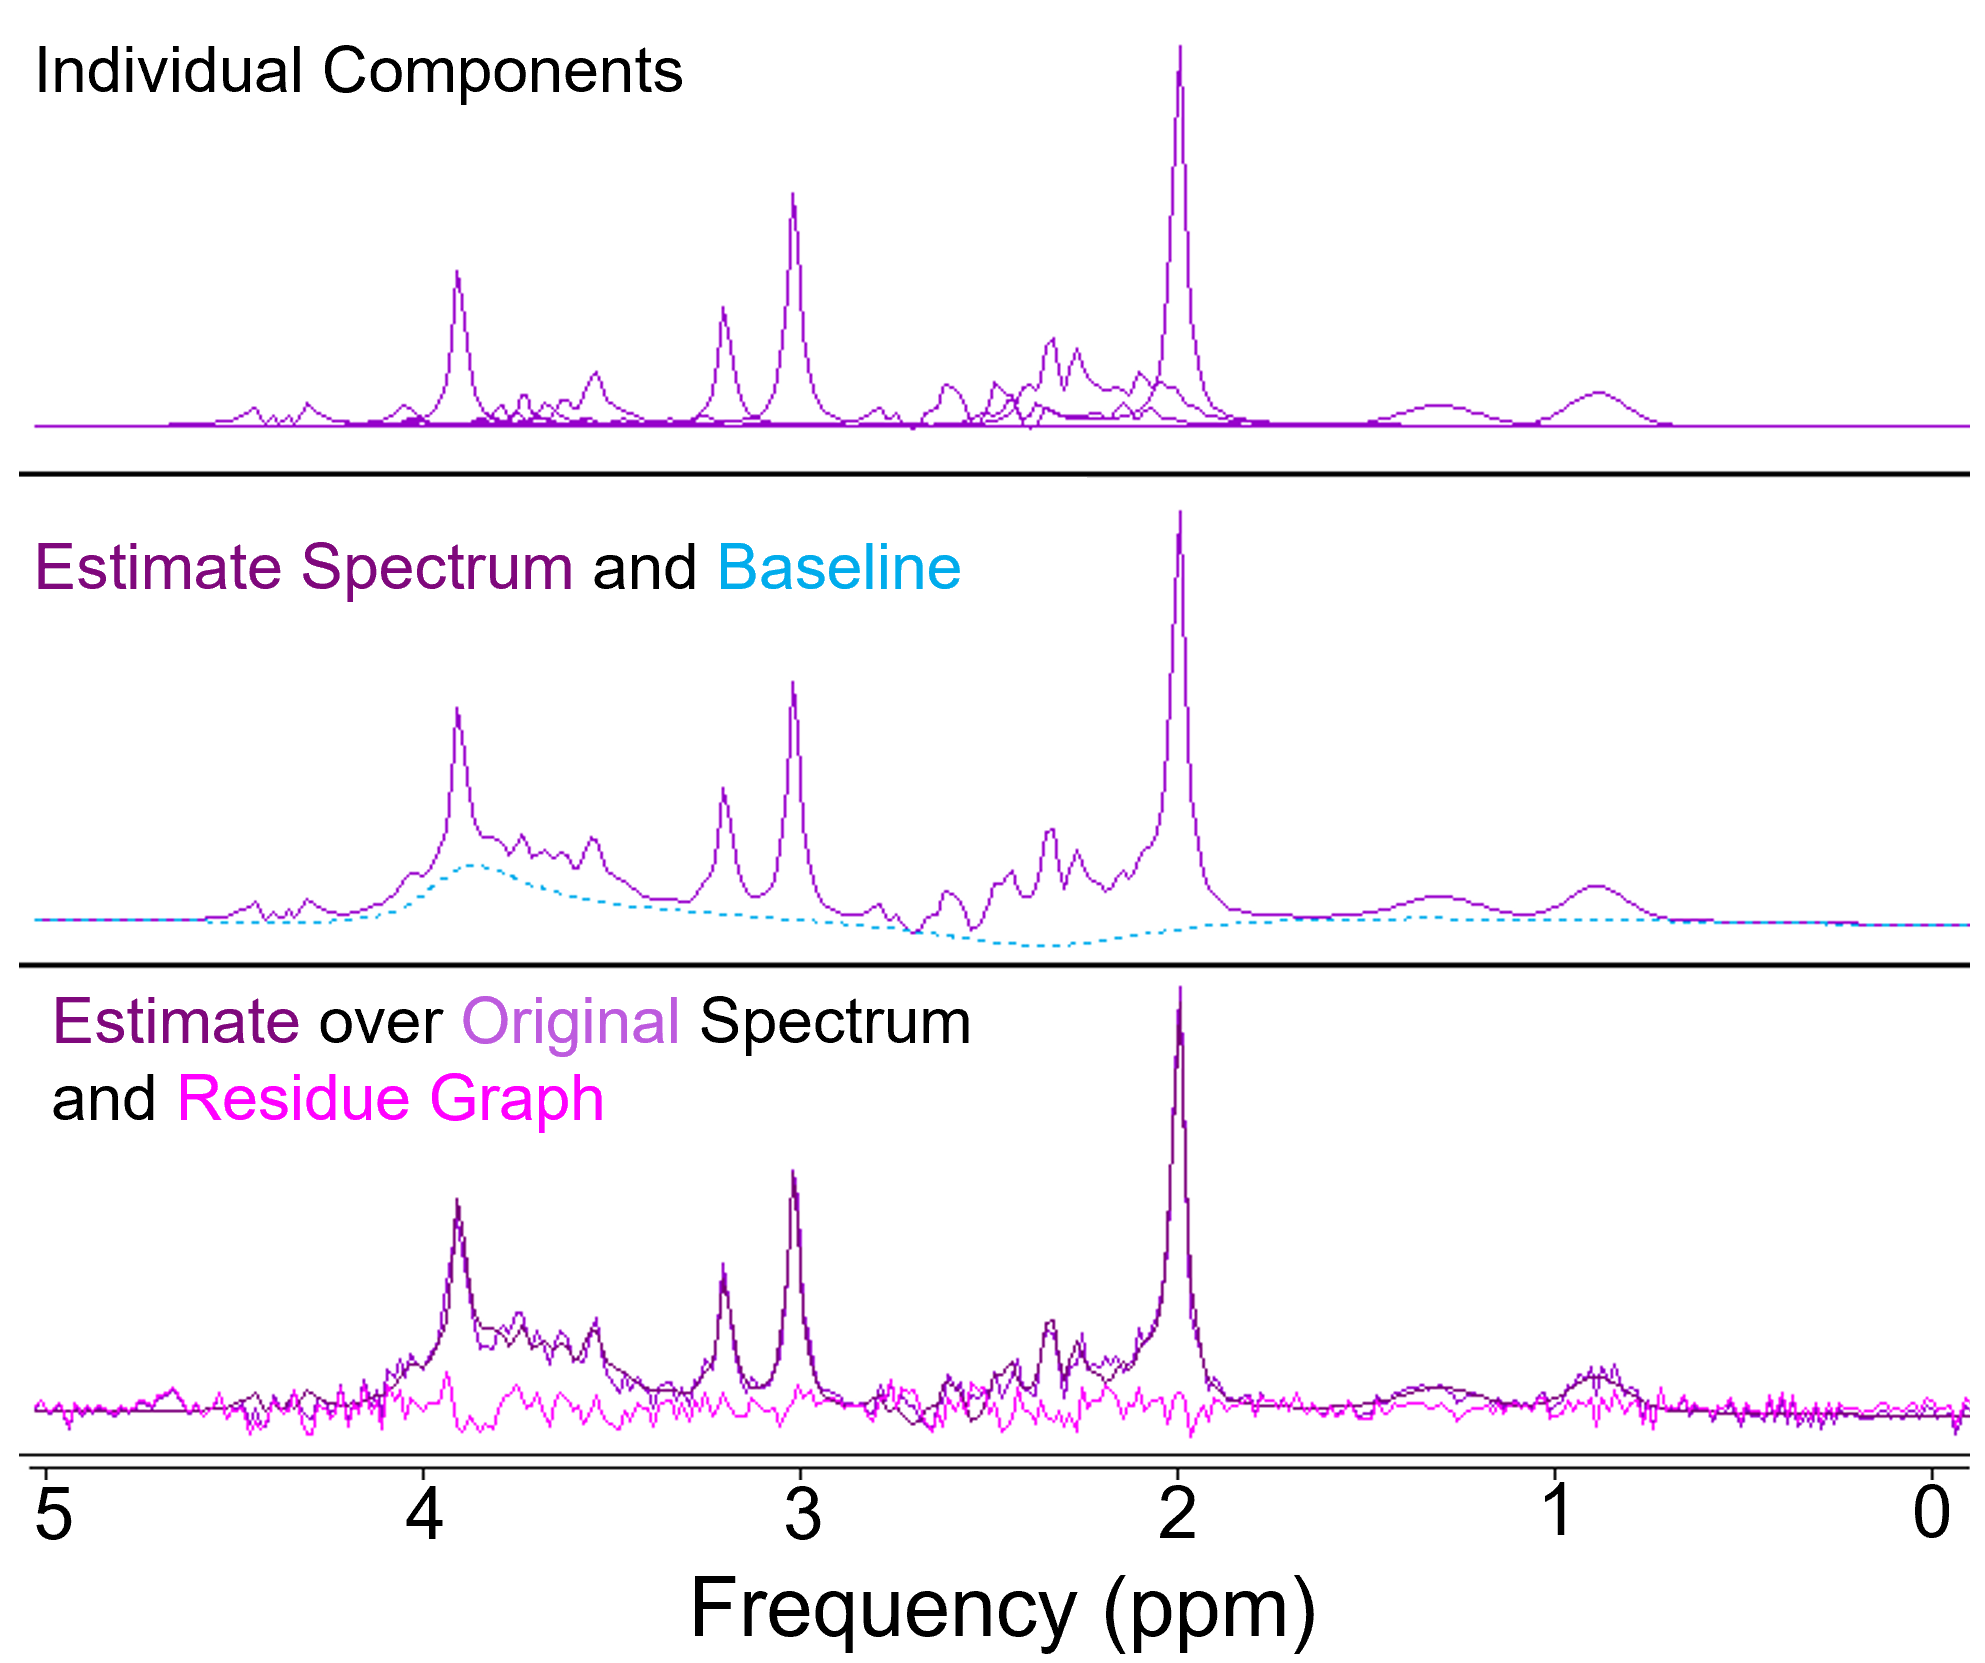
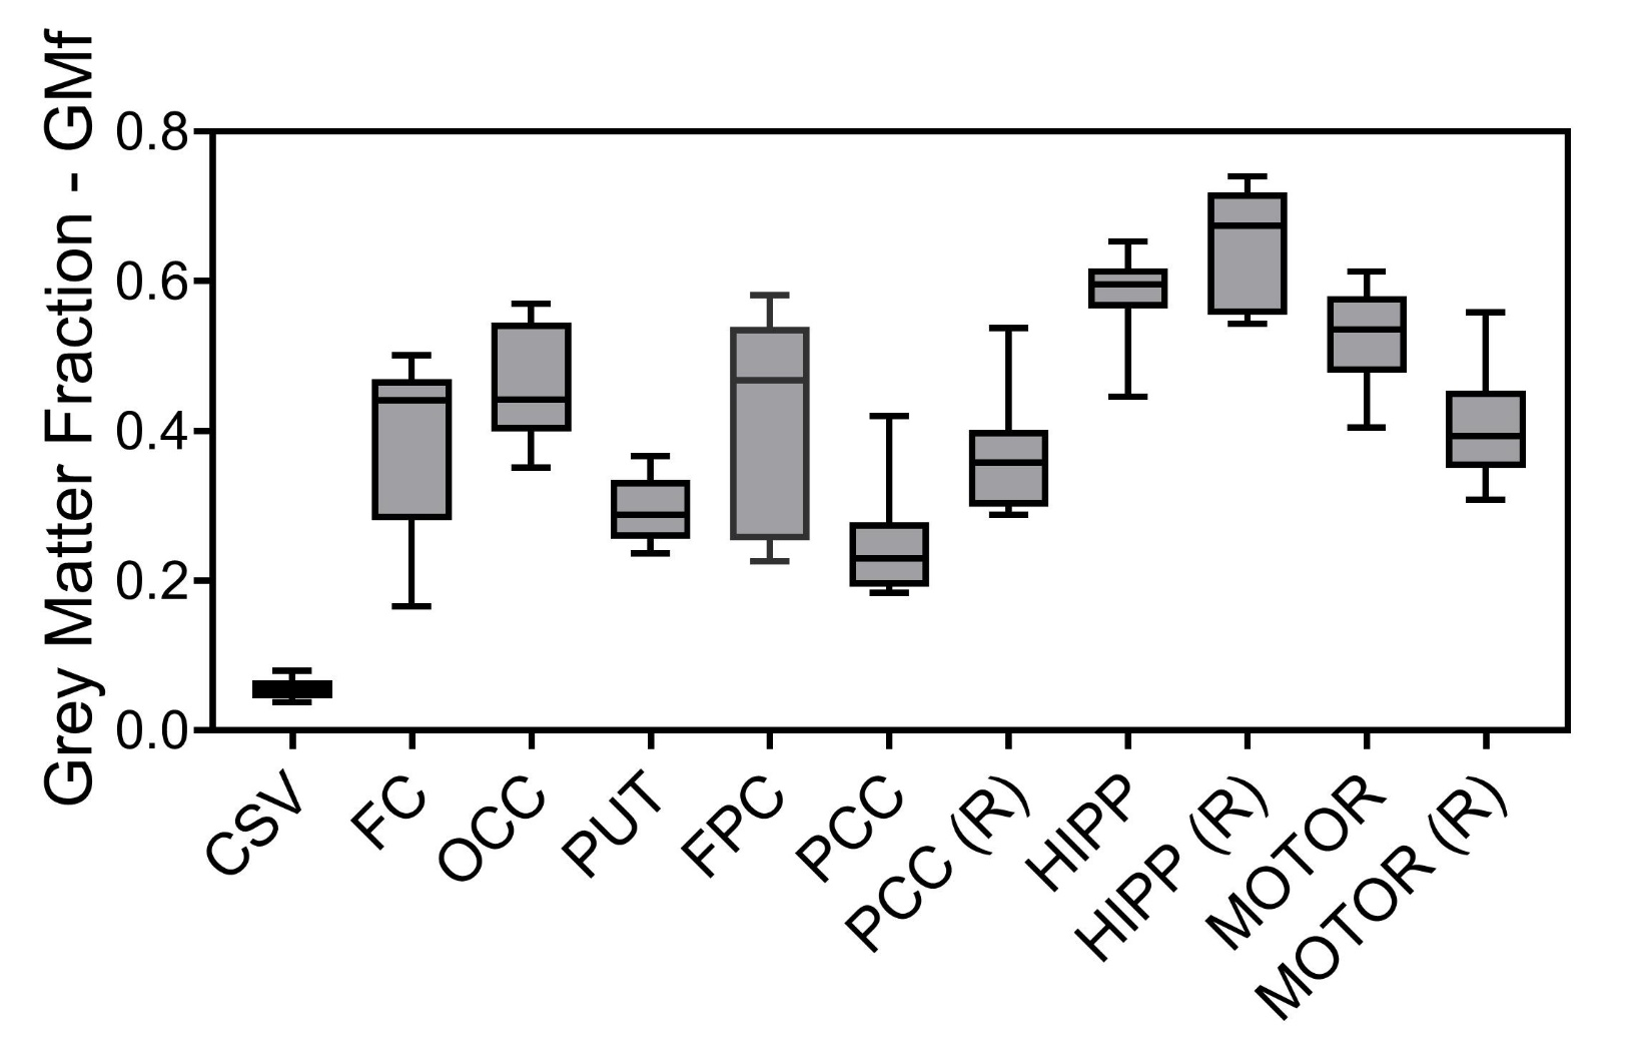
Ten healthy volunteers (5 females, 28.0 ± 9.2 years) underwent 1H-MRS scanning on a 3.0T Philips scanner. Single-voxel spectra were acquired using the PRESS sequence (TR = 2 s, TE = 35-41 ms) in 11 VOIs with volume adjusted per subject and brain region (8.1 - 10.24 cm3) (Figure 1 a). T1-MPRAGE images (1 mm isotropic) were segmented using FAST2 in FSL3 and % GM (%GM) and WM (%WM) within each VOI were calculated by averaging the tissue probabilistic maps where % CSF (%CSF) <10%. Tissue grey matter fraction (GMf) was calculated as %GM/(%GM+%WM). Spectra were quantified in the time domain using jMRUI4 (Figure 2). The basis set included NAA, Cr, mIno, glutamate (Glu), glutamine (Gln) and glycerophosphorylcholine (GPC) to represent total choline-containing compounds. Metabolite concentrations (mmol/kg wet weight) were estimated relative to water from a water unsuppressed scan and corrected for %CSF and for tissue-specific water T1 and T2 relaxation5. Molar concentration of pure water was scaled by the tissue water density and by the volume fraction of tissue in the VOI. For each metabolite, concentrations that lay outside [median concentration ± 3 × (1.4826 × median absolute deviation)] were excluded from the analysis. A linear mixed-effects model was fitted in R (version 4.2.1, “lme4” package) separately for each metabolite with “GMf” as a fixed effect covariate and “subject” as a random effect to account for repeated measurements (Model 1). The value of adding more predictors, “region“ as fixed effect (Model 2) and “region by GMf“ covariates (Model 3) was assessed by the impact on the variance explained by the model, the normality of the residuals and the p-values (level of significance set at p < 0.01) for model comparisons.$$\it Model \: 1:\; S_{ij}^{metab} =\beta^{(0)} + \beta^{(1)}GMf_{ij}+\gamma_{i}+\eta_{ij}$$
$$\it Model \: 2:\; S_{ij}^{metab} =\beta_j^{(0)} + \beta^{(1)}GMf_{ij}+\gamma_{i}+\eta_{ij}$$
$$\it Model \: 3:\; S_{ij}^{metab} =\beta_j^{(0)} + \beta_j^{(1)}GMf_{ij}+\gamma_{i}+\eta_{ij}$$
where β(0) and β(1) are fixed effects, and γi and ηij (residuals) are random effects, with the subscripts i denoting dependency on subject and j on region. The model fitting maximises the likelihood as a function of the parameters (the fixed effects and the standard deviation of the normal distributions from which γi and ηij are sampled).
Results
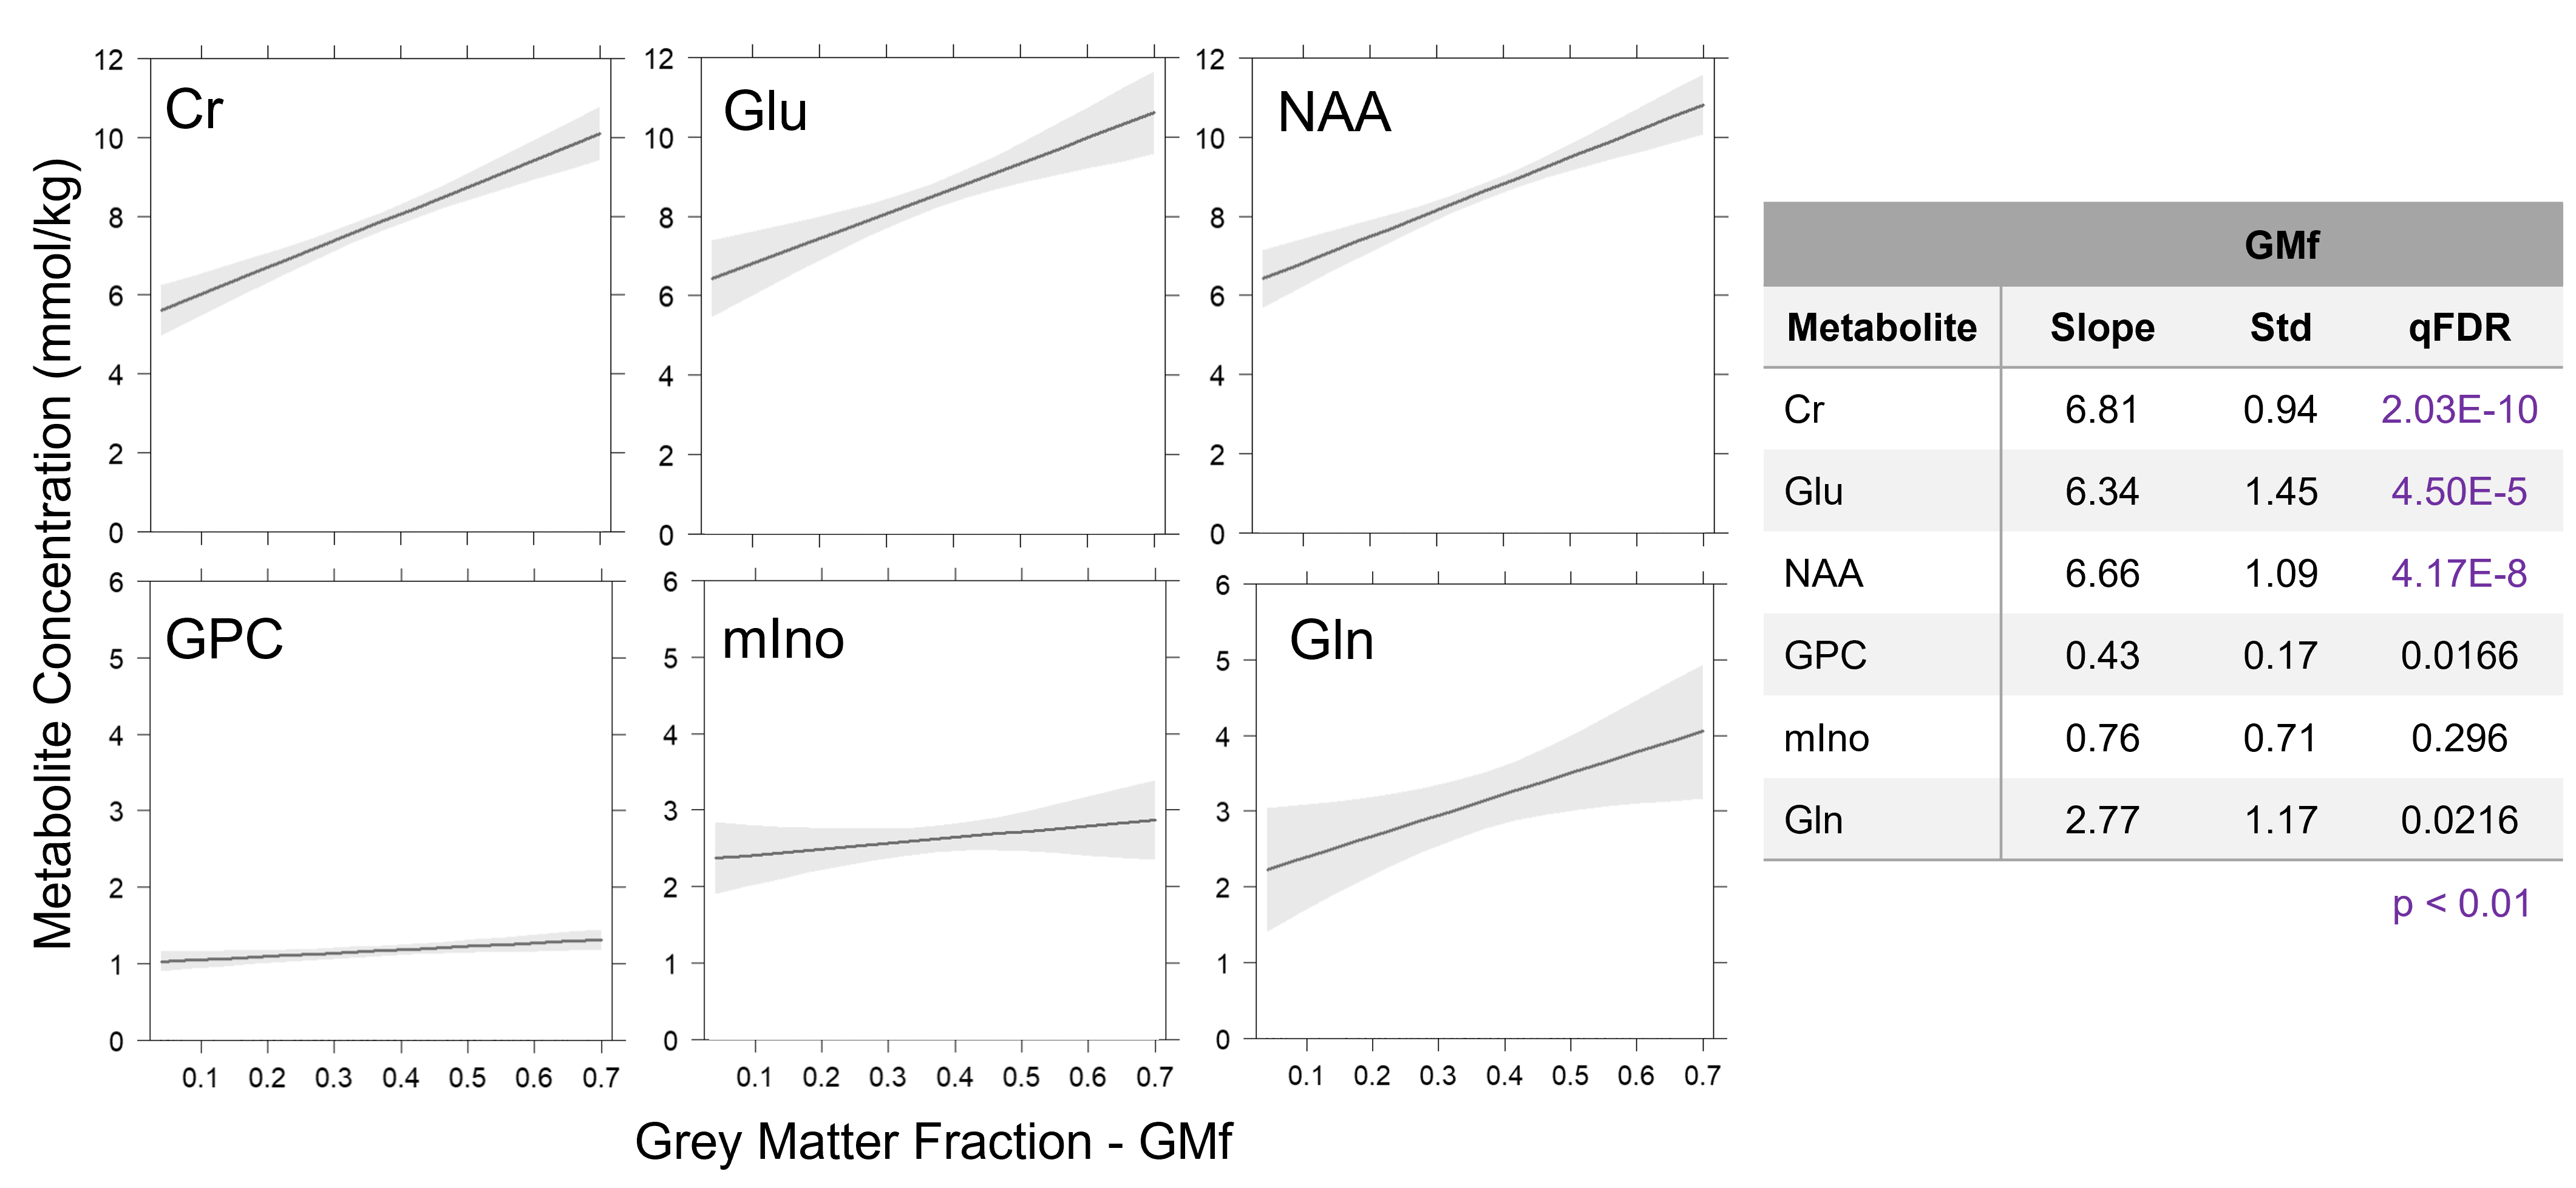
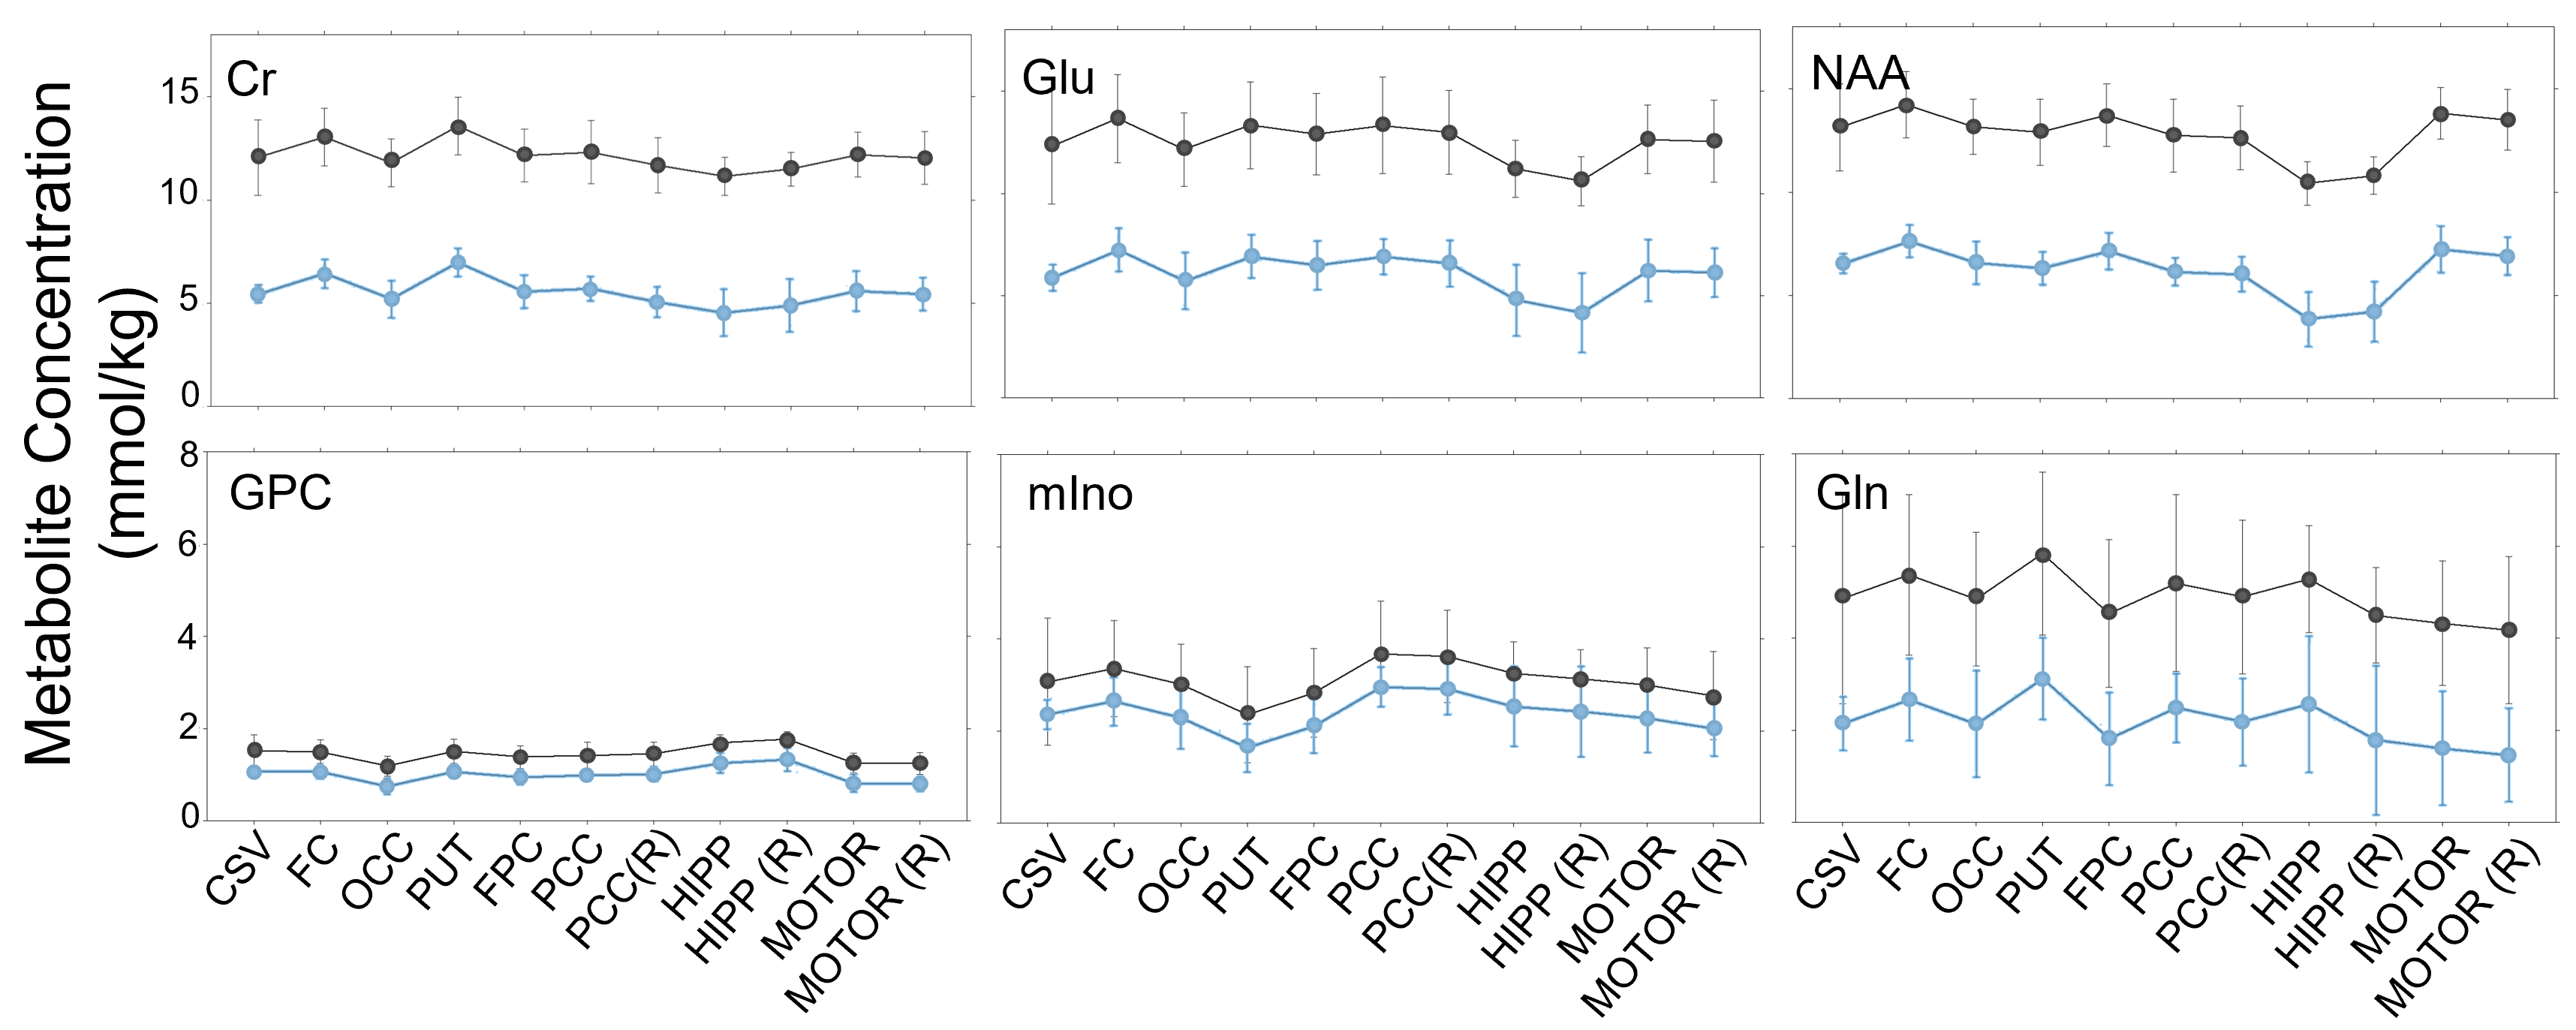
Good quality spectra were acquired across the 11 VOIs (Figure 1 b). However, NAA signal-to-noise ratio was reduced by around 2-fold in the hippocampus and putamen regions in comparison to other VOIs and the Cramer-Rao Lower Bounds were generally higher in these regions. Average GMf varied between 0.056 ± 0.014 to 0.653 ± 0.077, in the centrum semiovale and hippocampus regions on the right hemisphere, respectively (Figure 3). The addition of region as fixed effect reduced by half or more the residual variance in the model (from Model 1 to 2). Apart from GPC, the region by GMf covariate did not show a significant effect (from Model 2 to 3), thus supporting a common gradient across regions for modelling the dependence of metabolite concentrations on GMf. NAA, Cr and Glu concentrations were significantly higher in GM than in WM (Figure 4). In addition to the dependence on GMf, there was a significant (p < 0.0005) regional variation in metabolite concentrations (Figure 5).Discussion
The high quality single-voxel spectra acquired with good brain coverage (11 brain regions extending from the occipital to the frontal cortex and from the motor cortex to the hippocampus) allowed us to assess both regional and tissue-specific differences in a single analysis. By including region as a fixed effect and subject as a random effect, we were able to show a clear dependence of metabolite concentration on tissue GM fraction with estimates for NAA, Cr and Glu in WM about 60% of that in GM. The demonstration that the concentration of metabolites in GM and WM differs across the brain raises the question as to what underlies this variation in terms of brain region and function.Conclusion
There was a strong positive dependence of NAA, Cr and Glu concentrations on fractional GM content within the spectroscopic VOI across all brain regions when accounting for inter-subject variability. This reiterates the importance of reporting tissue fractions for volume GM correction to potentially improve the sensitivity to detect changes in diseases that affect the tissue compartments differently.Acknowledgements
This work was supported by the EPSRC (SIDD grant EP/M005909/1), The University of Manchester Imaging Facilities, NIHR Manchester Clinical Research Facility and The University of Manchester Computational Shared Facility. AJG is funded by the EU H2020 MSCA-ITN-2018: INtegrating Magnetic Resonance SPectroscopy and Multimodal Imaging for Research and Education in MEDicine (INSPiRE-MED), funded by the European Commission under Grant Agreement #813120.References
1. Tal A, Kirov II, Grossman RI, Gonen O. The role of gray and white matter segmentation in quantitative proton MR spectroscopic imaging. NMR Biomed. 2012;25(12):1392-1400. doi:10.1002/nbm.2812
2. Zhang Y, Brady M, Smith S. Segmentation of brain MR images through a hidden Markov random field model and the expectation-maximization algorithm. IEEE Trans Med Imaging. 2001;20(1):45-57. doi:10.1109/42.906424
3. Woolrich MW, Jbabdi S, Patenaude B, et al. Bayesian analysis of neuroimaging data in FSL. Neuroimage. 2009;45(1):S173-S186. doi:10.1016/j.neuroimage.2008.10.055
4. Stefan D, Cesare F Di, Andrasescu A, et al. Quantitation of magnetic resonance spectroscopy signals: The jMRUI software package. Meas Sci Technol. 2009;20(10). doi:10.1088/0957-0233/20/10/104035
5. Near J, Harris AD, Juchem C, et al. Preprocessing, analysis and quantification in single‐voxel magnetic resonance spectroscopy: experts’ consensus recommendations. NMR Biomed. 2021;34(5):1-23. doi:10.1002/nbm.4257
6. Starčuk Z, Starčuková J. Quantum-mechanical simulations for in vivo MR spectroscopy: Principles and possibilities demonstrated with the program NMRScopeB. Anal Biochem. 2017;529:79-97. doi:10.1016/j.ab.2016.10.007
Figures