0277
Multi-exponential diffusivity spectroscopy with clinical DWI protocol has the potential to diagnose and characterize gliomas1Institute of Science and Technology for Brain-Inspired Intelligence, Fudan University, Shanghai, China, 2Radiology Department, Hua Shan Hospital, Fudan University, Shanghai, China, 3Human Phenome Institute, Fudan University, Shanghai, China
Synopsis
Keywords: Quantitative Imaging, Brain, Diffusion, Multi-exponential spectroscopy
We present a multi-exponential diffusivity spectroscopy model to measure the diffusivity distribution of individual voxels in gliomas, which enables the comparison of the spectral fraction components between brain tumors and normal tissues. A neural network algorithm was used to speed up and improve the stability of the decomposition of multi-exponential decay data with a lower signal-to-noise ratio. The results show that diffusivity fractions of some spectral components were significantly different between IDH-mutant and -wild gliomas in grades 2 and 3.Introduction
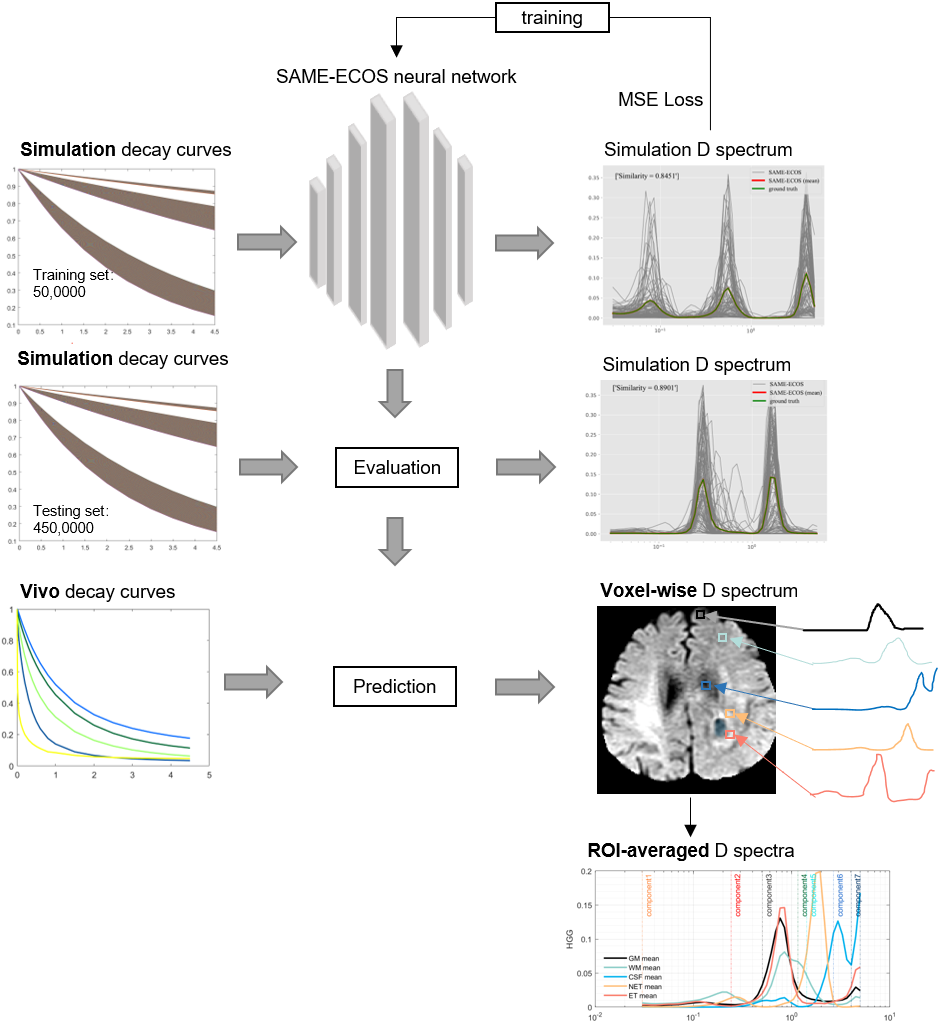
The mean diffusivities (MD) measured with conventional methods may not provide a proper statistical average of diffusivities in microscopic water pools within the tissue voxel. A non-parametric approach for spectra analysis for multi-exponential diffusion data has been proposed and validated in healthy human brains1. The decomposition of multi-exponential decay data poses a challenge to traditional fitting algorithms, such as non-negative least squares. Recently, a machine learning neural network algorithm, SAME-ECOS, was derived to improve the spectra solutions2. In this study, we developed a multi-exponential D spectroscopy model to measure the diffusivity distributions in each voxel of gliomas.Methods
Clinical Human Brian DataA cohort containing fifty-three patients with pathology-confirmed gliomas and six healthy volunteers was included for diffusion spectra analysis. All participants underwent 3-Tesla diffusion MRI (MR750, Signa HDxt, GE Medical System, Milwaukee, WI, USA) with 21 b-values (0, 10, 20, 30, 50, 100, 150, 200, 300, 400, 500, 600, 800, 1,000, 1,500, 2,000, 2,500, 3,000, 3,500, 4,000, and 4,500 s/mm2). Images with higher b-values were averaged up to four times. T1-weighted with enhancement (T1WI+C) and T2-weighted fluid-attenuated inversion recovery (T2W-FLAIR) were also acquired. All diffusion data were processed with the FSL3 software package to correct for eddy currents and skull removal. T1WI+C and T2W-FLAIR were registered to the b=0 DWI images with the SPM software package of MATLAB (MathWorks, Inc., 2019b, Natick, MA, USA).
Numerical Simulations and Spectra Analysis via SAME-ECOS2
The diffusion signal in each voxel can be represented as a summation of many signal components from intravoxel water pools in various microscopic tissue environments:
$$S(b) = \int e^{-bD}f(D)dD$$
Where $$$f(D)$$$ is the continuous distribution of mean diffusivity $$$D$$$. We performed 5,000,000 decay curves (with $$$D\in[0.03,5]\mu m^2/ms$$$, SNR $$$\in[30,300]$$$) as numerical simulations to train and test the SAME-ECOS (a neural network to map the decay data to its D spectrum, Figure 1). The 50 basis $$$D$$$s were logarithmically spaced in [0.03,5] to represent the spectrum of $$$n$$$ D components. The goodness of spectrum fitting was quantitatively assessed using cosine similarity scores (CSS):
$$CSS={X\cdot Y}/{||X||\times ||Y||}$$
Where $$$X$$$ and $$$Y$$$ are the vector representations of the predicted and the ground truth spectra; $$$||X||$$$ and $$$||Y||$$$ are their Euclidean norms. Then SAME-ECOS model was applied to the glioma in vivo data to acquire the D spectrum ($$$f(D)$$$) in each voxel. To identify tissue-specific characteristics of $$$D$$$s with improved statistical power, we averaged normalized $$$D$$$s across regions of interest (ROIs) containing: white matter (WM), gray matter (GM), cerebrospinal fluid (CSF), enhancing tumor (ET), non-enhancing tumor (NET). Next, to spatially resolve features of the D fraction maps we integrated the normalized $$$D$$$s in each voxel across spectral bands defined as shown in Table 1. The D spectra of the normal tissue (WM, GM, and CSF) were compared between the glioma patients and the healthy controls.
Statistical Analysis
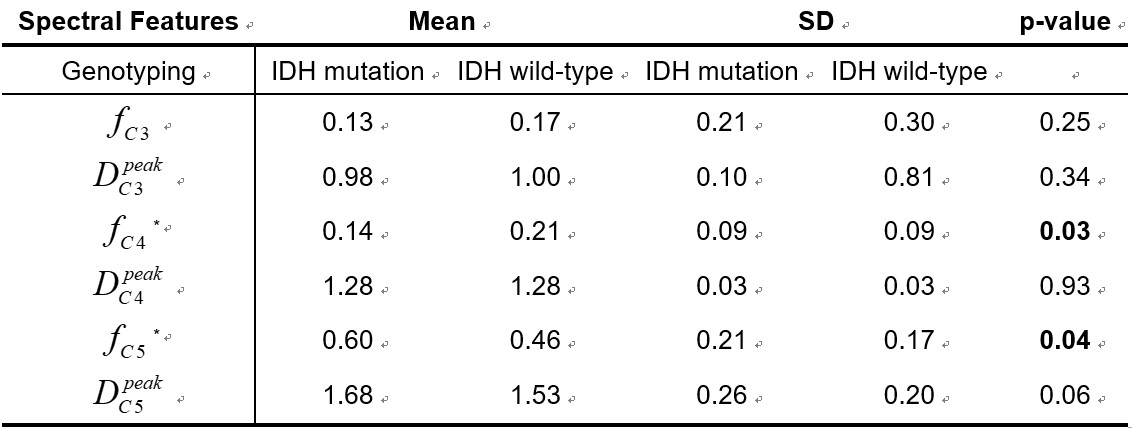
Fractions and the peaks’ locations of each spectral component were derived and compared between IDH-mutated and IDH-wild gliomas in grades 2 and 3 using the U test and one-way ANOVA test (SPSS v.23.0, Chicago, USA).
Results
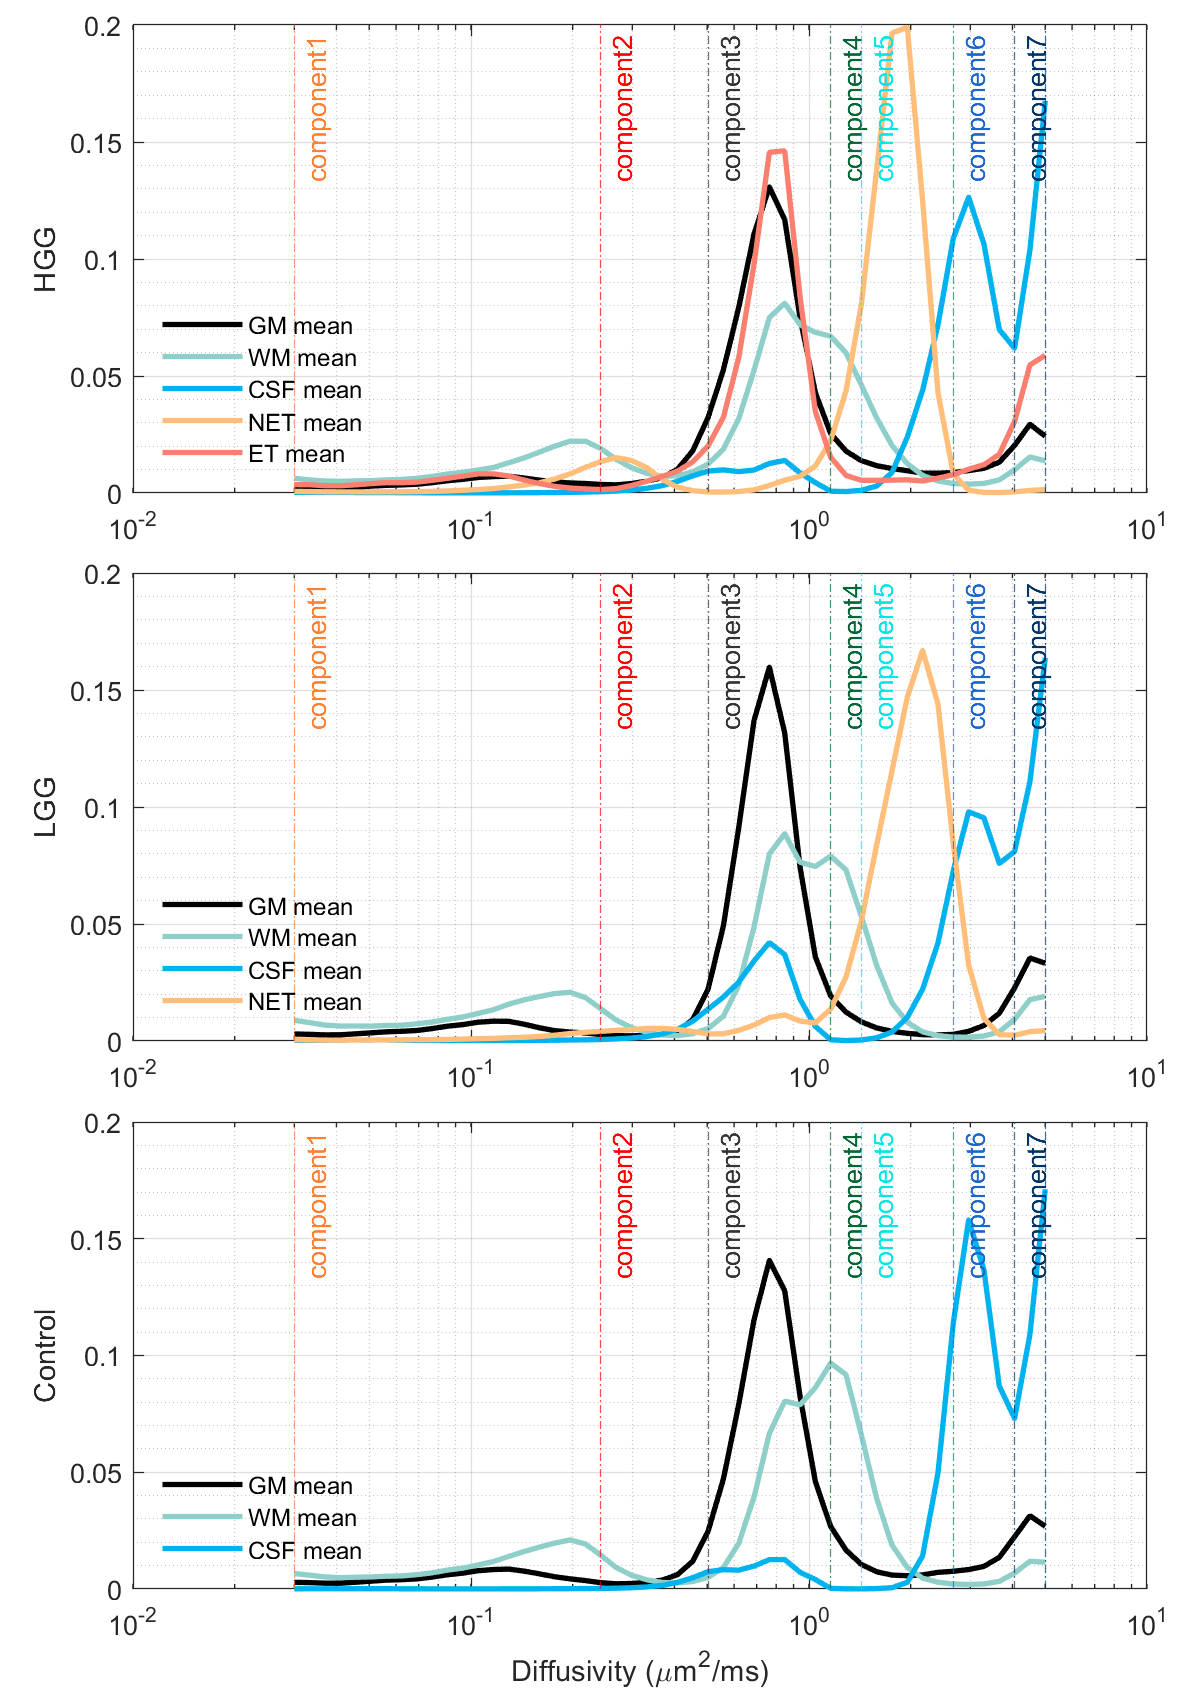
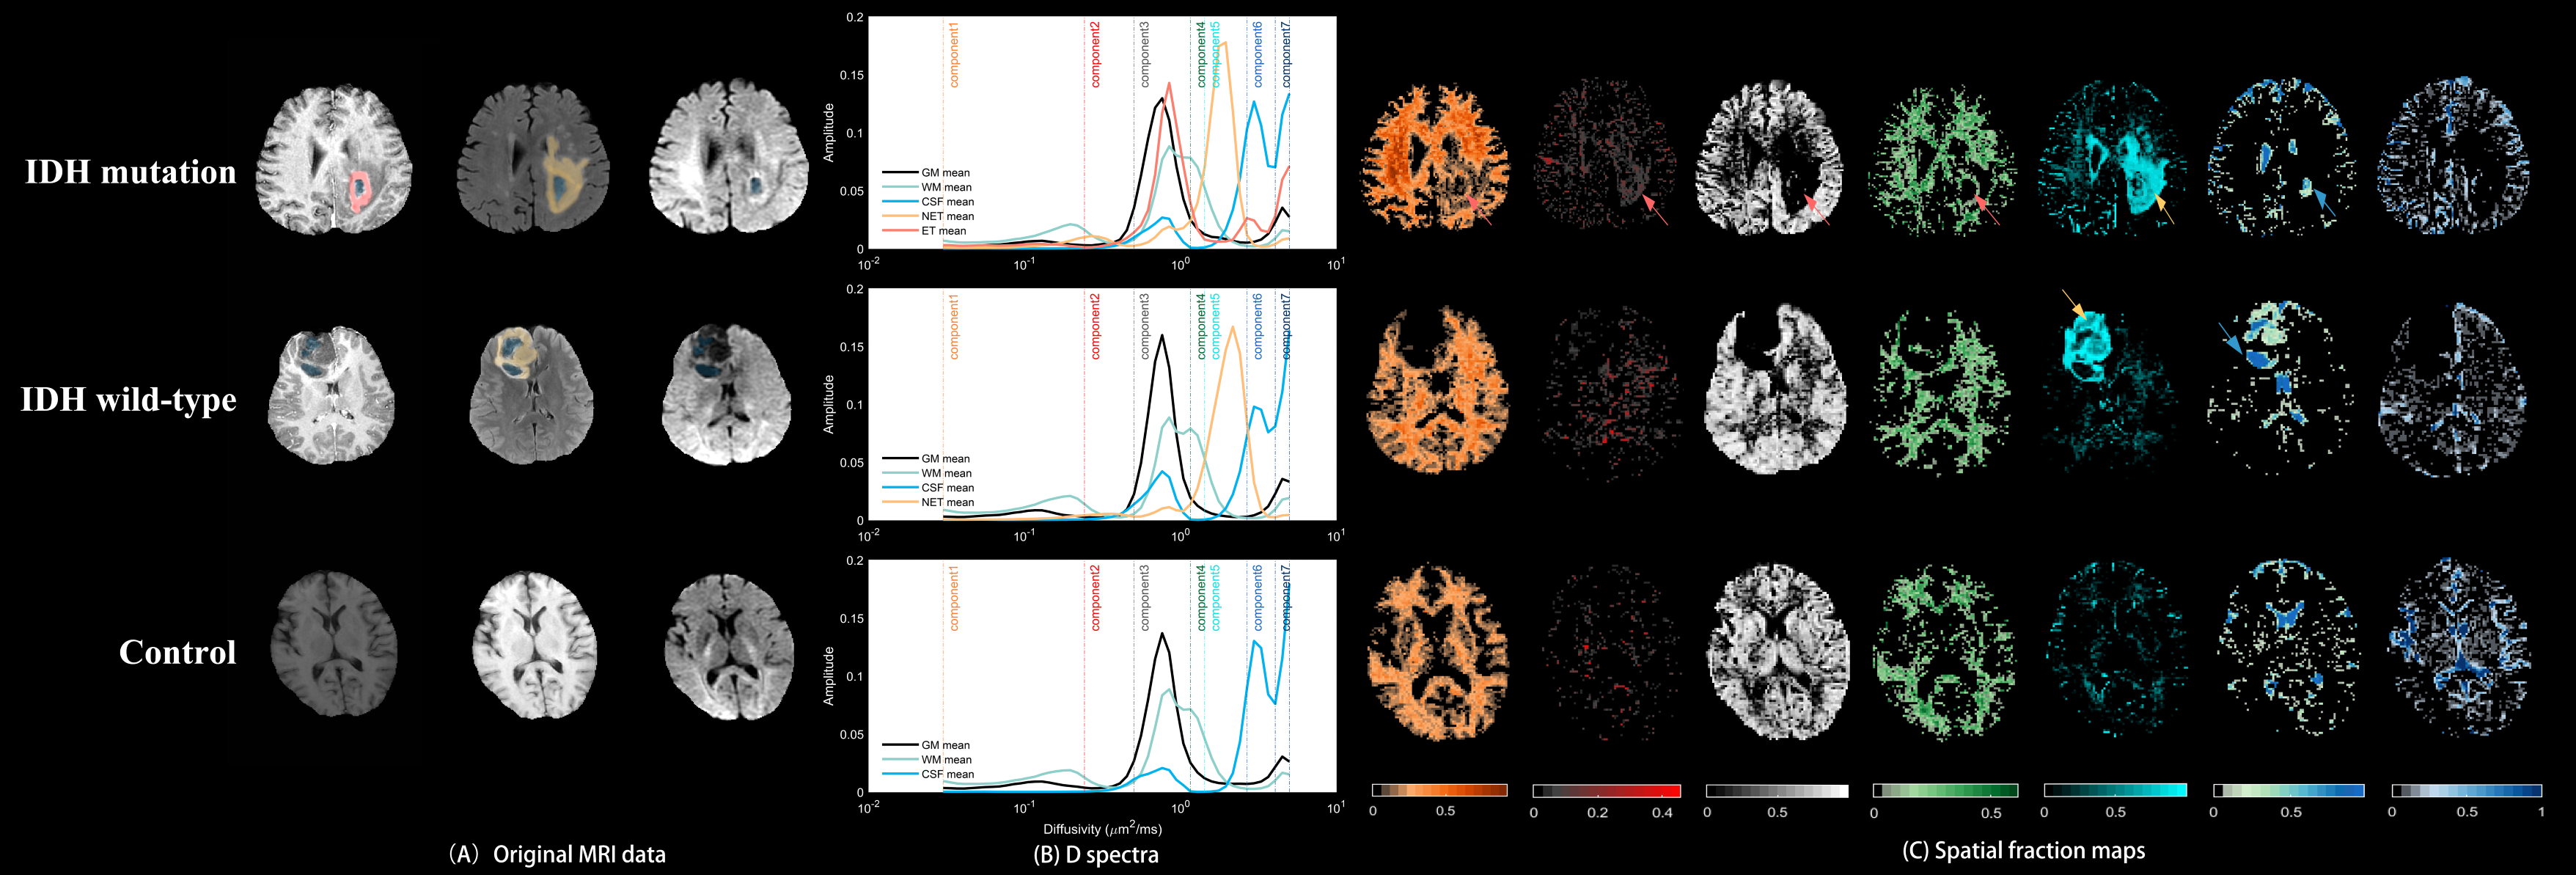
Figure 2 shows the averaged D spectra from the ROIs placed in a high-grade glioma (HGG), a low-grade glioma (LGG), and a healthy volunteer (control). The distribution of $$$D$$$ diverged distinctly from different tissues. Figure 3 illustrates the corresponding fraction maps calculated by integrating spectral components across spectral bands, as shown in Table 1. The largest fractions of the third and the fourth diffusivity components (0.50~1.29 $$$\mu m^2/ms$$$) were observed in GM and WM. CSF occupied most of the fractions of the sixth diffusivity component (2.67~3.66 $$$\mu m^2/ms$$$). The necrosis also contained a similar diffusivity component to CSF (dodger blue arrow). Both Smaller components (0.50~1.04 $$$\mu m^2/ms$$$) and the largest diffusivity (>4.06 $$$\mu m^2/ms$$$) was observed mainly in regions of ET. A unique component (1.43~2.41 $$$\mu m^2/ms$$$) was observed in NET. The D spectra of normal tissue were similar between patients and controls (CCS > 0.99). Table 2 demonstrates the fractions of the fourth and the fifth diffusivity components in the regions of NET were significantly different between IDH-mutated and IDH-wild gliomas in grades 2 and 3 ($$$p<0.05$$$) (Table 2).Discussion
A multi-exponential diffusivity spectroscopy model is presented to measure the diffusivity distribution of individual voxels in gliomas. The in vivo D spectra analysis results suggest that the diffusivity distribution of ET is more like the GM, which might relate to the increased density of cells4. The largest diffusivity might be correlated to the increasement of capillaries in regions of ET. The present results showed the potential of the spectral features derived from the fifth component in NET in distinguishing IDH-mutated and -wild gliomas in grades 2 and 3. However, a larger dataset is needed for further investigation. The diffusivity distributions of the normal tissue are consistent with the previous findings1.Conclusion
Our results show that it is possible to measure multiple diffusivity distributions in individual voxels from DWI acquired with a wide range of b-values. The spectra analysis exhibited differences in peak locations and shapes among brain tumors and normal tissue, suggesting the spectrum analysis for diffusivity distributions has the potential to diagnose and characterize gliomas.Acknowledgements
Funding: This work was supported by the NationalNatural Science Foundation of China (No. 81971583), Shanghai Natural Science Foundation (No.20ZR1406400), Science and Technology Support Project for Medicine sponsored by Science and Technology Commission of Shanghai Municipality (No.18411967300), and Shanghai Municipal Scienceand Technology Major Project (Nos. 2017SHZDZX01 and 2018SHZDZX01).References
1. Avram AV, Sarlls JE, Basser PJ. Measuring non-parametric distributions of intravoxel mean diffusivities using a clinical MRI scanner. Neuroimage. 2019;185:255-262.
2. Liu H, Joseph TS, Xiang QS, et al. A data-driven T2 relaxation analysis approach for myelin water imaging: Spectrum analysis for multiple exponentials via experimental condition oriented simulation (SAME-ECOS). Magn Reson Med. 2022;87(2):915-931.
3. Jenkinson M, Beckmann CF, Behrens TE, Woolrich MW, Smith SM. Fsl. Neuroimage. 2012;62(2):782-90.
4. Maynard J, Okuchi S, Wastling S, et al. World Health Organization Grade II/III Glioma Molecular Status: Prediction by MRI Morphologic Features and Apparent Diffusion Coefficient. Radiology. 2020;296(1):111-121.
Figures