0276
MRI profiling of temporal lobe epilepsy with hippocampal sclerosis using multi-compartment diffusion models
Xiaonan Zhang1, Guohua Zhao1, Huiting Zhang2, Eryuan Er Gao1, and Jingliang Cheng1
1The First Affiliated Hospital of Zhengzhou University, Zhengzhou, China, 2MR Scientific Marketing, Siemens Healthineers Ltd., Wuhan, China
1The First Affiliated Hospital of Zhengzhou University, Zhengzhou, China, 2MR Scientific Marketing, Siemens Healthineers Ltd., Wuhan, China
Synopsis
Keywords: Quantitative Imaging, Brain
The hippocampal microstructural alterations by using routine magnetic resonance imaging presents a challenge. This study aimed to evaluate the performance of the NODDI and MAP models in temporal lobe epilepsy (TLE) patients with hippocampal sclerosis (HS). Our results found that all NODDI and MAP parameters had significant differences between ipsilateral HS and contralateral HS/HC, and had MAP models better diagnostic performance than NODDI. In addition, combined MAP model had significant better diagnostic performance than all the single parameters. In conclusion, MAP is superior to NODDI in diagnosing TLE with HS.Introduction or Purpose
The most prevalent intractable focal epilepsy is temporal lobe epilepsy(TLE)[1], which is frequently linked with hippocampal sclerosis(HS). Recent observations suggest that hippocampal abnormalities are not the only structural injury in TLE[1,2] , and early hippocampal microstructural changes may be missed. Thus, a noninvasive in vivo investigation of these hippocampal microstructural alterations would be extremely useful. Advanced diffusion models were recently proposed to provide additional microstructure information [3,4]. This study aimed to evaluate the diagnostic performance of neurite orientation dispersion and density imaging (NODDI) and mean apparent propagator (MAP) in TLE-HS.Methods
Fifty-nine unilateral TLE-HS and 64 healthy controls (HC) were retrospectively enrolled. The diagnosis of TLE-HS based on a comprehensive evaluation, including detailed clinical history, seizure semiology, neurological examination, scalp video-EEG recordings, and MRI assessment. All patients met the following inclusion criteria: 1) unilateral temporal lobe seizure onset through scalp or intracranial video EEG recordings; 2) MRI evidence of pathology located within the epileptogenic mesial temporal lobe, with hippocampal sclerosis ; 3) concordant PET finding of hypometabolism in the interictal temporal lobe. All controls had no structural abnormalities on MRI images. For all participants, MR images were acquired on a 3T MR scanner (MAGNETOM Prisma, Siemens Healthcare, Erlangen, Germany). DWI data were acquired using a single-shot spin echo EPI sequence (b-values of 0, 1000, 2000 s/mm2, 30 diffusion sampling directions for each non-zero b value, TR = 3800ms, TE = 72ms, 60 axial slices with 2.2 mm thickness and 2 mm gap, matrix size = 110 × 110, field of view = 220 × 220 mm2, voxel size = 2.0 × 2.0 × 2.2 mm3, and scan time, 3min:32s. Eddy current and motion correction were conducted on DWI images using the Diffusion Kit Eddy tool (http://diffusionkit.readthLedocs.io). Then the NODDI and MAP parameter fitting was performed using an open source Amico tool (https://github.com/daducci/AMICO/), and the NODDI and MAP parametric maps were obtained, the NODDI parameters include Isotropic volume fraction (ISOVF), intracellular volume fraction (ICVF), and orientation dispersion index (ODI) , and the MAP-MRI parameters include mean square displacement (MSD), non-Gaussianity (NG), NG axial (NGAx), NG vertical (NGRad), Q-space inverse variance (QIV), return to the origin probability (RTOP), return to the axis probability (RTAP), and return to the plane probability (RTPP). Both MR Fluid Attenuated Inversion Recovery (Flair) images and T1 MPRAGE images from each subject were co-registered to diffusion weighted images using the ITK-SNAP (http://www.itksnap.org) software, and bilateral hippocampal segmentations were saved as the segmented regions of interest (ROIs) by consensus two neuroradiologists. Then, the mean values of parameters for hippocampal segmentations. One-way analysis of variance (ANOVA) or Kruskal-Wallis ANOVA were used to detect differences in parameters among ipsilateral, contralateral and HC groups. Then two sample t test with LSD post-hoc multiple correction method or Mann⁃Whitney U test was used for pairwise comparison between any two groups. And the differential diagnostic efficiency of each parameter was determined by ROC analysis.Results
Compared with the contralateral and HC, the ipsilateral had significantly lower ICVF, ODI, NG, NGAx,NGRad,RTAP, RTOP, RTPP and significantly higher ISOVF, MSD, QIV (all P<0.05). Compared with the HC, the MSD,RTAP, RTOP was significantly lower and the ISOVF, MSD, QIV was higher in the contralateral (P<0.05). The detailed results are shown in Figure 2. Between the ipsilateral and HC, parameters from NODDI model had high diagnostic performances (AUCs = 0.820 ~ 0.942), and logistic regression model combined ISOVF, ICVF, ODI (combinedNODDI model) had the best performance (AUC=0.971), parameters from MAP model had high diagnostic performances (AUCs = 0.943 ~ 0.985), and logistic regression model combined (combinedMAP model) had the best performance (AUC=0.991) , as shown Figure 3. Between the ipsilateral and contralateral, parameters from NODDI model had moderate to high diagnostic performances, with AUCs ranging from 0.720 to 0.911, and the AUC of the best combinedNODDI model was 0.962; MAP model all had high diagnostic performances, with AUCs ranging from 0.875 to 0.961, and the AUC of the best combinedMAP model was 0.971 as shown Figure 4. Between the contralateral and HC, ISOVF had moderate diagnostic performances (AUC= 0.649), parameters from MAP model had moderate diagnostic performances, with AUCs ranging from 0.645 to 0.719, and the AUC of the best combinedMAP model was 0.742, as shown in Figure 5.Discussion
ODI highlights fiber reorganization, and ICVF represents neuron density, and RTPP reflects the presence of restrictive barriers in the axial orientation, and it can be linked to neurite loss, suggesting that hippocampus is damaged as a result. Our results showed a significant ICVF, ODI, RTPP, RTAP, RTAP reduction in the ipsilateral hippocampus to the epileptogenic focus, which confirmed this theory. Due to the loss of anisotropy of water molecules caused by the impaired fiber integrity, the ISOVF, QIV and MSD were signification increased in the ipsilateral and contralateral hippocampus with HS compared with HC.Conclusion
MAP method may be superior to NODDI in diagnosing hippocampal sclerosis in patients with temporal lobe epilepsy.Acknowledgements
No acknowledgement found.References
1. Bonilha L, Lee CY, Jensen JH, et al. Altered microstructure in temporal lobe epilepsy: a diffusional kurtosis imaging study. AJNR Am J Neuroradiol. 2015. 36(4): 719-24. 2. Lorio S, Adler S, Gunny R, et al. MRI profiling of focal cortical dysplasia using multi-compartment diffusion models. Epilepsia. 2020. 61(3): 433-444. 3. Giachetti I, Padelli F, Aquino D, et al. Role of NODDI in the MRI Characterization of Hippocampal Abnormalities in Temporal Lobe Epilepsy: Clinico-histopathologic Correlations. Neurology. 2022. 98(17): e1771-e1782. 4. Lorio S, Adler S, Gunny R, et al. MRI profiling of focal cortical dysplasia using multi-compartment diffusion models. Epilepsia. 2020. 61(3): 433-444.Figures
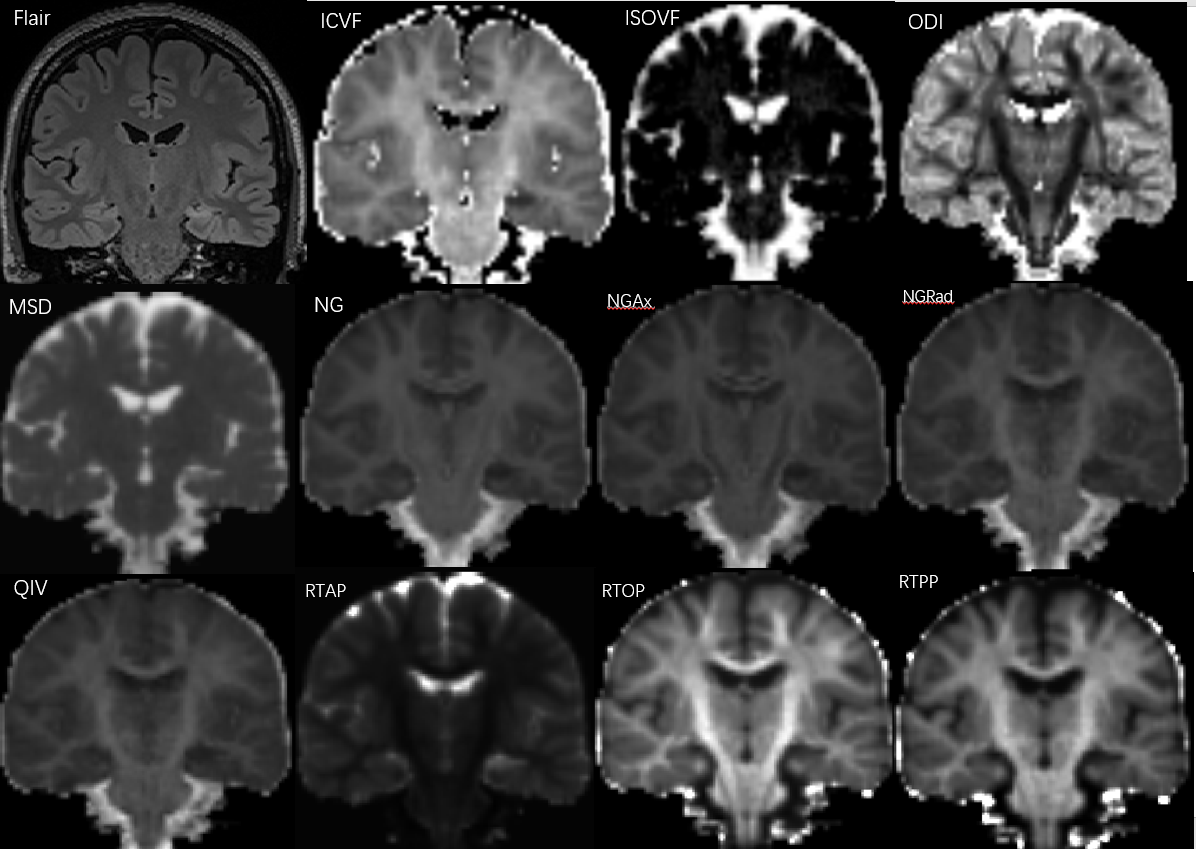
Fig.
1. Images from a 29-year-old woman with left hippocampal sclerosis.
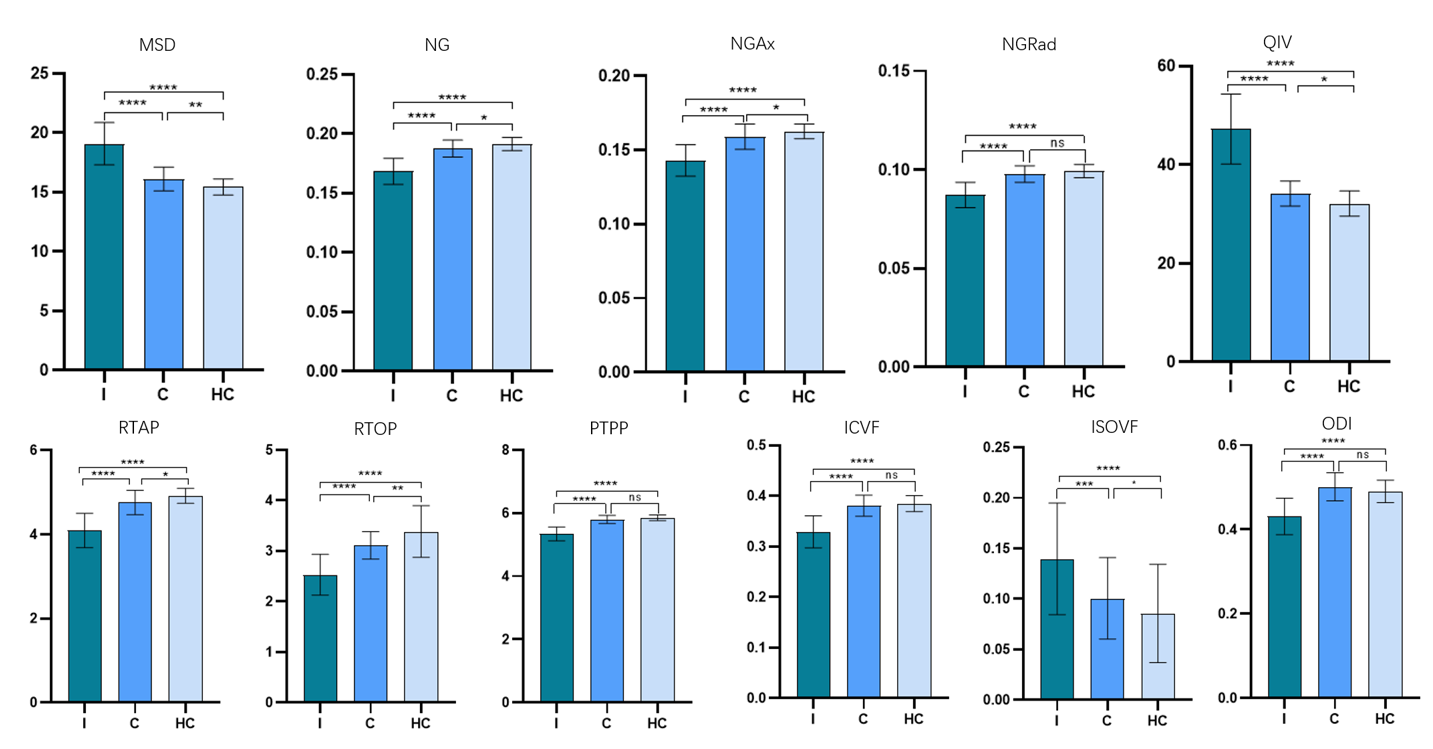
Fig 2
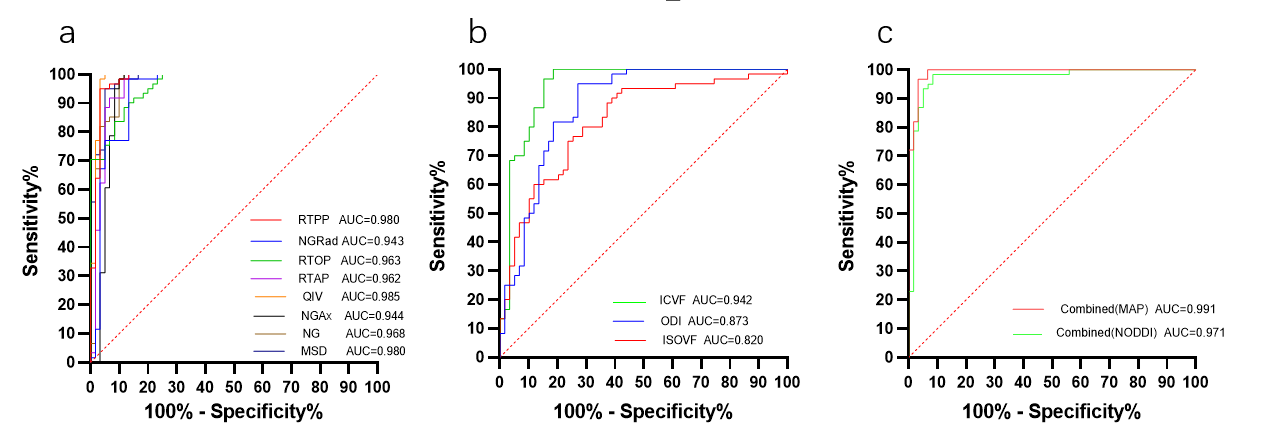
Fig. 3.
ROC curves analysis of the MAP parameter values
for distinguishing Ipsilateral
and HC(a).
ROC curves analysis of the NODDI parameter values for distinguishing Ipsilateral
and HC(b).
ROC curves analysis of the combined MAP and NODDI parameter values for
distinguishing Ipsilateral and HC(c).
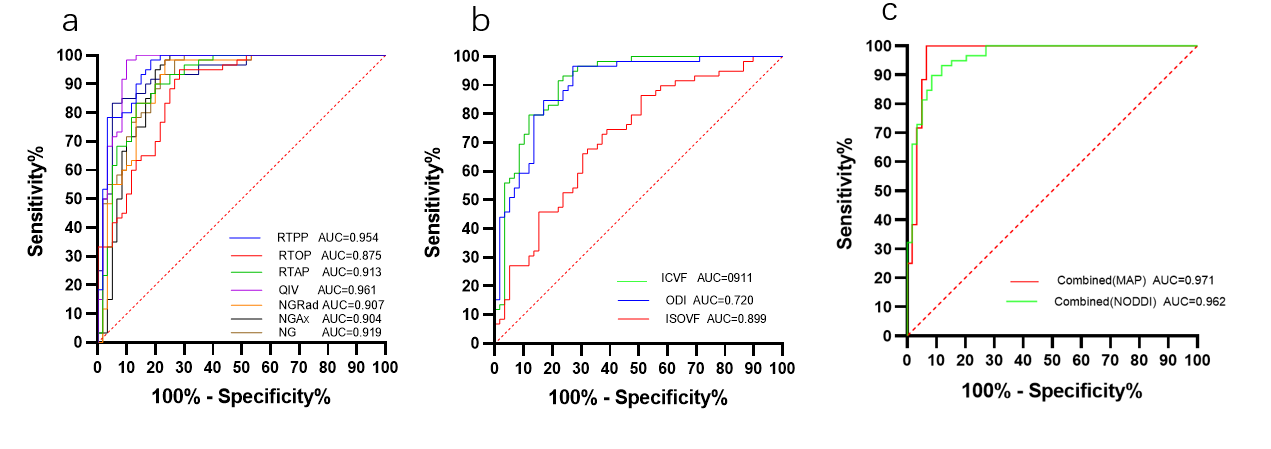
Fig. 4.
ROC curves analysis of the MAP parameter values
for distinguishing Ipsilateral and
Contralateral(a).
ROC curves analysis of the NODDI parameter values for distinguishing Ipsilateral and
Contralateral(b).
ROC curves analysis of the combined MAP and NODDI parameter values for
distinguishing Ipsilateral
and Contralateral(c).
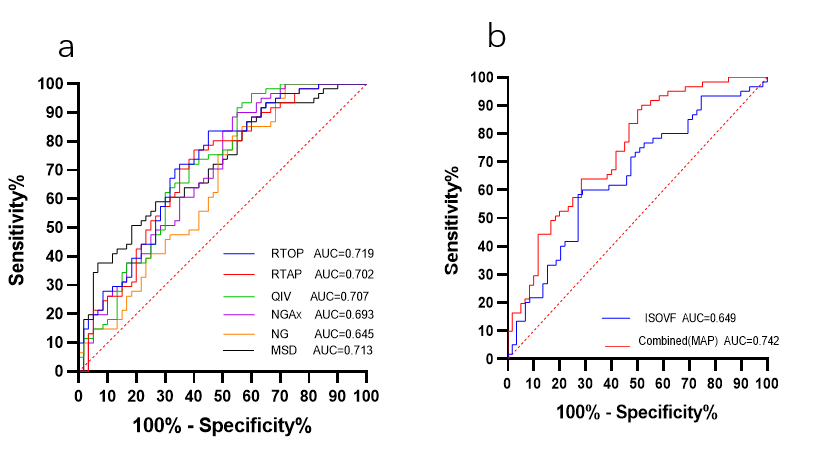
Fig. 5.
ROC curves analysis of the MAP parameter values
for distinguishing Contralateral
and HC(a).
ROC curves analysis of the combined
MAP and ISOVF parameter
values for Contralateral
and HC(b).
DOI: https://doi.org/10.58530/2023/0276