0275
Investigating the effect of thrombotic thrombocytopenic purpura on neurocognitive function using relaxation and myelin water fraction maps1Medical Biophysics, University of Western Ontario, London, ON, Canada, 2Medical Imaging, University of Western University, London, ON, Canada, 3Lawson Health Research Institute, London, ON, Canada, 4Medicine, Schulich School of Medicine & Dentistry, London, ON, Canada, 5The Lilibeth Caberto Kidney Clinical Research Unit, London, ON, Canada
Synopsis
Keywords: Quantitative Imaging, Neurodegeneration, Cognitive decline, neuroinflammation, myelin water fraction
Despite being in remission, patients with immune-mediated thrombotic thrombocytopenic purpura (iTTP) experience a variety of cognitive health problems. Quantitative MRI was used to verify the health of white matter in 19 patients. Patients had increased T1 in the cingulate cortex and increased T2 in the frontal, parietal, and temporal lobes. These regions correlate with decreased cognitive scores and depression tests taken by patients alongside the MRI scan. Increased T1 and T2 could suggest a variety of tissue pathologies but require further investigation to determine exactly what condition is affecting white matter health.
Background
Immune-mediated thrombotic thrombocytopenic purpura (iTTP) is a rare life-threatening blood disorder associated with multiple long-term health problems and decreased survival 1,2. iTTP is characterized by the inhibition of an essential enzyme, ADAMTS13 (A Disintegrin-like And Metalloprotease with Thrombospondin type 1 repeats 13), involved in regulating naturally occurring blood clots 3. The reduced activity of this enzyme allows for rapid platelet aggregation and corresponding thrombosis. Treatment options such as plasma exchange are efficient at restoring the patient to stable healthy levels 4-8. Yet, despite the improvement in mortality, many survivors of iTTP report persistent problems with memory, concentration, and depression 9-10. To investigate, a recent pilot study was conducted measuring blood-brain barrier (BBB) permeability surface (PS) product using computed tomography (CT) perfusion scans. Patients were in remission and the study spanned over 6-months. Pathological BBB permeability increases were found to persist over the 6 months despite patients being in remission 11. A possible consequence of a compromised BBB is neuroinflammation due to cytokines and immune cells diffusing into the brain parenchyma 12. Neuroinflammation contributes to the degradation of white matter and cognitive decline. Using MRI, we can quantify white matter health with a variety of contrasts and quantitative measures related to white matter integrity. In particular, quantifying myelin, an insulating layer made up of proteins and fats that wrap around neurons, is a key aspect of this study as the integrity of myelin is directly correlated with cognitive decline. The health of myelin is vital for proper neurotransmission 13, the presence of decreased myelin content in iTTP patients will better establish the link between iTTP and cognitive decline. This study aims to gain a better understanding of the pathophysiology of iTTP post remission.Methods
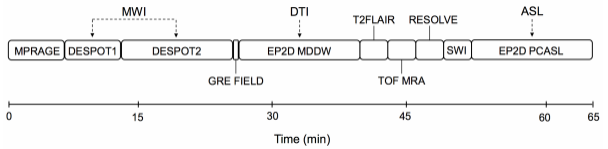
A 3T MRI scanner (Biograph mMR, Siemens Healthineers, Erlangen, Germany) with a 32-channel head-only receive coil was used to acquire MRI in 6 healthy controls and 19 TTP patients 30 days after remission. The MRI protocol consisted of qualitative sequences based on a standard-of-care stroke protocol as well as three quantitative sequences sensitive to white matter integrity and non-contrast cerebral blood flow. Qualitative standard-of-care MRI, including T1-weighted, T2-weighted, diffusion-weighted, and susceptibility-weighted images, were read by a radiologist to assess gross pathology and determine regions of interest (ROI). Multicomponent driven equilibrium single pulse observation of T1 and T2 (mcDESPOT) 14 was acquired to generate T1, T2, and myelin water fraction (MWF) maps. Diffusion tensor imaging and arterial spin labeling datasets were also acquired to be analyzed in subsequent studies. Figure 1 shows a timeline of the MRI protocol. Additional testing included a cognitive assessment from Cambridge Brain Sciences (CBS) 15 and a Montgomery-Åsberg Depression Rating Scale (MADRS) 16 depression test to correlate with MRI findings. Depression assessments were conducted prior to scanning by the accompanying nurse, cognitive testing was done privately by the patient within 24 hours of scanning.Results
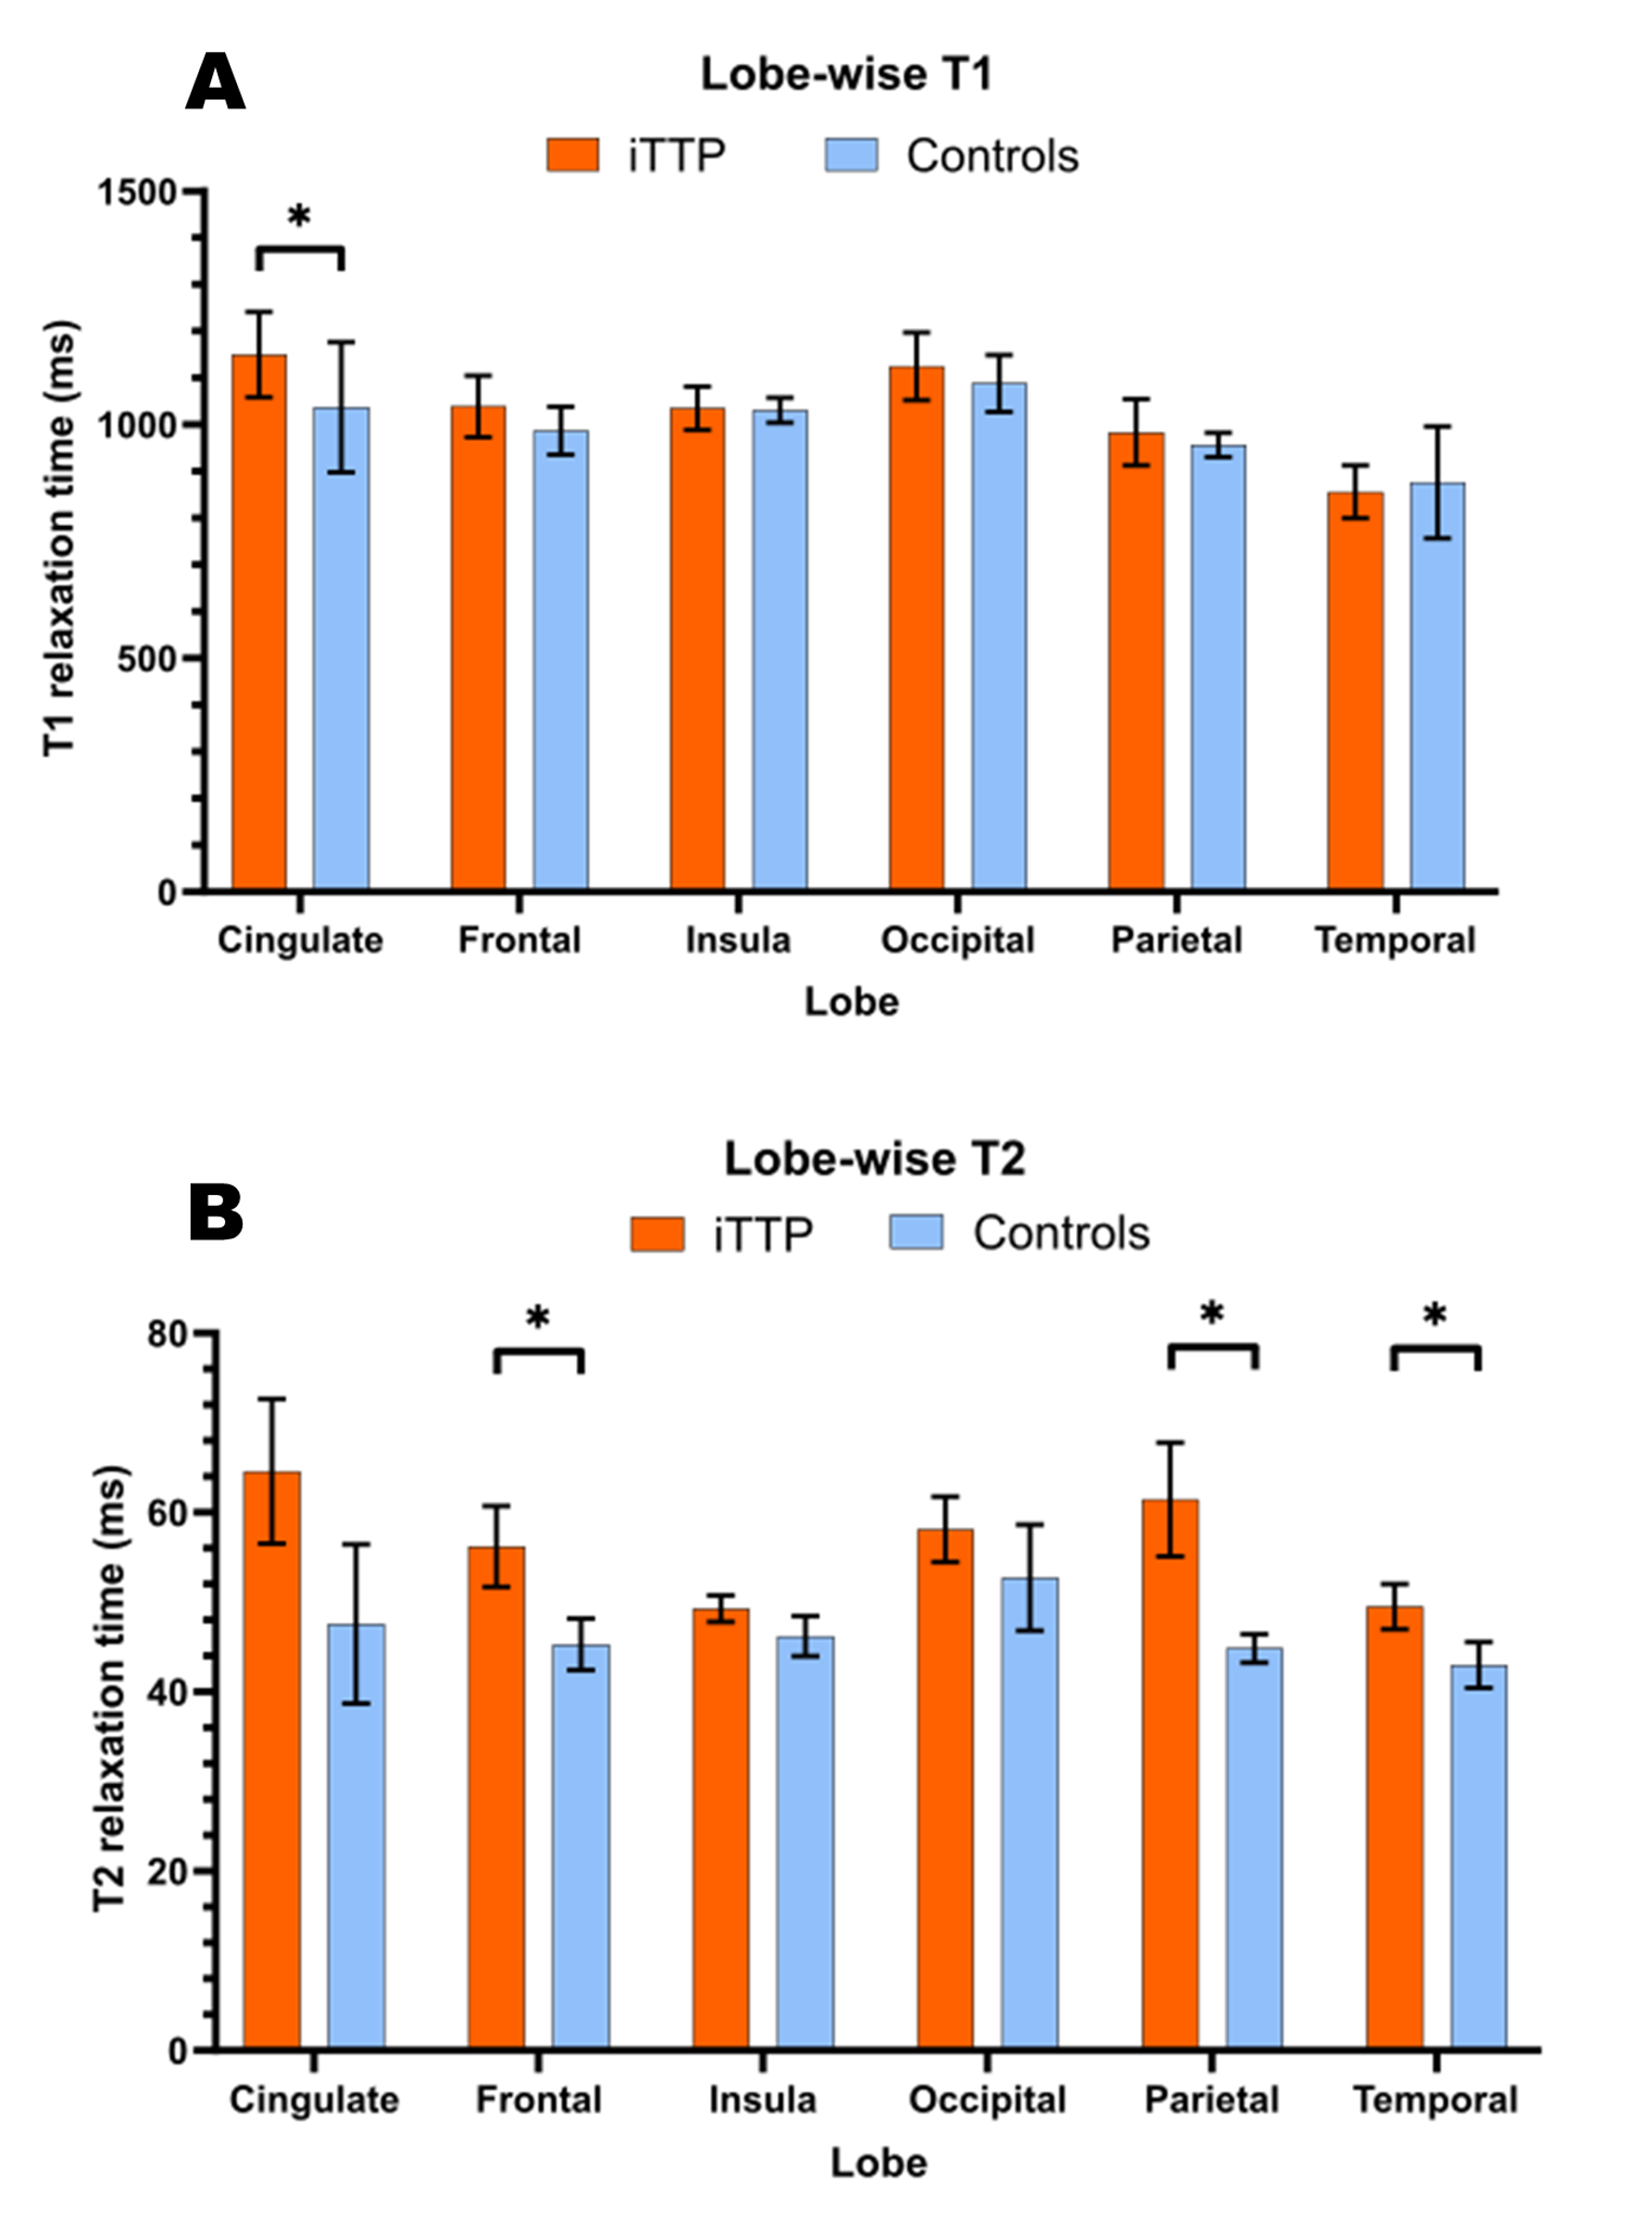
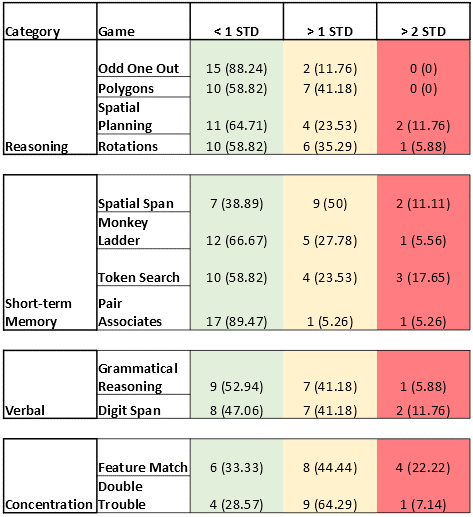
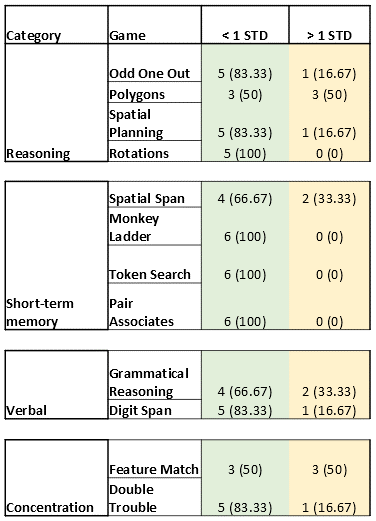
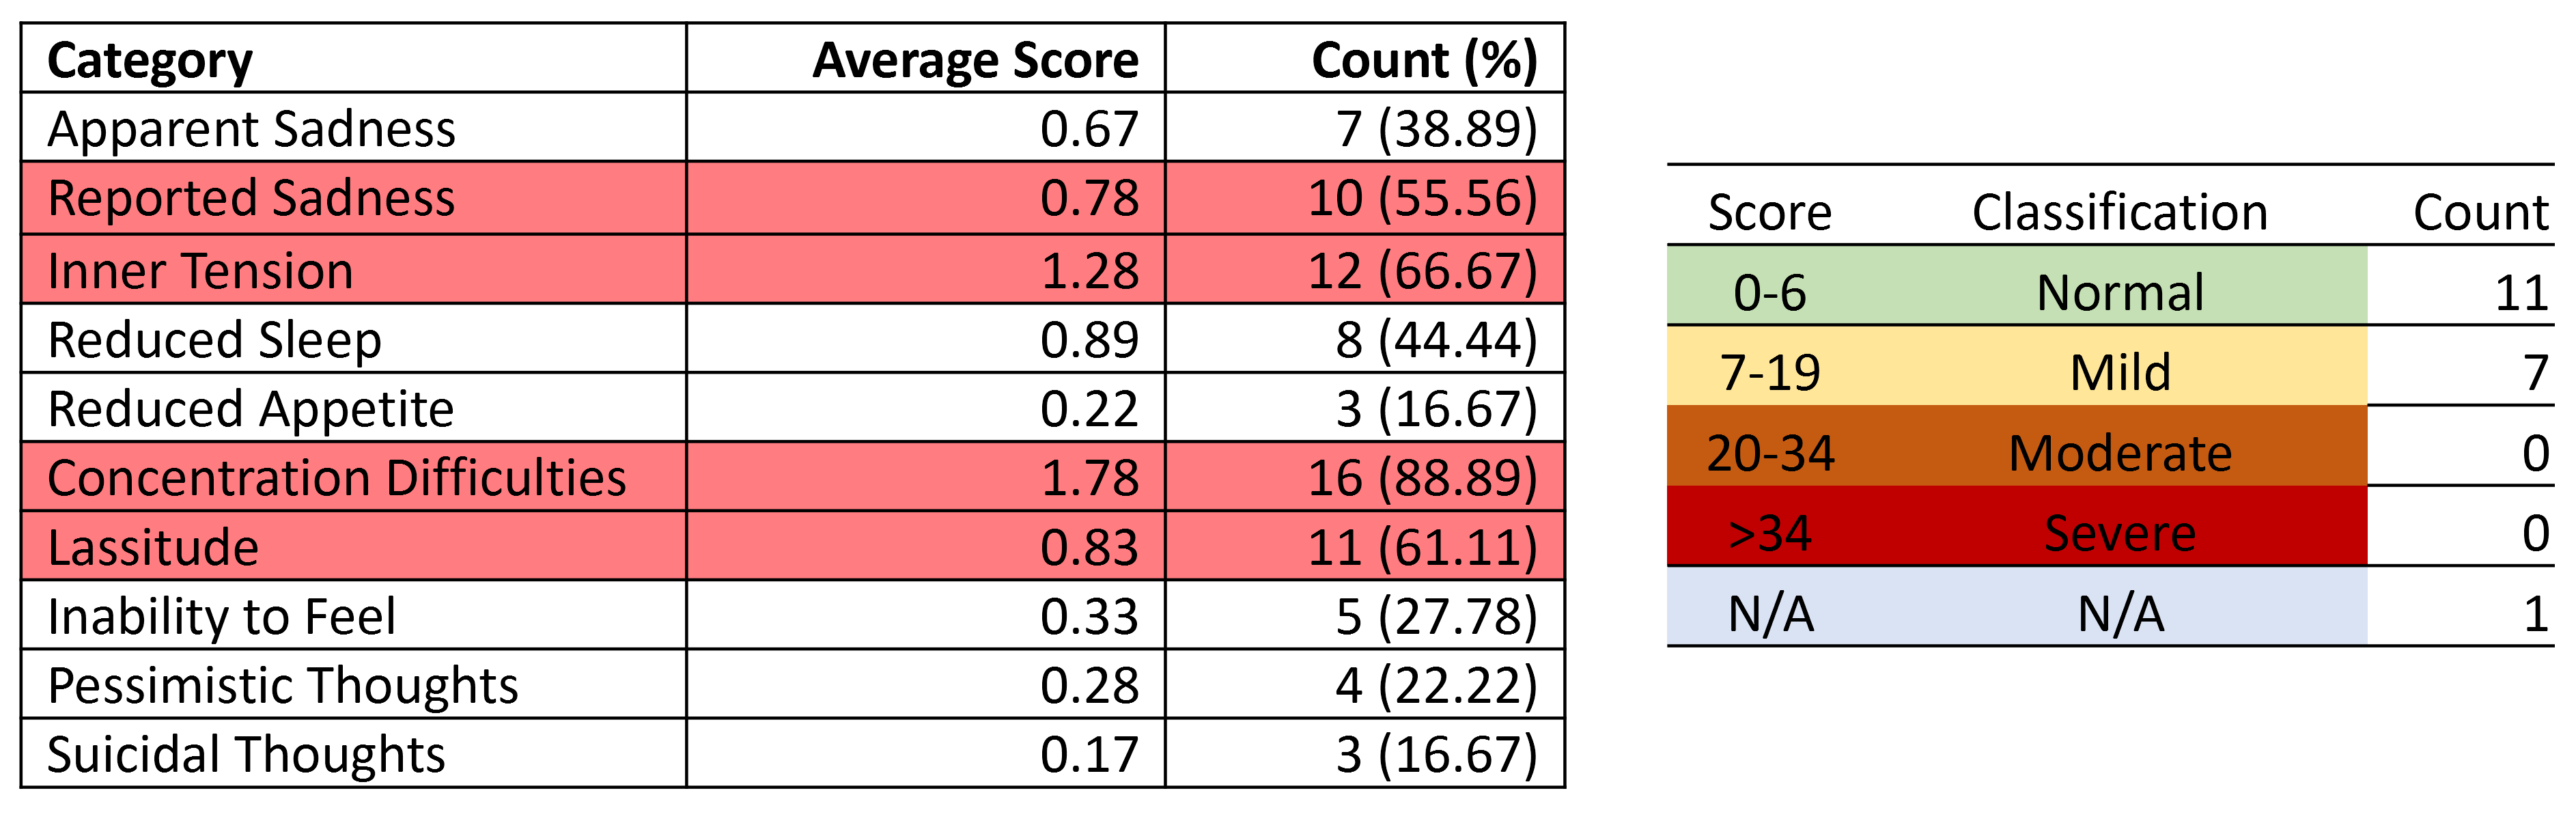
Significant T1 was found in the cingulate cortex (Figure 2A). Significant T2 was found in the following lobes: frontal, parietal, and temporal lobes (Figure 2B). No significant MWF increases/decreases were found. Decreased scores less than 1 and 2 standard deviations (STD) were found in a variety of CBS games when compared to a cohort of >10,000 age-matched, sex-matched controls provided by CBS (Figure 3). Study controls were also compared to CBS provided controls with only a few scores reported below 1 STD and no scores below 2 STD (Figure 4). From depression scores, more than 50% of patients reported a non-zero answer for concentration difficulties (89%), inner tension (67%), lassitude (61%), and reported sadness (56%). Of the 19 patients in the study, 11 showed no signs of depression, 7 showed mild symptoms, and 1 patient did not take the test (Figure 5).Discussion
Multiple regions in the brain have significantly increased T2 relaxation time while the cingulate cortex had a significantly increased T1 relaxation time. T1 and T2 depend on a variety of microstructural properties such as local tissue density, fluid content, myelination, proteins, fat, etc. 17-19. Therefore, pathologies that alter the structure and biochemistry of tissue would result in a change in T1 and T2. In particular, an increase in T1 and T2 can be indicative of either neuroinflammation 20, white matter edema 21, axonal loss or early signs of demyelination 22. Each of these pathologies can play a role in impacting neurocognitive function which could be associated with decreased cognitive scores across all 4 testing categories. Relaxometry results will be complemented by additional techniques (e.g., diffusion tensor imaging) and provide further evidence in determining what increased T1 and T2 represent in patients with iTTP.Conclusion
Evidence of mild cognitive decline was found in iTTP patients 30 days post remission. These findings pertain mainly to concentration difficulties and short-term memory which correlated to increased T1 and T2 in lobes associated with these functions. The etiology of these findings could not be verified and thus needs to be expanded upon. Neuroinflammation is one possible cause, but further investigation is needed.Acknowledgements
I would like to acknowledge my research coordinator Kerri Gallo, and MR technologist John Butler and Heather Biernaski for their support on this project. Dr. Christopher Patriquin from the University Health Network and Dr. Katerina Pavenski from St. Michaels Hospital for contributing patients to this study. And the following sources of funding: Answering T.T.P, PSI foundation, Lawson Health Research Institute, and NSERC.
References
1. Levandovsky, Mark, et al. "Thrombotic thrombocytopenic purpura-hemolytic uremic syndrome (TTP-HUS): a 24-year clinical experience with 178 patients." Journal of hematology & oncology 1.1 (2008): 1-8.
2. George, James N. “TTP: long-term outcomes following recovery.” Hematology. American Society of Hematology. Education Program vol. 2018,1 (2018): 548-552.
3. Lancellotti, Stefano et al. “Proteolytic processing of von Willebrand factor by adamts13 and leukocyte proteases.” Mediterranean journal of hematology and infectious diseases vol. 5,1e2013058. 2 Sep. 2013
4. Rock, Gail A., et al. "Comparison of plasma exchange with plasma infusion in the treatment of thrombotic thrombocytopenic purpura." New England Journal of Medicine 325.6 (1991): 393-397.
5. Scully, Marie, et al. "Guidelines on the diagnosis and management of thrombotic thrombocytopenic purpura and other thrombotic microangiopathies." British journal of haematology 158.3 (2012): 323-335.
6. Sayani, Farzana A., and Charles S. Abrams. "How I treat refractory thrombotic thrombocytopenic purpura." Blood, The Journal of the American Society of Hematology 125.25 (2015): 3860-3867.
7. Allan, David S., Michael J. Kovacs, and William F. Clark. "Frequently relapsing thrombotic thrombocytopenic purpura treated with cytotoxic immunosuppressive therapy." Haematologica 86.8 (2001): 844-850.
8. Böhm, Martina, et al. "The course of ADAMTS‐13 activity and inhibitor titre in the treatment of thrombotic thrombocytopenic purpura with plasma exchange and vincristine." British journal of haematology 129.5 (2005): 644-652.
9. Deford, Cassandra C., et al. "Multiple major morbidities and increased mortality during long-term follow-up after recovery from thrombotic thrombocytopenic purpura." Blood, The Journal of the American Society of Hematology 122.12 (2013): 2023-2029.
10. Falter, Tanja, et al. "Depression and cognitive deficits as long‐term consequences of thrombotic thrombocytopenic purpura." Transfusion 57.5 (2017): 1152-1162.
11. Huang, Shih-Han Susan, et al. "Blood–brain barrier permeability in survivors of immune-mediated thrombotic thrombocytopenic purpura: a pilot study." Blood Advances 5.20 (2021): 4211-4218.
12. Varatharaj, Aravinthan, and Ian Galea. "The blood-brain barrier in systemic inflammation." Brain, behavior, and immunity 60 (2017): 1-12.
13. Bouhrara, Mustapha, et al. "Evidence of demyelination in mild cognitive impairment and dementia using a direct and specific magnetic resonance imaging measure of myelin content." Alzheimer's & Dementia 14.8 (2018): 998-1004
14. Deoni, Sean CL, et al. "Gleaning multicomponent T1 and T2 information from steady‐state imaging data." Magnetic Resonance in Medicine: An Official Journal of the International Society for Magnetic Resonance in Medicine 60.6 (2008): 1372-1387
15. Hampshire, Adam, et al. "Fractionating human intelligence." Neuron 76.6 (2012): 1225-1237
16. Montgomery, Stuart A., and M. A. R. I. E. Åsberg. "A new depression scale designed to be sensitive to change." The British journal of psychiatry 134.4 (1979): 382-389.
17. Fatouros, Panos P., et al. "In vivo brain water determination by T1 measurements: effect of total water content, hydration fraction, and field strength." Magnetic resonance in medicine 17.2 (1991): 402-413.
18. Lutti, Antoine, et al. "Using high-resolution quantitative mapping of R1 as an index of cortical myelination." Neuroimage 93 (2014): 176-188.
19. Deoni, Sean CL. "Quantitative relaxometry of the brain." Topics in magnetic resonance imaging 21.2 (2010): 101-113.
20. Stanisz, Greg J., et al. "MR properties of excised neural tissue following experimentally induced inflammation." Magnetic Resonance in Medicine: An Official Journal of the International Society for Magnetic Resonance in Medicine 51.3 (2004): 473-479.
21. Kleine, Lawrence J., et al. "In vivo characterization of cytotoxic intracellular edema by multicomponent analysis of transverse magnetization decay curves." Academic radiology 2.5 (1995): 365-372.
22. Odrobina EE, Lam TYJ, Pun TWC, Midha R, Stanisz GJ. MR propertiesof excised neural tissue following experimentally induced demyelina-tion. NMR in Biomed 2005; in press.
Figures