0274
A normative cortical T1 atlas for single-subject pathology detection at 7T1Advanced Clinical Imaging Technology, Siemens Healthineers International AG, Lausanne, Switzerland, 2Department of Radiology, Lausanne University Hospital and University of Lausanne, Lausanne, Switzerland, 3LTS5, École Polytechnique Fédérale de Lausanne (EPFL), Lausanne, Switzerland, 4Advanced Clinical Imaging Technology, Siemens Healthineers International AG, Bern, Switzerland, 5Translational Imaging Center (TIC), Swiss institute for Translational and Entrepreneurial Medicine, Bern, Switzerland, 6Magnetic Resonance Methodology, Institute of Diagnostic and Interventional Neuroradiology, University of Bern, Bern, Switzerland, 7Department of Neurology, University Hospital Bern, Inselspital, University of Bern, Bern, Switzerland, 8Support Center for Advanced Neuroimaging, Institute for Diagnostic and Interventional Neuroradiology, Inselspital, University of Bern, Bern, Switzerland, 9Human Neuroscience Platform, Fondation Campus Biotech Geneva, Geneva, Switzerland, 10CIBM-AIT, École Polytechnique Fédérale de Lausanne (EPFL), Lausanne, Switzerland
Synopsis
Keywords: Quantitative Imaging, Data Processing, Brain cortex
Quantitative MRI allows establishing normative atlases of relaxometry parameters which enable single-subject comparisons for anomaly detection. The large anatomical inter-subject variability of the brain cortex and its convoluted shape, however, complicate such comparison in this region. In this study, a method to align inter-subject brain cortices is proposed and a voxel-wise normative T1 atlas in the cortex is built from a cohort of 133 healthy subjects scanned at 7T. The atlas is used to detect and characterize T1 alterations in two multiple sclerosis patients on a single-subject basis.Introduction
The potential of quantitative MRI (qMRI) to establish normative atlases that enable single-subject comparisons to detect subtle brain tissue abnormalities has been recently shown for white matter (WM)1-5. The extension of this method to cortical gray matter (GM) would allow a more comprehensive characterization of brain diseases that affect this region. However, given the large inter-subject anatomical variability of the cortex and its highly convoluted shape, mapping cortical locations across subjects is challenging. Using spherical representation of the cortex6, a cortical T1 atlas was recently established at 3T7. Generally, high resolution (<$$$\,$$$1$$$\,$$$mm3) images are beneficial to properly characterize cortical GM due to its thin, layered structure.In this study, a normative atlas of cortical T1 values at 7T is established from MP2RAGE scans8,9. As a proof of concept, the atlas is used to detect pathology-induced T1 alterations in two multiple sclerosis patients.
Methods
Population and MR acquisitionA healthy cohort of 133 subjects (74 females, median age$$$\,$$$=$$$\,$$$28$$$\,$$$y/o, range$$$\,$$$=$$$\,$$$[15-74]$$$\,$$$y/o) and two patients (29 and 37$$$\,$$$y/o, males) with relapsing-remitting multiple sclerosis (RRMS) were scanned at 7T (MAGNETOM Terra, Siemens Healthcare, Erlangen, Germany). T1-weighted images and T1 maps were acquired simultaneously using a MP2RAGE research application sequence8,9 (resolution$$$\,$$$=$$$\,$$$0.6$$$\times$$$0.6$$$\times$$$0.6$$$\,$$$mm3, FOV$$$\,$$$=$$$\,$$$240$$$\times$$$240$$$\times$$$172$$$\,$$$mm3, TI1/TI2$$$\,$$$=$$$\,$$$800$$$\,$$$ms$$$\,$$$/$$$\,$$$2700$$$\,$$$ms, TR$$$\,$$$=$$$\,$$$6s, undersampling:$$$\,$$$CSx4, TA$$$\,$$$=$$$\,$$$7:49$$$\,$$$min). All scans were performed using a 1-channel TX/32-channel RX head coil (Nova Medical, Wilmington, MA).
Brain cortical alignment
The total intracranial volume (TIV) was extracted using the MorphoBox research application on the MP2RAGE T1-weighted uniform (“UNI”) contrast10,11. The resulting TIV mask was used to strip the skull in T1 maps.
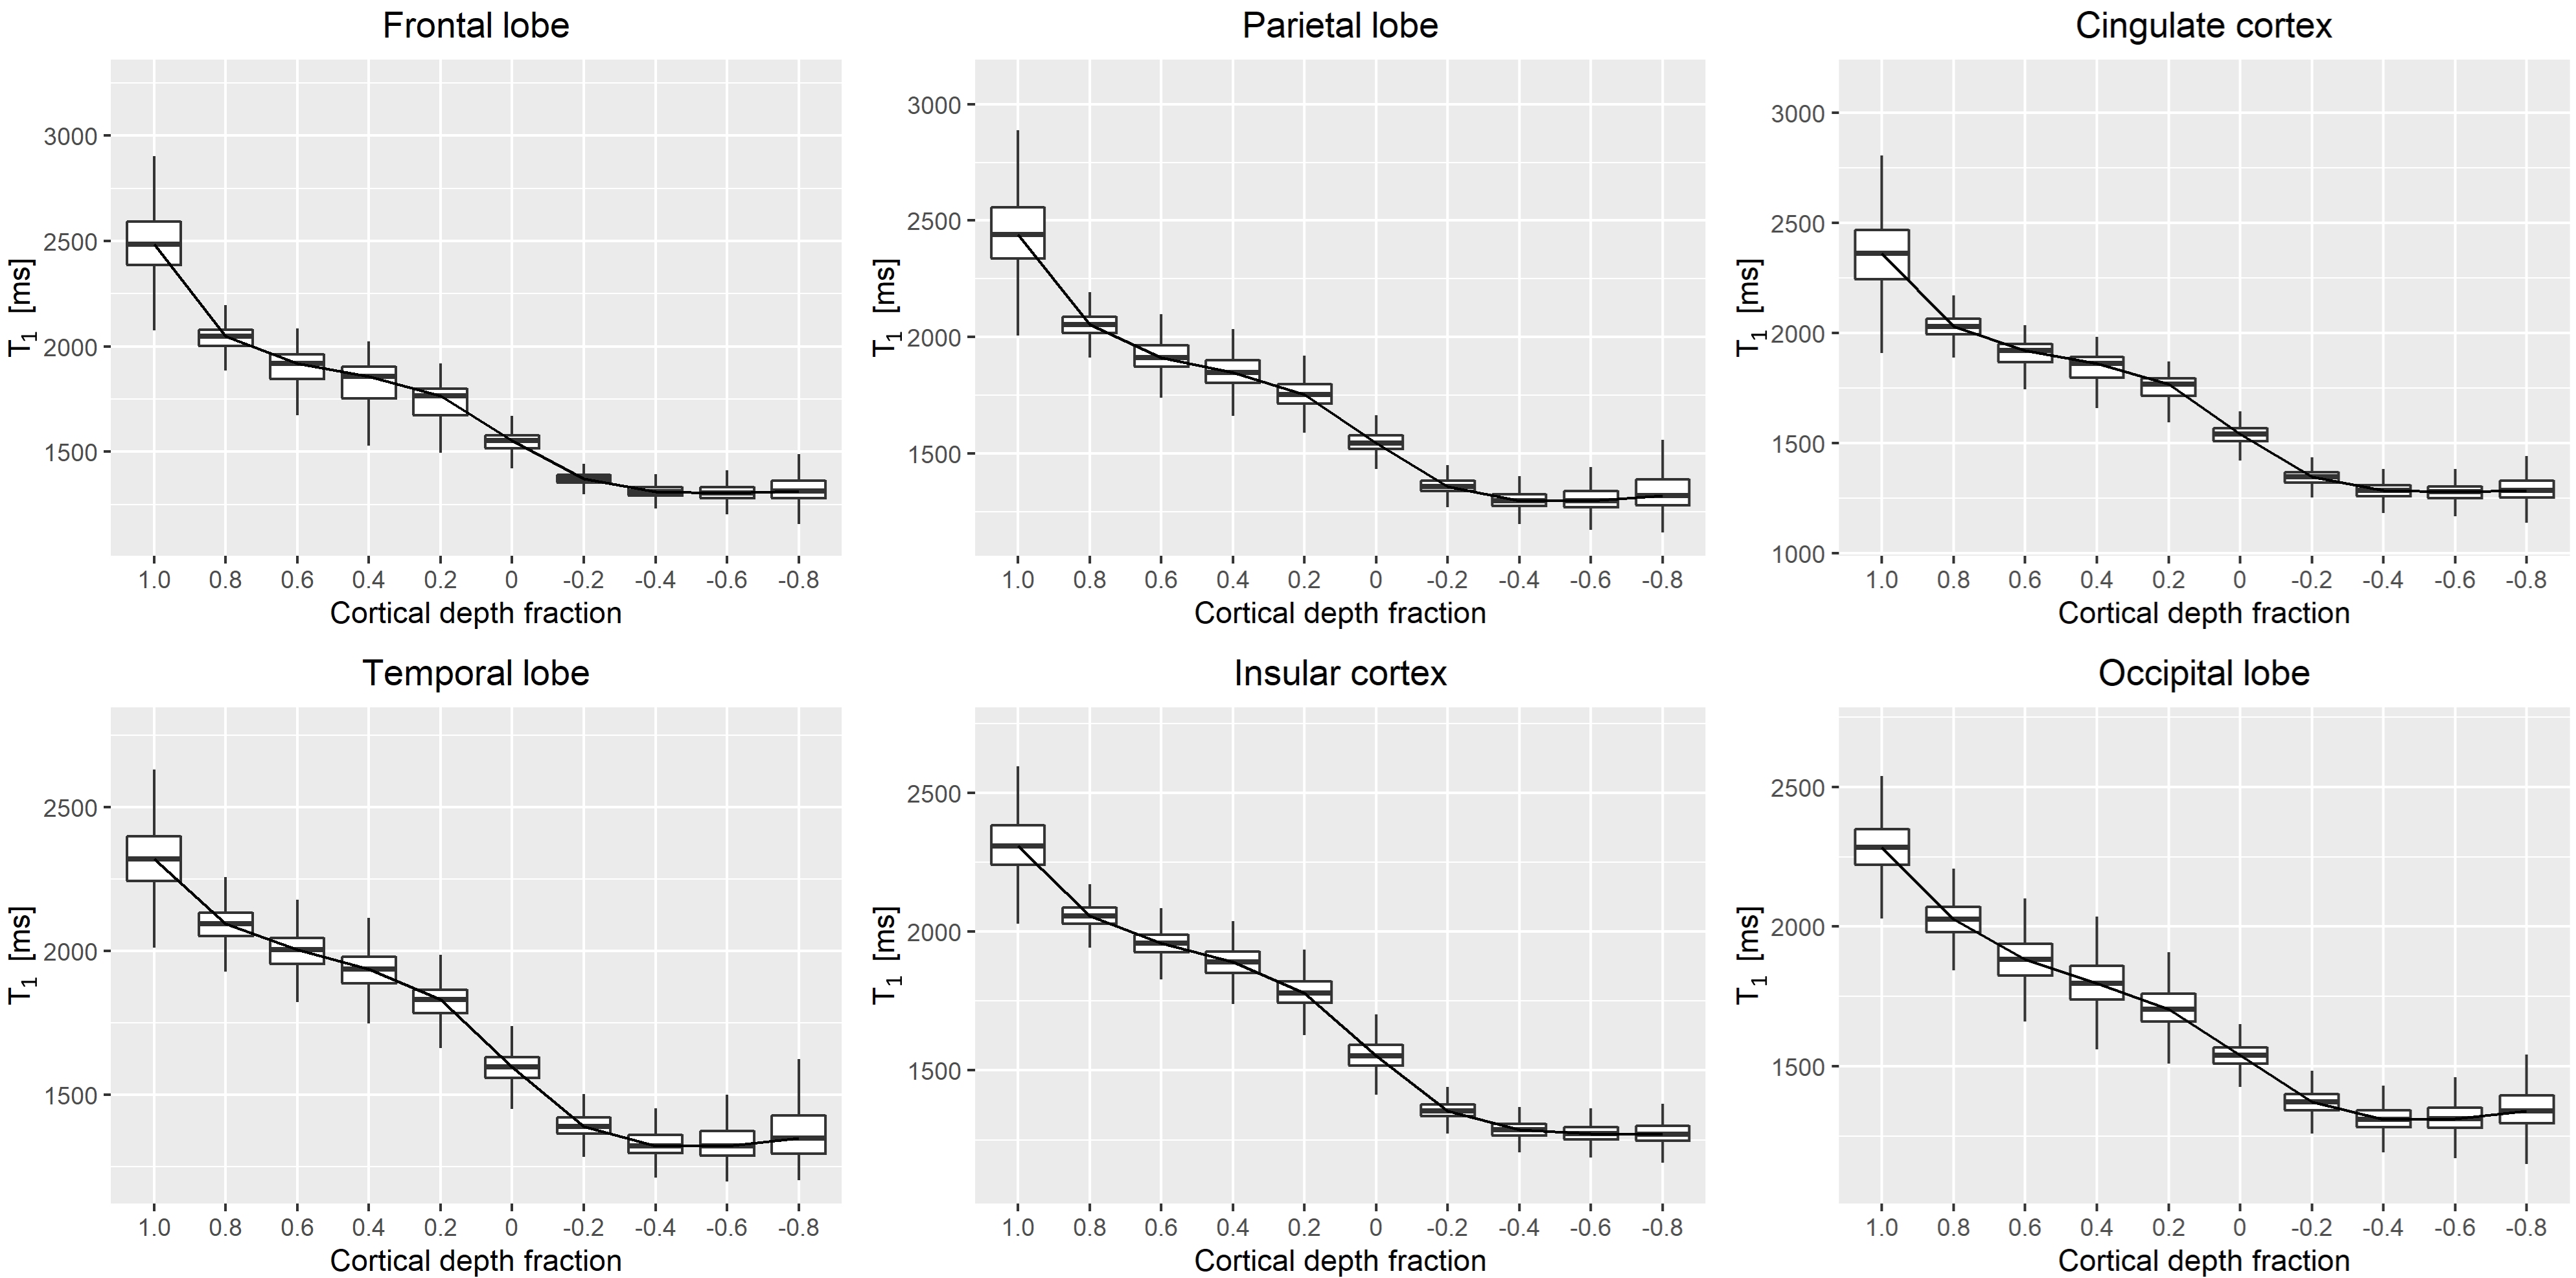
The FreeSurfer segmentation and brain surface reconstruction pipeline12 was used to align the brain cortices of each healthy subject to subsequently build a voxel-wise normative T1 atlas. To that end, the skull-stripped UNI volumes were registered to the 1$$$\,$$$mm isotropic FreeSurfer MNI305 template (“fsaverage”) with a surface-based method6, and the same transformation was applied to the skull-stripped T1 maps. The interfaces between GM and cortical cerebrospinal fluid (“pial surface”) and between WM and GM (“white surface”) were extracted as surfaces in the fsaverage space. To extract T1 values in the whole cortical GM, the white surface was projected along its normal vectors towards the pial surface using specific distances to reach different cortical depths. T1 values were extracted at six equally spaced cortical depth fractions, between and including the white (0.0) and pial (1.0) surfaces, and four equidistant juxtacortical layers (hereafter reported as negative cortical depth fractions), obtained by projecting the white surface in the opposite direction.
Normative atlas and single-subject comparison
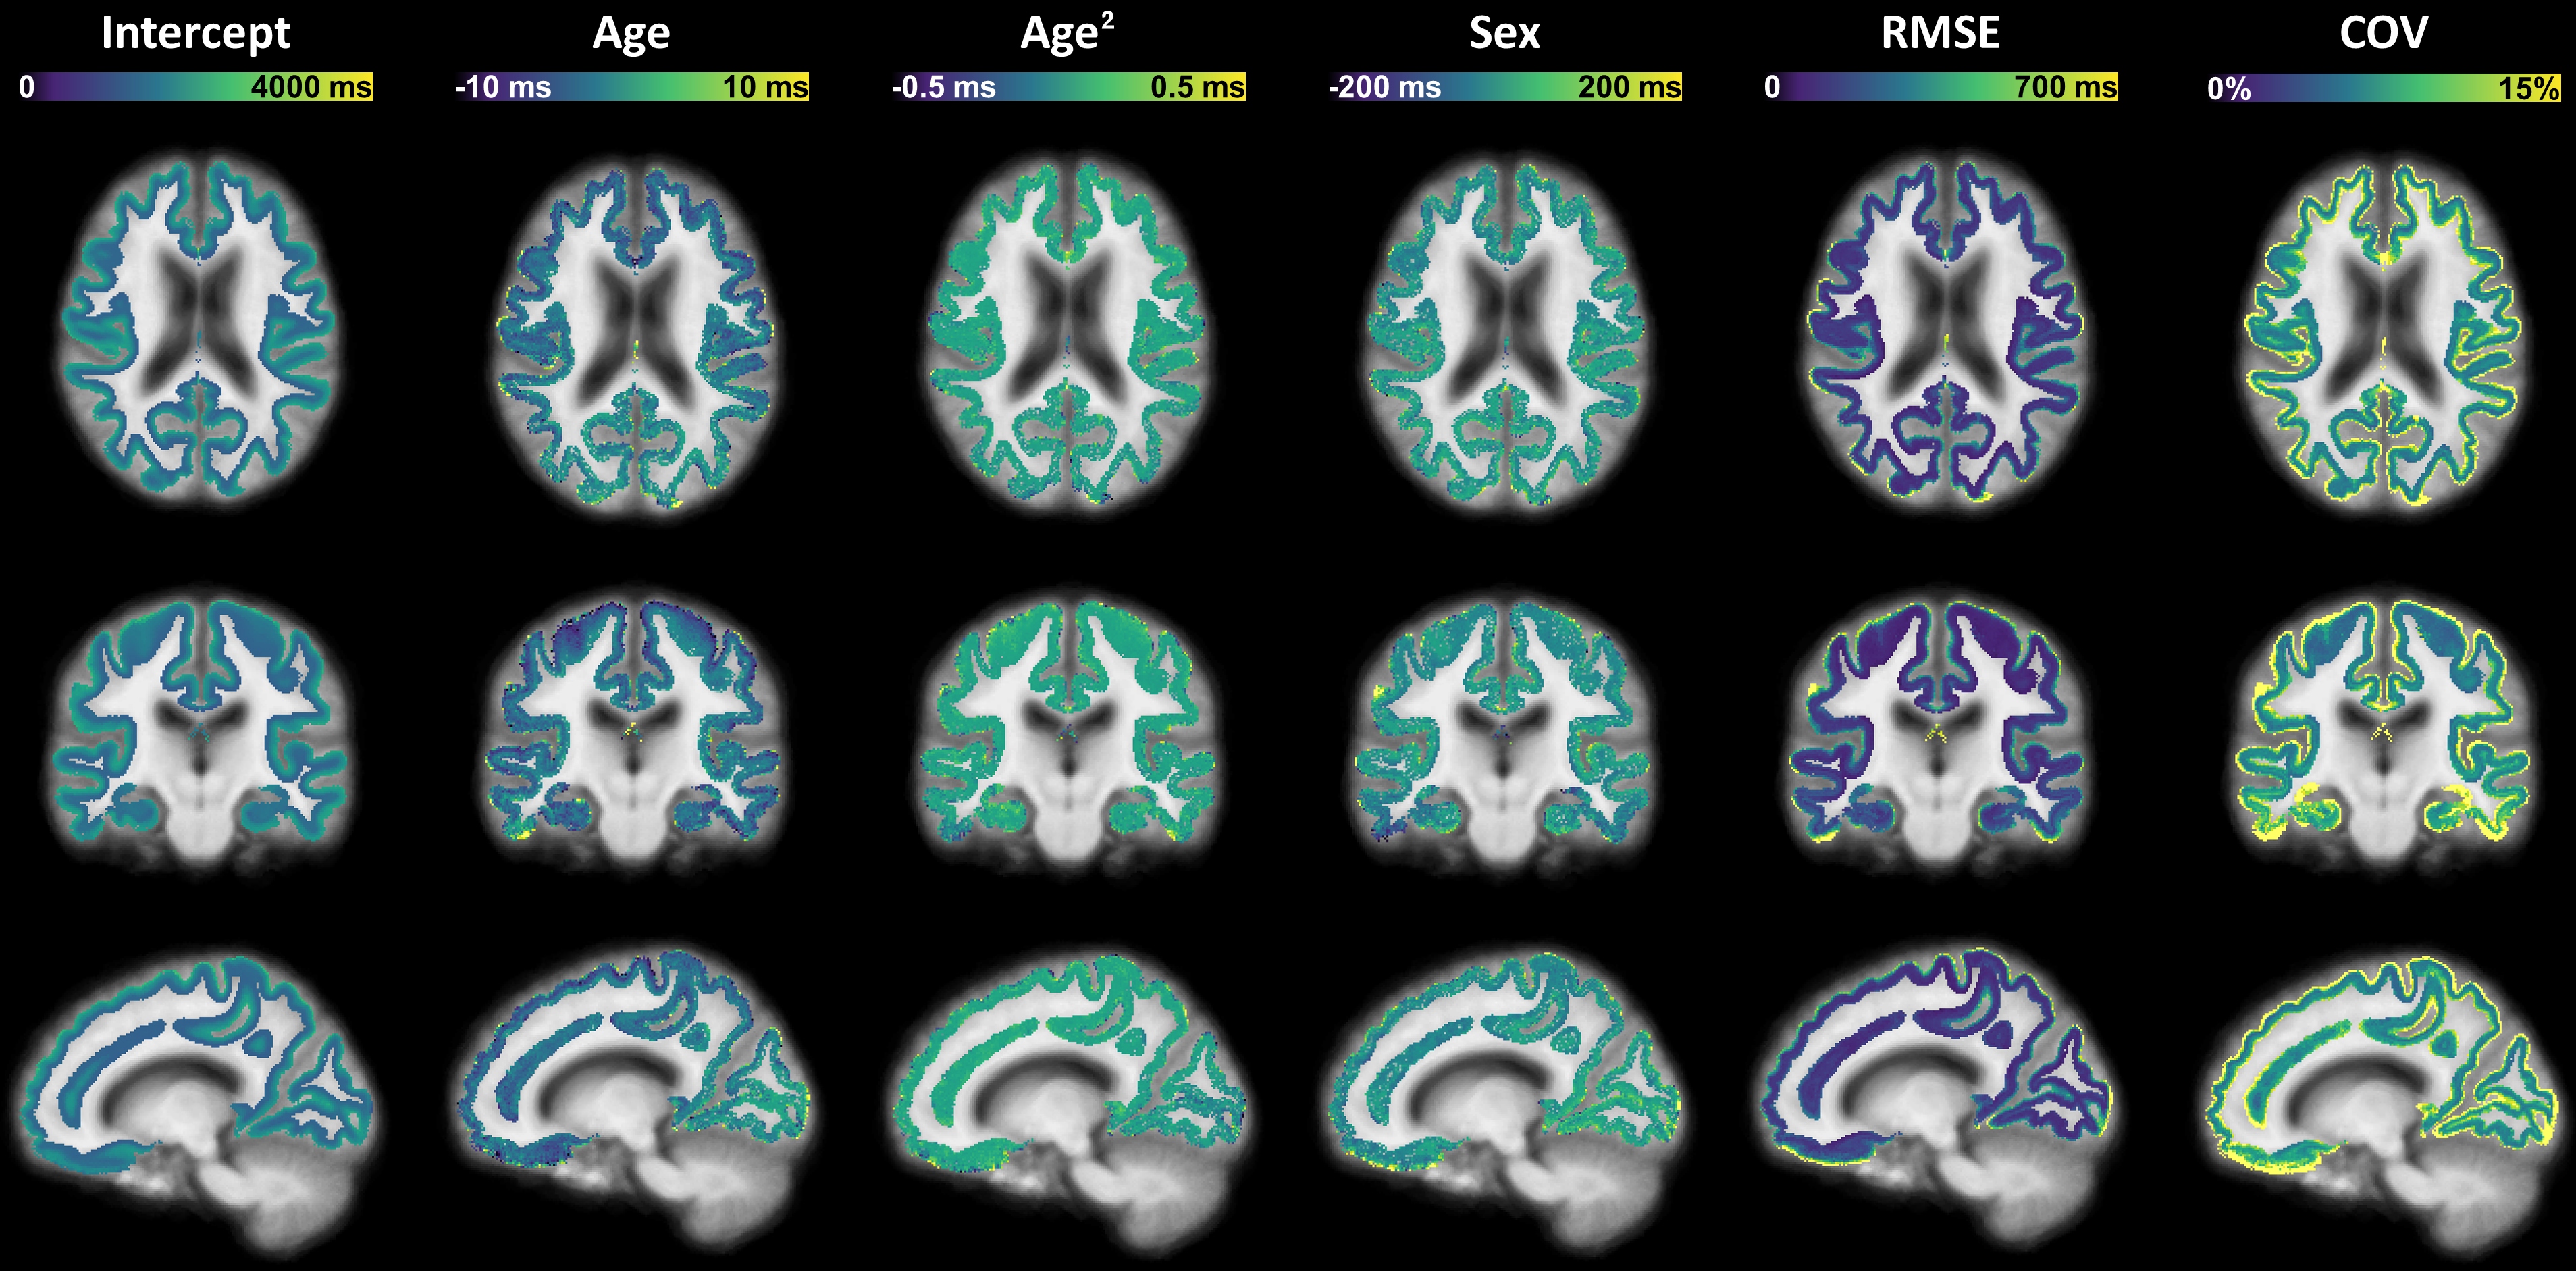
A voxel-wise normative atlas for cortical and juxtacortical T1 values was computed by modeling the expected T1 in the fsaverage space as:$$E\{T_1\}=\beta_0+\beta_{sex}\cdot\,sex+\beta_{age}\cdot\,age+\beta_{age^2}\cdot\,age^2\,\textrm{,}\,\,\,\,\,\,\,\,\,\,\,\,\,\,\,\,\,\,\,\,\,\,\,\,\,\,\,\,\,\,(1)$$where $$$\beta_0$$$ is the model intercept, and sex$$$\,$$$=$$$\,$$$1 if the subject is male, 0 if female. Age was centered at the average age of the healthy cohort (33$$$\,$$$y/o), and $$$\beta_{age^2}$$$ was introduced to consider the quadratic evolution of T1 with age13.
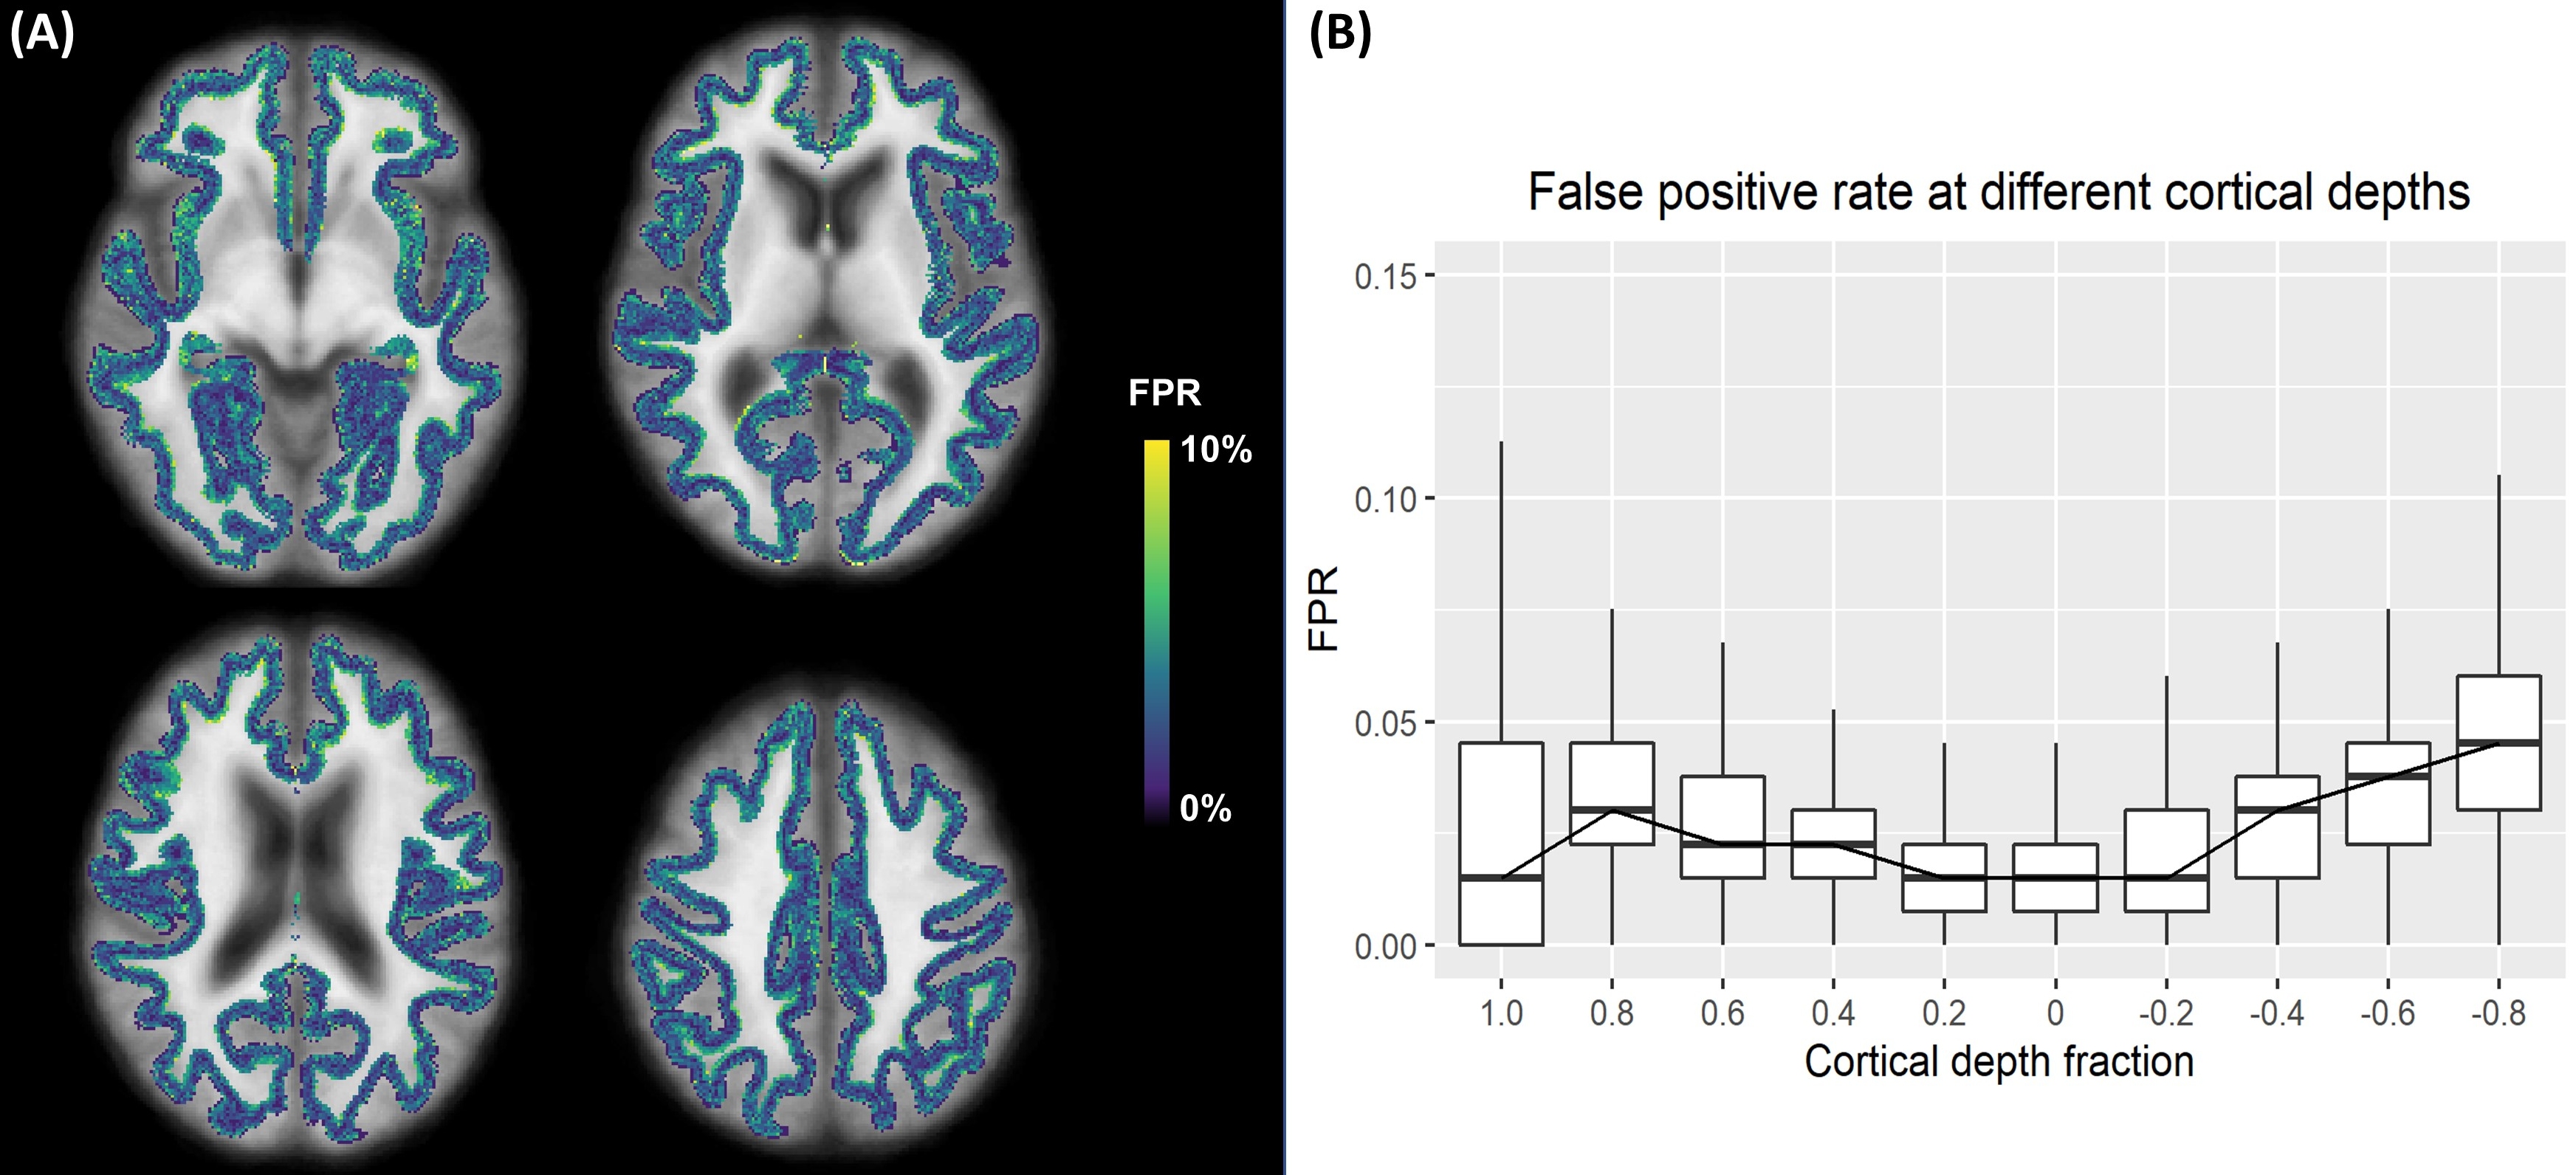
To detect abnormal T1 values on a single-subject basis, deviation from normative ranges of measured T1 was assessed at each voxel by z-scores:$$z_{T_1}=(T_1-E\{T_1\})/RMSE\,\textrm{,}\,\,\,\,\,\,\,\,\,\,\,\,\,\,\,\,\,\,\,\,\,\,\,\,\,\,\,\,\,\,(2)$$with the root mean square error (RMSE) being an estimation of the standard deviation of the residual errors across the linear model of Eq. 1. To evaluate the robustness of the proposed method with respect to false positives, T1 z-scores were calculated within the healthy cohort with a 10-fold cross-validation to yield the false positive rate (FPR) for each voxel by considering |zT1|$$$\,$$$>$$$\,$$$2 as abnormal3. Additionally, to demonstrate the potential of the proposed framework for automatic detection of potentially abnormal tissue, z-scores were computed for two patient datasets at each cortical depth, resampled to the patients’ native space and concatenated into a deviation map.
Results
Representative slices of the established cortical T1 atlas are shown in Figure$$$\,$$$1. T1 values were found to decrease from the pial surface to the juxtacortical WM, in accordance with previous findings14 (Figure$$$\,$$$2). As an example, average T1 values at cortical depth fractions 0.4 and -0.4 were found to be E{T1}$$$\,$$$±$$$\,$$$RMSE$$$\,$$$=$$$\,$$$1865$$$\,$$$±$$$\,$$$131$$$\,$$$ms, and 1330$$$\,$$$±$$$\,$$$108$$$\,$$$ms, respectively. Highest variability (median COV$$$\,$$$>$$$\,$$$10%) was found at the atlas boundaries, i.e., at cortical depth fractions 1.0 and -0.8 (Figures 1$$$\,$$$-$$$\,$$$2).FPR was found to be comparable across cortical depths (Figure$$$\,$$$3). Overall FPR values were: median$$$\,$$$=$$$\,$$$2.25$$$\,$$$%, range$$$\,$$$=$$$\,$$$[0-24.81]$$$\,$$$%.
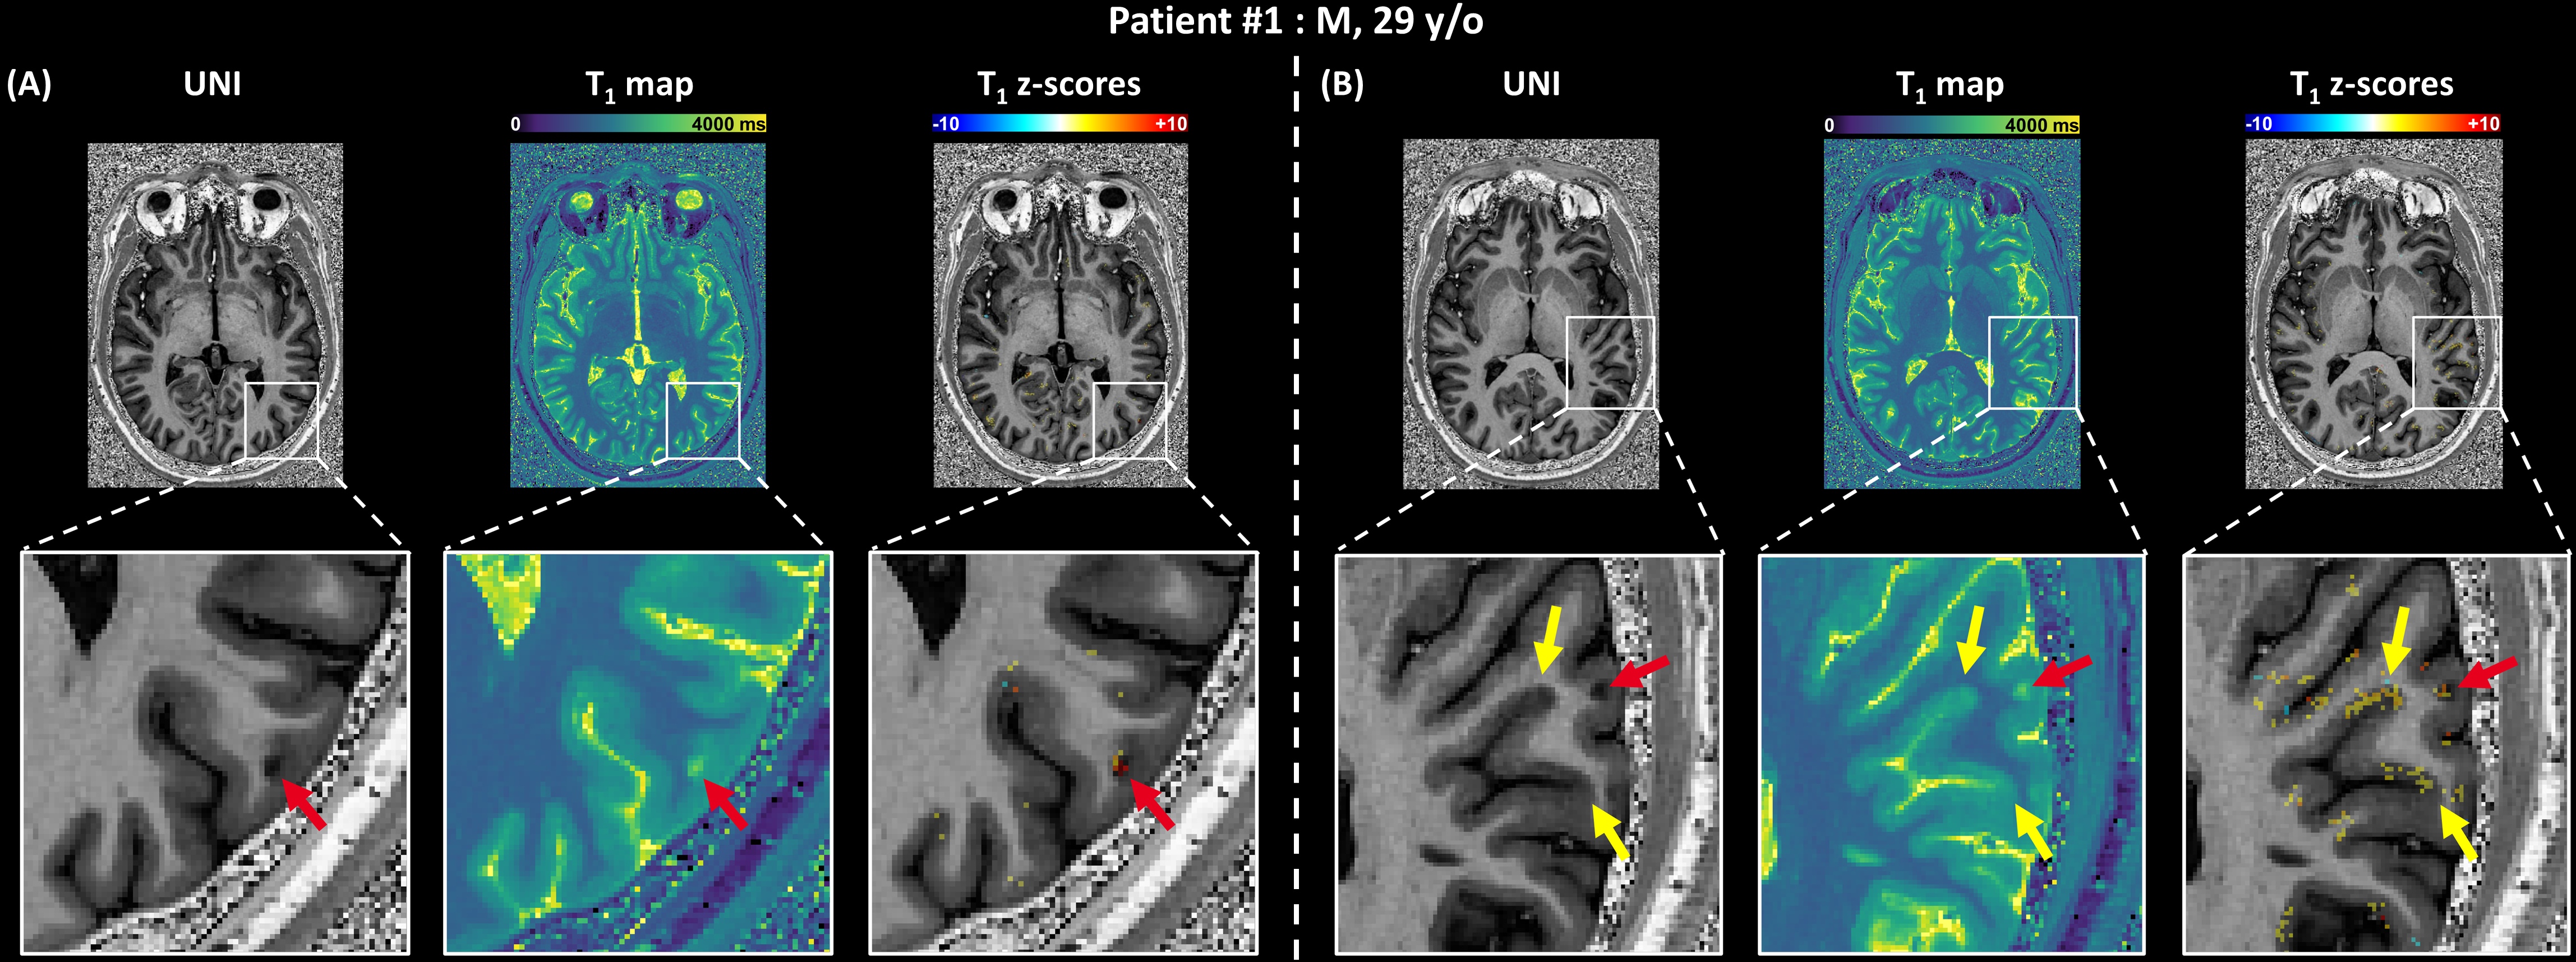
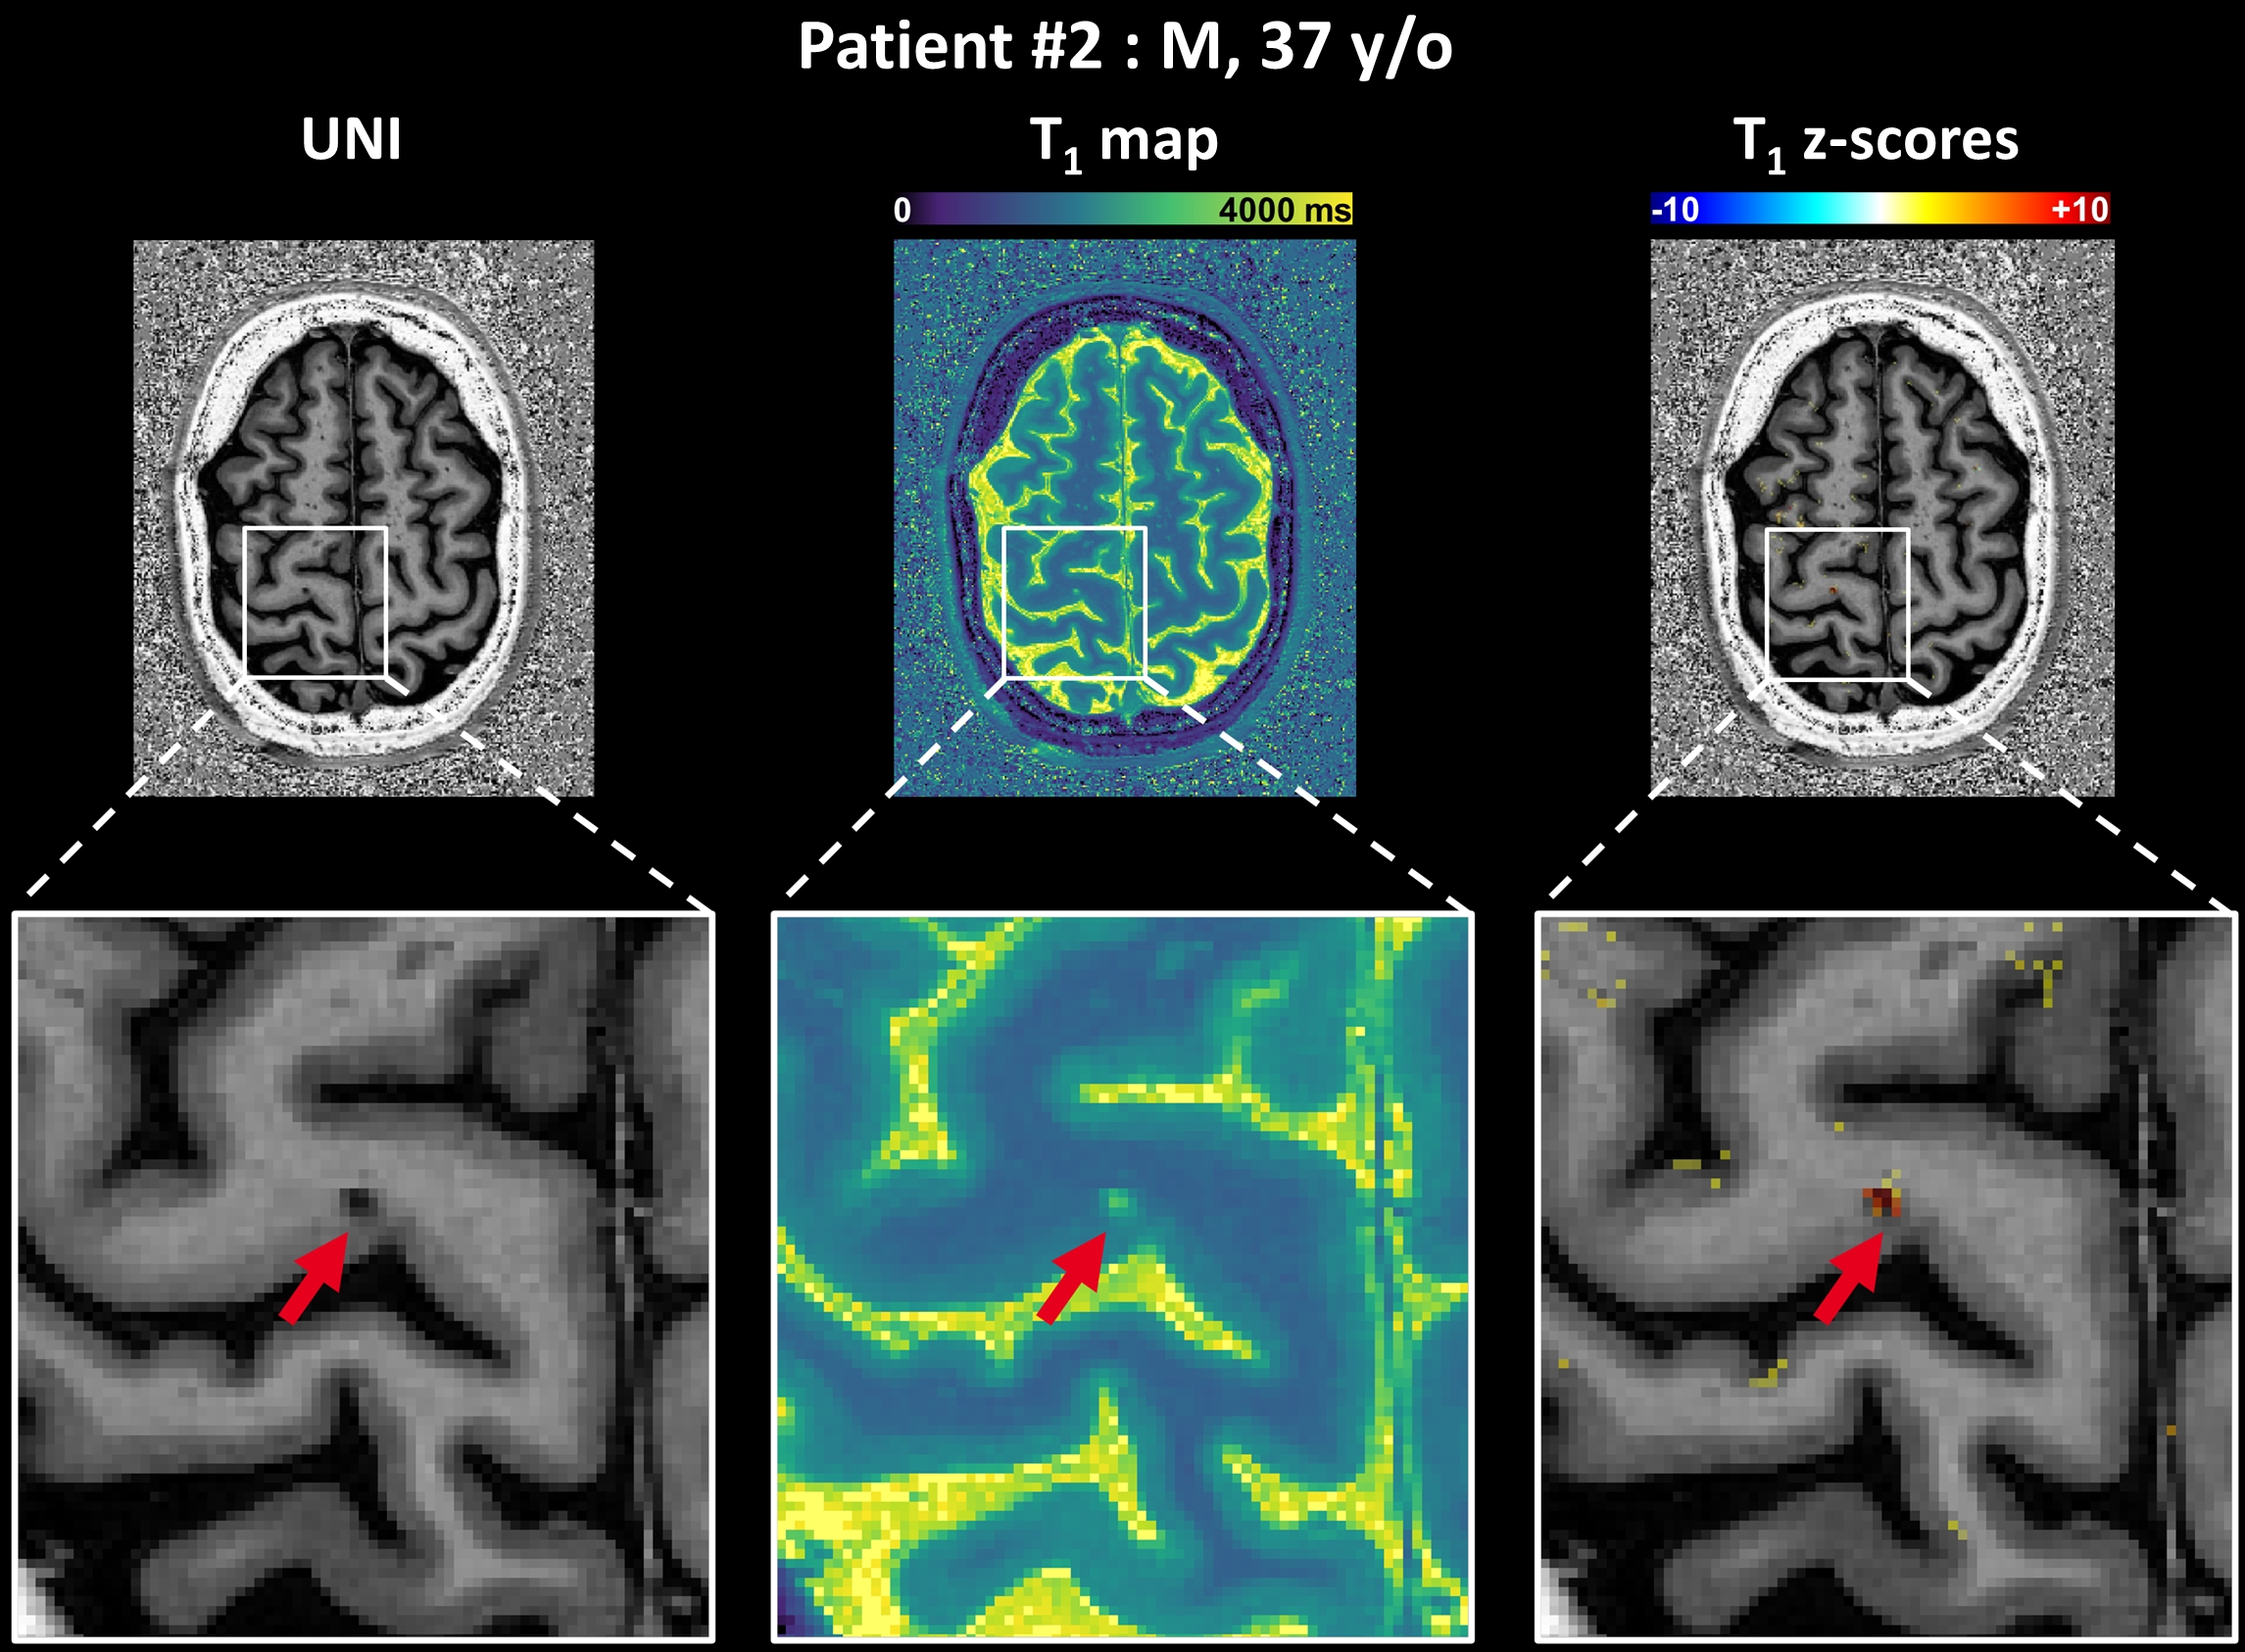
The deviation map of patient #1 shows both juxtacortical lesions (Figure$$$\,$$$4A:$$$\,$$$highest zT1$$$\,$$$=$$$\,$$$11.88, Figure$$$\,$$$4B:$$$\,$$$highest zT1$$$\,$$$=$$$\,$$$5.44) and diffuse alterations of the normal-appearing GM (NAGM) tissue (Figure$$$\,$$$4B). Another example of a juxtacortical lesion (highest zT1$$$\,$$$=$$$\,$$$12.38) is shown in the deviation map of patient #2 (Figure$$$\,$$$5).
Discussion and Conclusion
In this study, a normative T1 atlas for cortical GM and juxtacortical WM at 7T was created. It proved to be robust with overall low FPR. Its potential for identifying brain tissue abnormalities was illustrated with data from two RRMS patients, where the proposed method detected both focal lesions and diffuse T1 changes in the NAGM. Future work should focus on further validating the method in a larger cohort of patients, ideally including also different pathologies affecting the cortex. Additional efforts should also concentrate on developing an atlas while preserving the native high-resolution.In summary, these encouraging results may enable accurate and sensitive disease characterization in cortical GM and juxtacortical WM at 7T on a single-subject basis.
Acknowledgements
No acknowledgement found.References
1. Warntjes JBM, Engström M, Tisell A, Lundberg P. Brain Characterization Using Normalized Quantitative Magnetic Resonance Imaging. PLoS One. 2013;8(8). doi:10.1371/journal.pone.0070864
2. Bonnier G, Fischi-Gomez E, Roche A, et al. Personalized pathology maps to quantify diffuse and focal brain damage. NeuroImage Clin. 2019;21:101607. doi:10.1016/j.nicl.2018.11.017
3. Piredda GF, Hilbert T, Granziera C, et al. Quantitative brain relaxation atlases for personalized detection and characterization of brain pathology. Magn Reson Med. 2020;83(1):337-351. doi:10.1002/mrm.27927
4. Vaneckova M, Piredda GF, Andelova M, et al. Periventricular gradient of T1 tissue alterations in multiple sclerosis. NeuroImage Clin. 2022;34:103009. doi:10.1016/j.nicl.2022.103009
5. Piredda GF, Radojewski P, Bonanno G, et al. High-resolution T1 atlas for subject-specific abnormality detection at 7T. In: Proceedings of the International Society of Magnetic Resonance in Medicine, London, UK. 2022. Abstract: 1268.
6. Fischl B, Sereno MI, Dale AM. Cortical Surface-Based Analysis. Neuroimage. 1999;9(2):195-207. doi:10.1006/nimg.1998.0396
7. Piredda GF, Claudet M, Hilbert T, et al. Quantitative atlas of T1 relaxation times in the cerebral cortex for personalized characterization of pathology. In: Proceedings of the International Society of Magnetic Resonance in Medicine, London, UK. 2022. Abstract: 0369.
8. Marques JP, Kober T, Krueger G, van der Zwaag W, Van de Moortele P-F, Gruetter R. MP2RAGE, a self bias-field corrected sequence for improved segmentation and T1-mapping at high field. Neuroimage. 2010;49(2):1271-1281. doi:10.1016/j.neuroimage.2009.10.002
9. Mussard E, Hilbert T, Forman C, Meuli R, Thiran JP, Kober T. Accelerated MP2RAGE imaging using Cartesian phyllotaxis readout and compressed sensing reconstruction. Magn Reson Med. 2020;84(4):1881-1894. doi:10.1002/mrm.28244
10. Schmitter D, Roche A, Maréchal B, et al. An evaluation of volume-based morphometry for prediction of mild cognitive impairment and Alzheimer’s disease. NeuroImage Clin. 2015;7:7-17. doi:10.1016/j.nicl.2014.11.001
11. Piredda GF, Venkategowda PB, Radojewski P, et al. Automated brain morphometry for sub-millimeter 7T MRI using transfer learning. In: Proceedings of the International Society of Magnetic Resonance in Medicine, London, UK. 2022. Abstract: 2155.
12. Fischl B. FreeSurfer. Neuroimage. 2012;62(2):774-781. doi:10.1016/j.neuroimage.2012.01.021
13. Hagiwara A, Fujimoto K, Kamagata K, et al. Age-Related Changes in Relaxation Times, Proton Density, Myelin, and Tissue Volumes in Adult Brain Analyzed by 2-Dimensional Quantitative Synthetic Magnetic Resonance Imaging. Invest Radiol. 2021;56(3):163-172. doi:10.1097/RLI.0000000000000720
14. Sereno MI, Lutti A, Weiskopf N, Dick F. Mapping the human cortical surface by combining quantitative T1 with retinotopy. Cereb Cortex. 2013;23(9):2261-2268. doi:10.1093/cercor/bhs213
Figures