0273
In-Vivo T2 measurements of fetal brain in 1.5T1Department of Biomedical Engineering, King's College London, London, United Kingdom, 2Guy's and St Thomas Trust, London, United Kingdom, 3Centre for the Developing Brain, King's College London, London, United Kingdom, 4Biomedical Image Technologies, ETSI Telecomunicación, Universidad Politécnica de Madrid and CIBER-BBN, Madrid, Spain
Synopsis
Keywords: Quantitative Imaging, Fetus
Fetal brains go through rapid development, resulting in significant changes in tissue observable by MRI, during gestation. This work presents a quantitative MR imaging pipeline that aims to measure T2 relaxation in fetal brains from clinically acquired single-shot TSE sequences, reconstructed using slice to volume registration (SVR). Images with different echo times (TE) were acquired using a 1.5T MR system; we explored both a simple exponential decay model and more complex simulation-based dictionary for T2 estimation. Measured T2 values are greater than estimates from neonates and developmentally important regions such as the subplate are visible with significantly longer T2s.Introduction
The fetal and neonatal period is characterised by rapid brain development1 observable in MRI. While Single-shot Turbo Spin Echo (TSE) imaging is widely used for diagnostic fetal MRI1, 2, in-vivo measurements of fetal tissue relaxation is an emerging field with relatively few studies in the literature3, 4, 5, 6.Fetal motion presents a major problem for acquisition of the multi-contrast fetal MRI required for quantification of the relaxation properties in fetal tissue. The use of single-shot TSE sequences, coupled with slice-to-volume reconstruction (SVR) has enabled high-quality motion corrected T2-weighted 3D fetalMRI7. We propose a novel T2 relaxometry method based on motion-corrected T2-weighted single-shot TSE imaging to obtain T2 fetal brain measurements.
Methodology
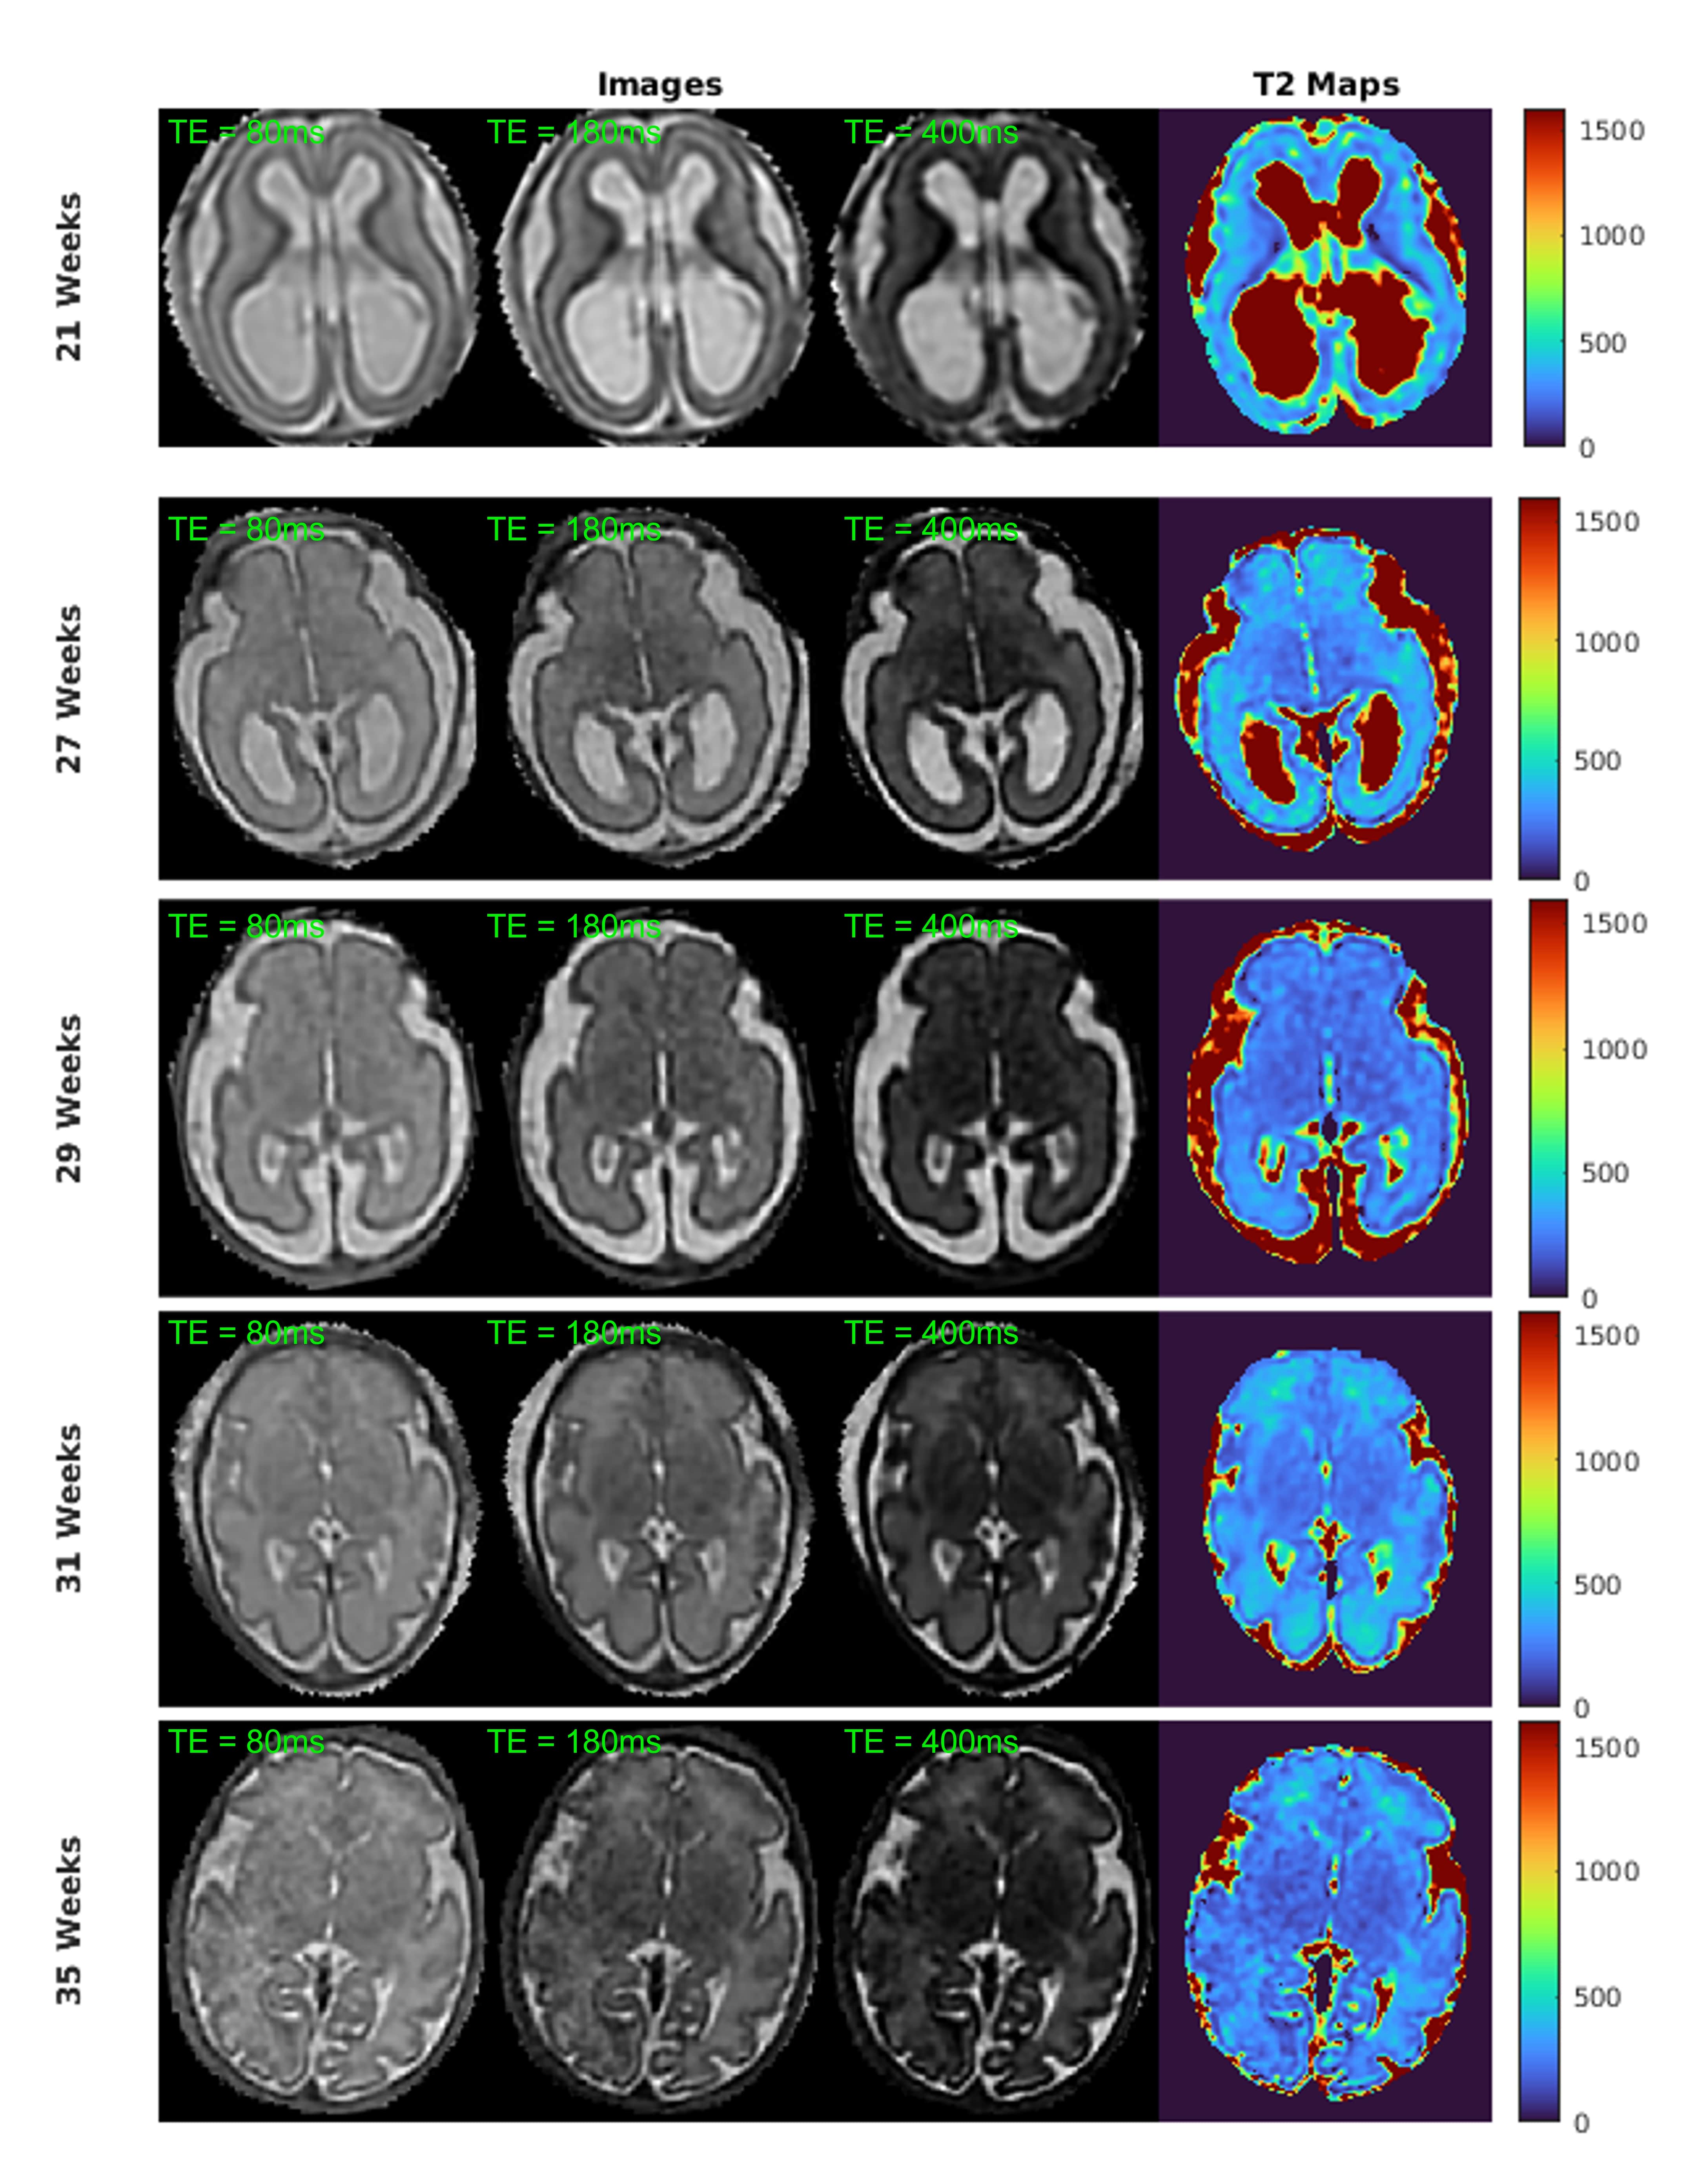
Fetal MRI datasets of five subjects with gestational ages (GAs) 21, 27, 29, 31 and 35 weeks were acquired on the Phillips Ingenia 1.5 T scanner at St Thomas Hospital, London. The fetuses had the following diagnoses:- GA 21 weeks: Moderate ventriculomegaly (VM)
- GA 27 weeks: Bilateral Borderline VM
- GA 29 weeks: Small brain for GA
- GA 31 weeks: Small hippocampus (HC)
- GA 35 weeks: Microcephaly/varicella exposure
To improve SNR, the scanned images were post-processed by a shearlet-based denoising8. Following this, a slice-to-volume reconstruction7, using the SVRTK library9, was employed to correct motion and reconstruct a 3D fetal MRI separately for each echo time. The reconstructed images of all TEs were registered to the TE=180ms reconstruction to insure good anatomical alignment before signal fitting.
We used an exponential T2 model and a dictionary of modelled signals using extended phase graphs(EPGs)10, 11 to build two separate T2 maps of the fetal brain. The EPG signal model includes diffusion, use of refocusing flip angles below 180◦(130◦ used in all cases), and slice profile effect; the slice profile was obtained by Bloch equation simulation of the true RF pulse wave-forms used by the scanner. The EPG simulation predicts the echo amplitudes of the whole echo train; we use the echo amplitude corresponding to the centre of k-space echo as the dictionary entry.
For the exponential model, the T2 values are found by fitting the signal equation using least squares minimisation.The EPG signal models for integer T2 values are stored in a dictionary and the T2 values are estimated by finding the dictionary entry that maximises the inner product with the measured signals. In general dictionary fitting was significantly faster than least squared minimisation.
Results
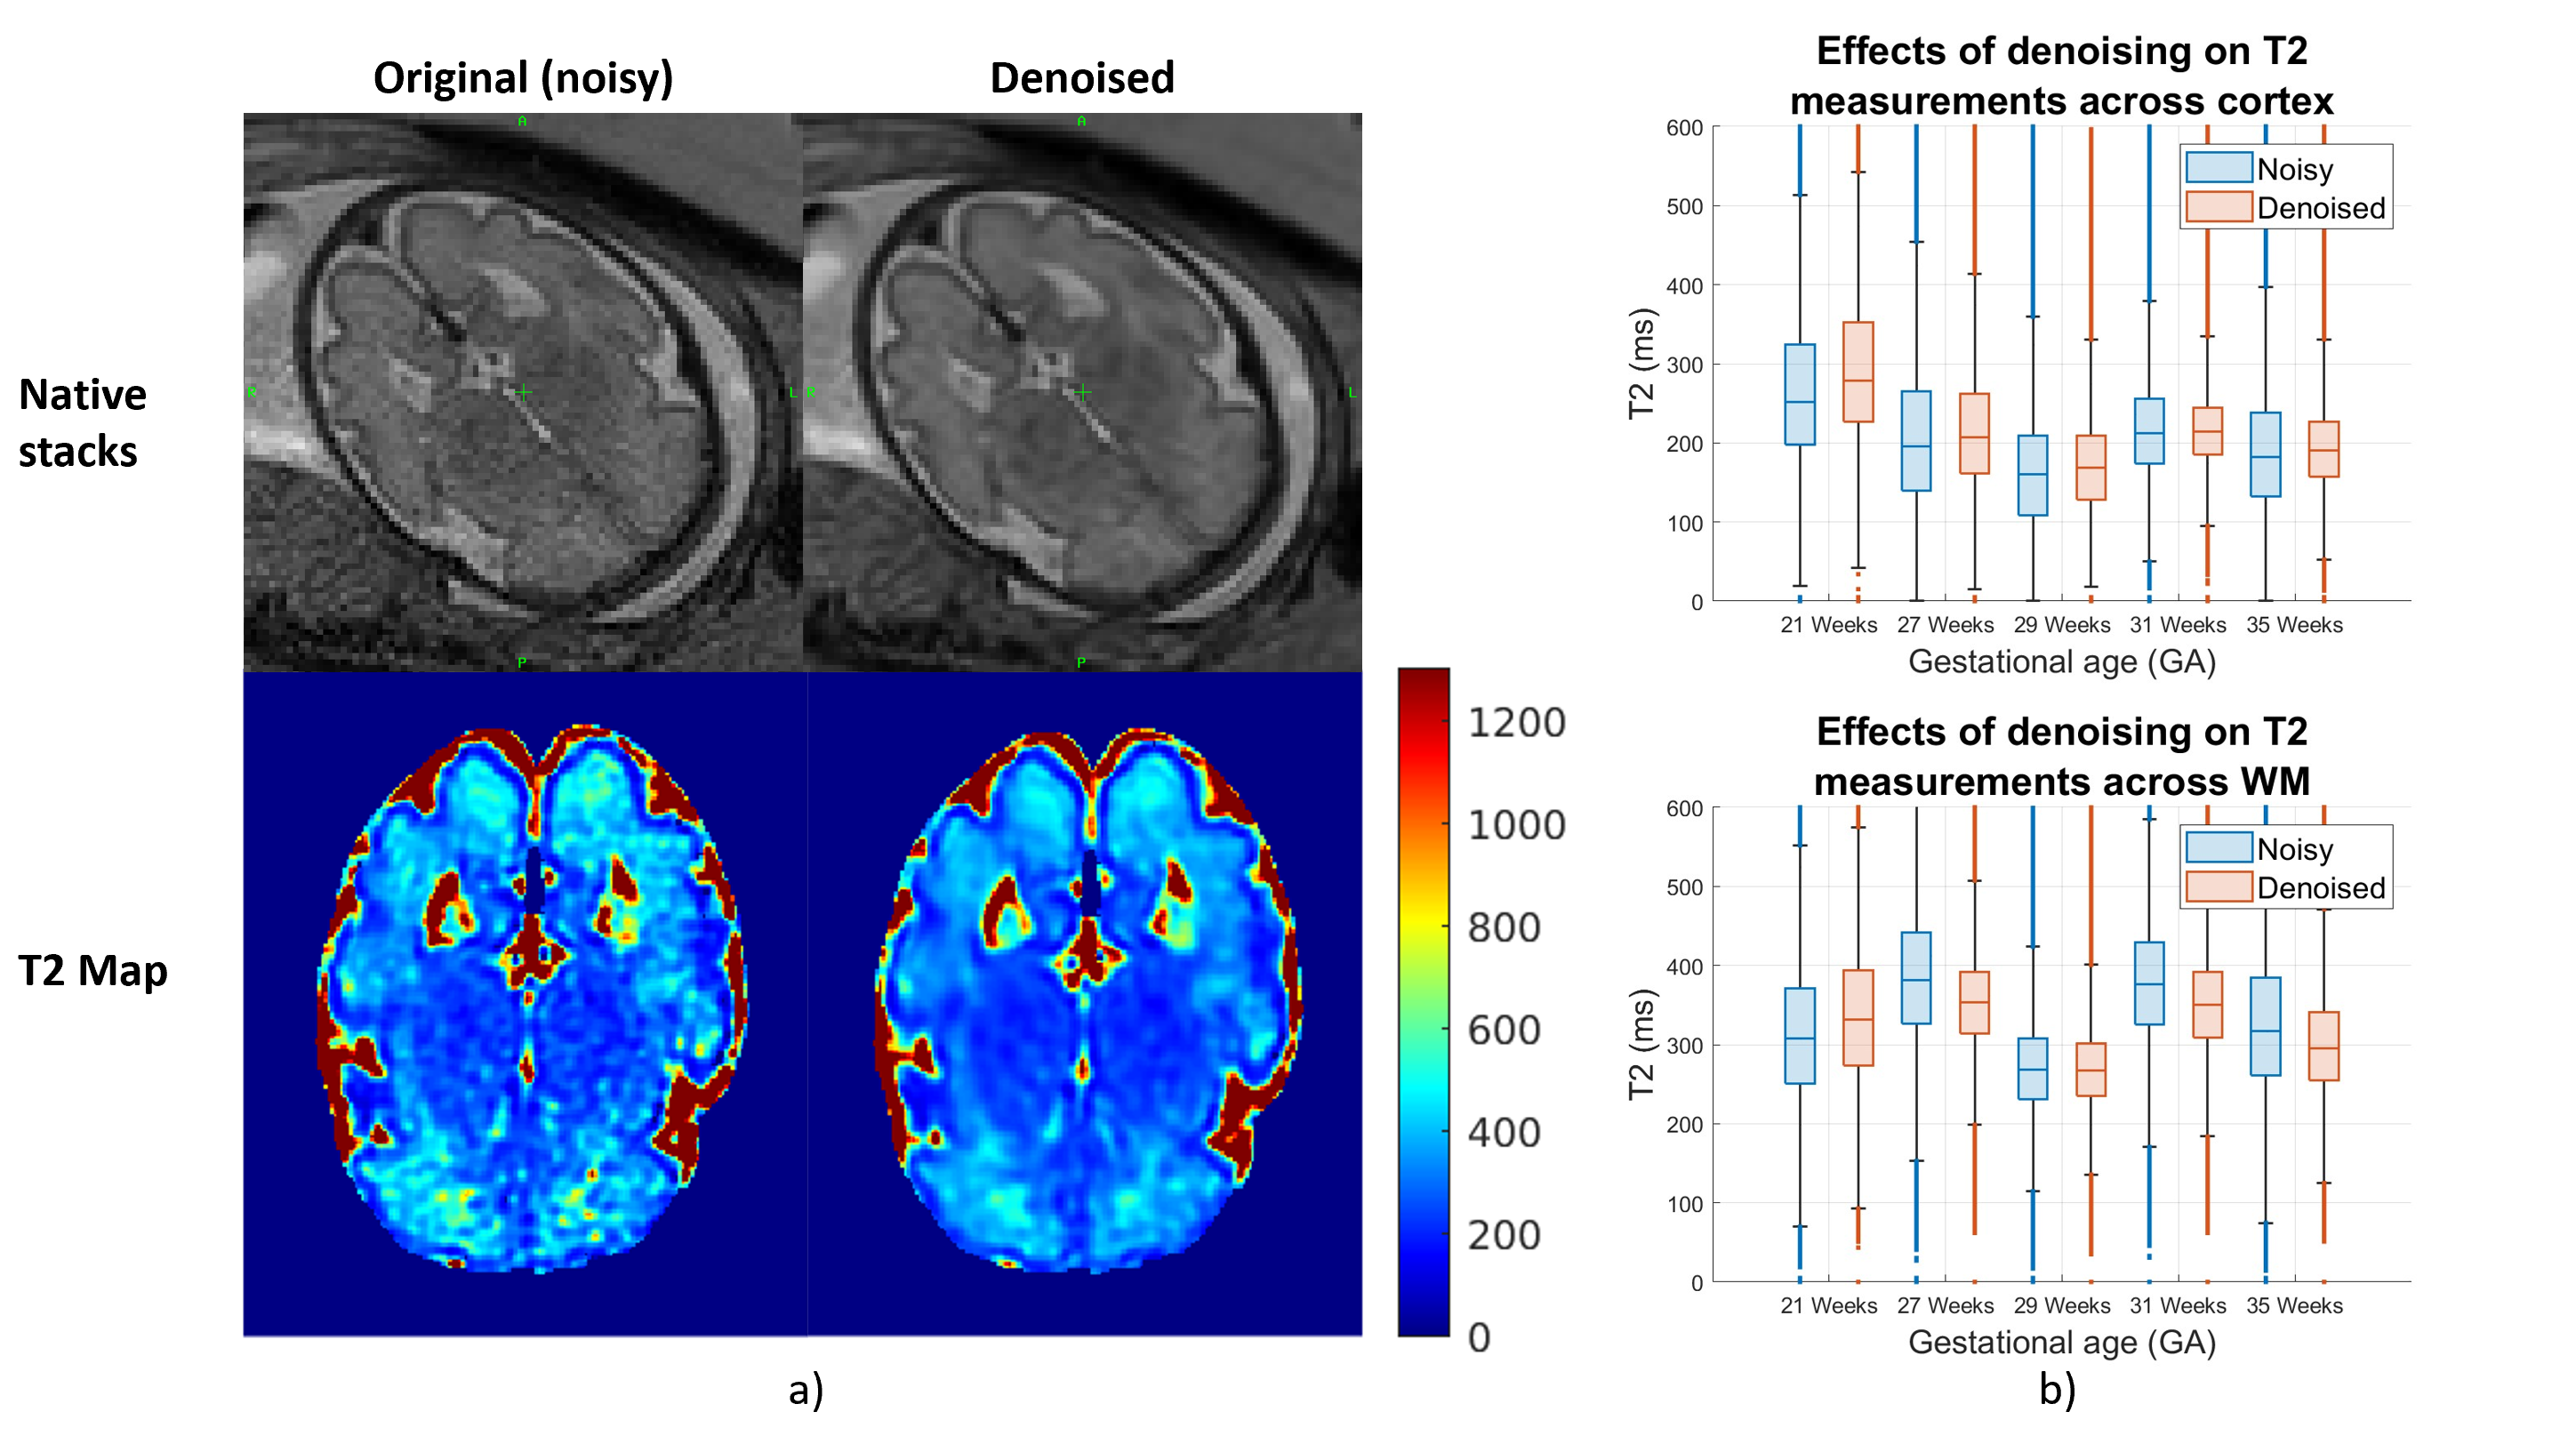
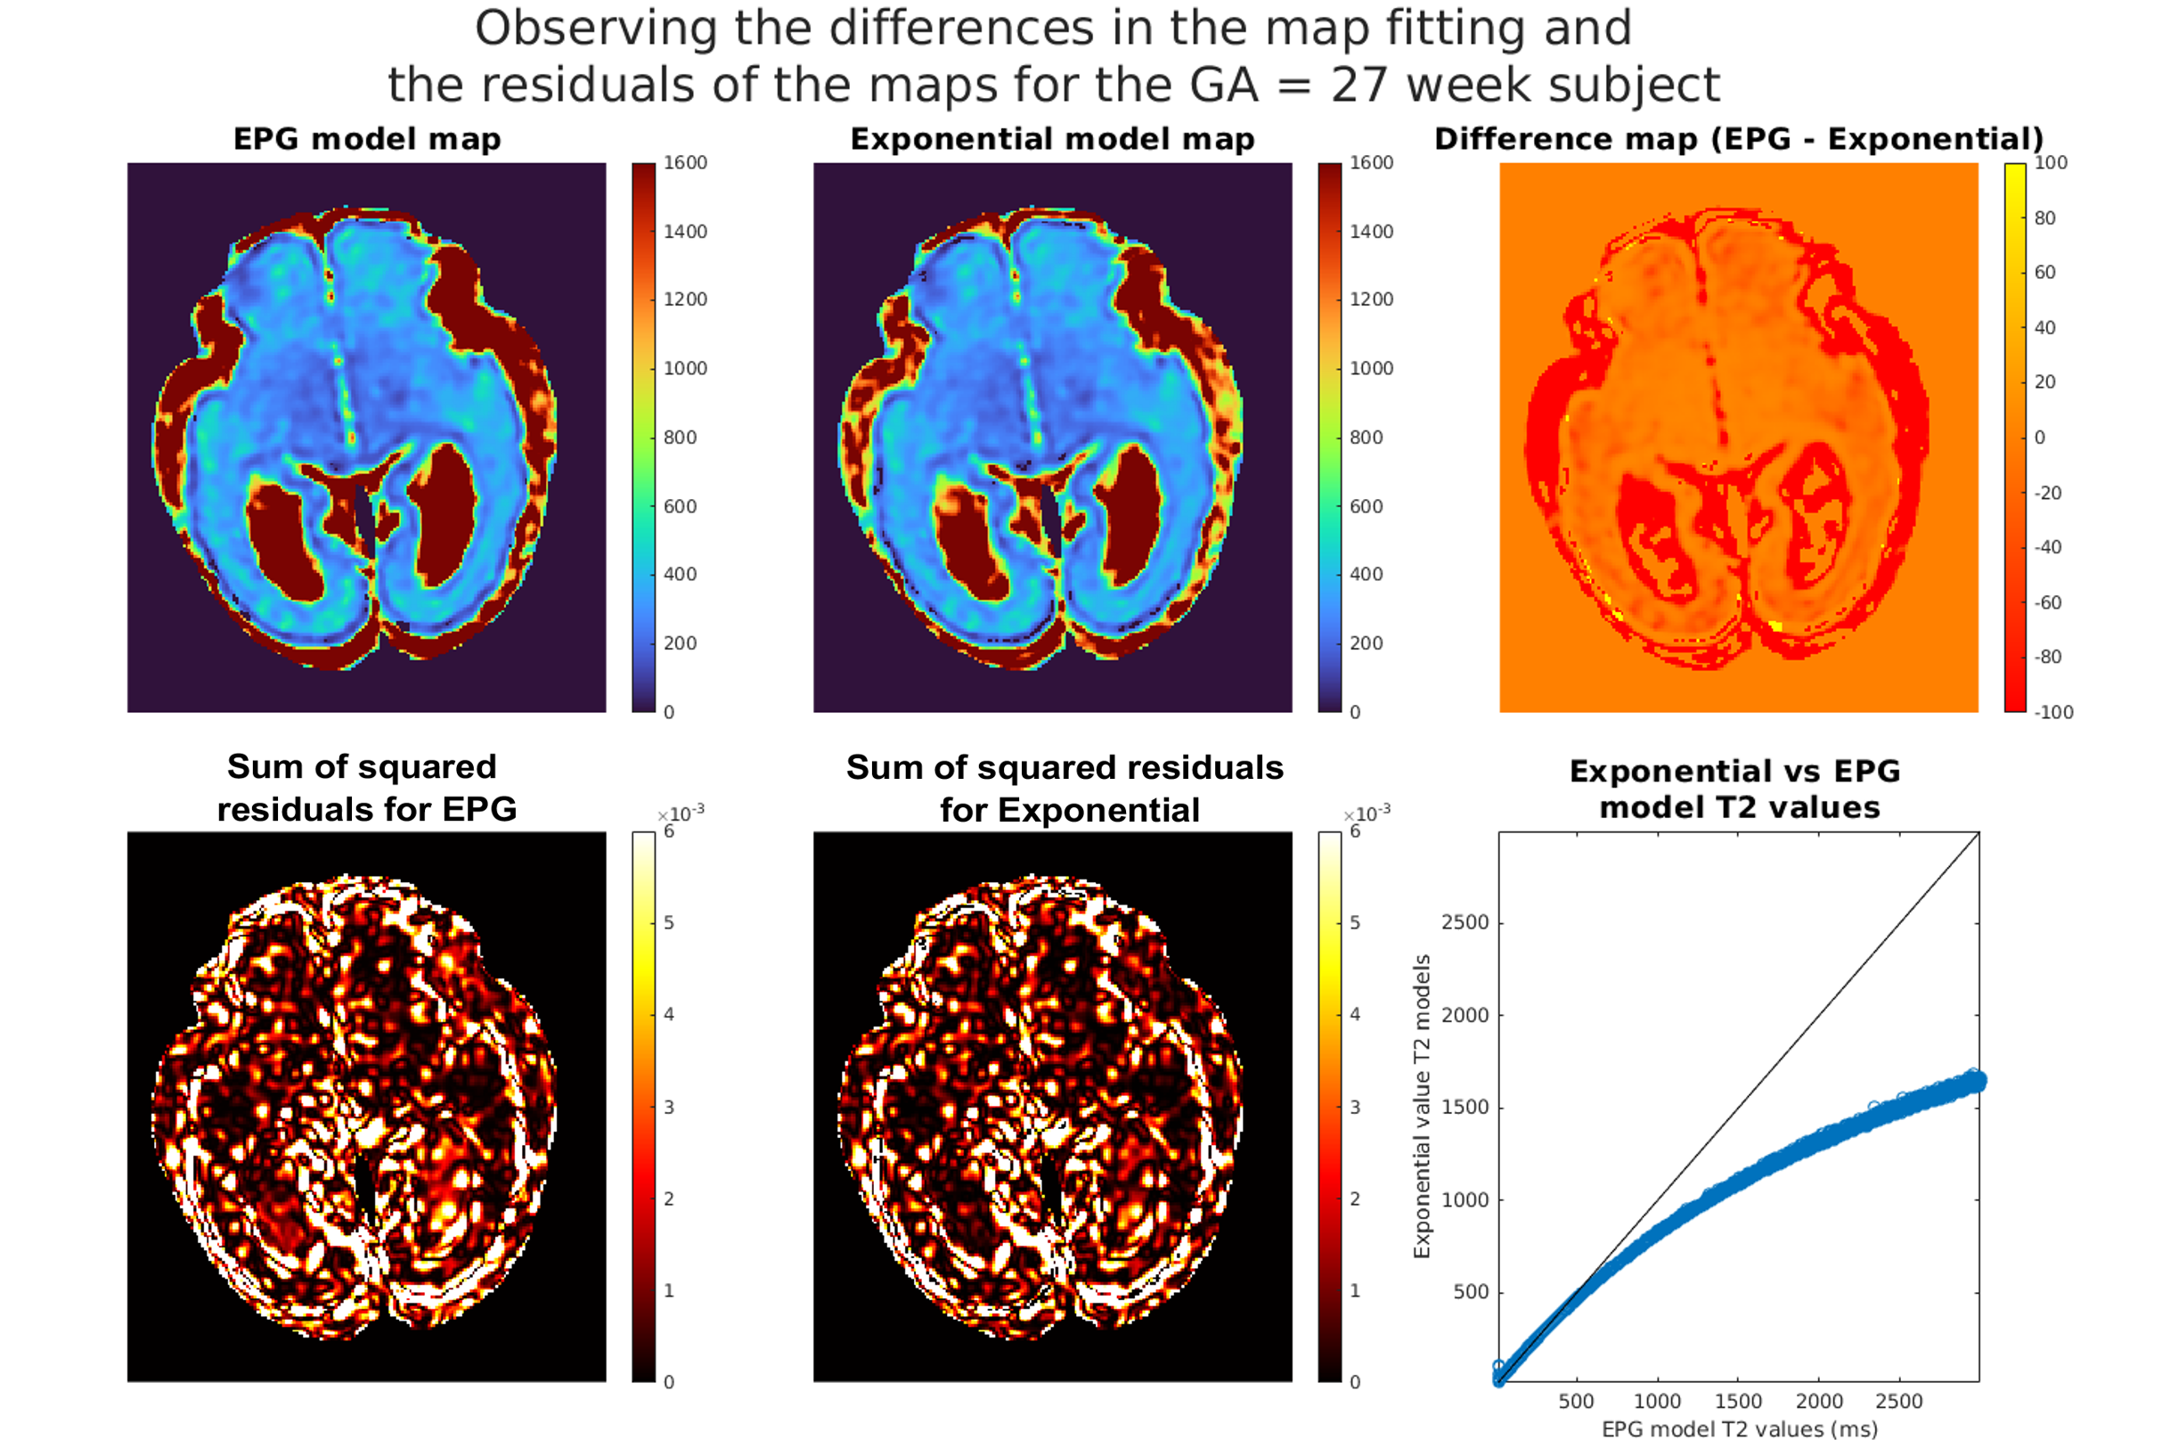
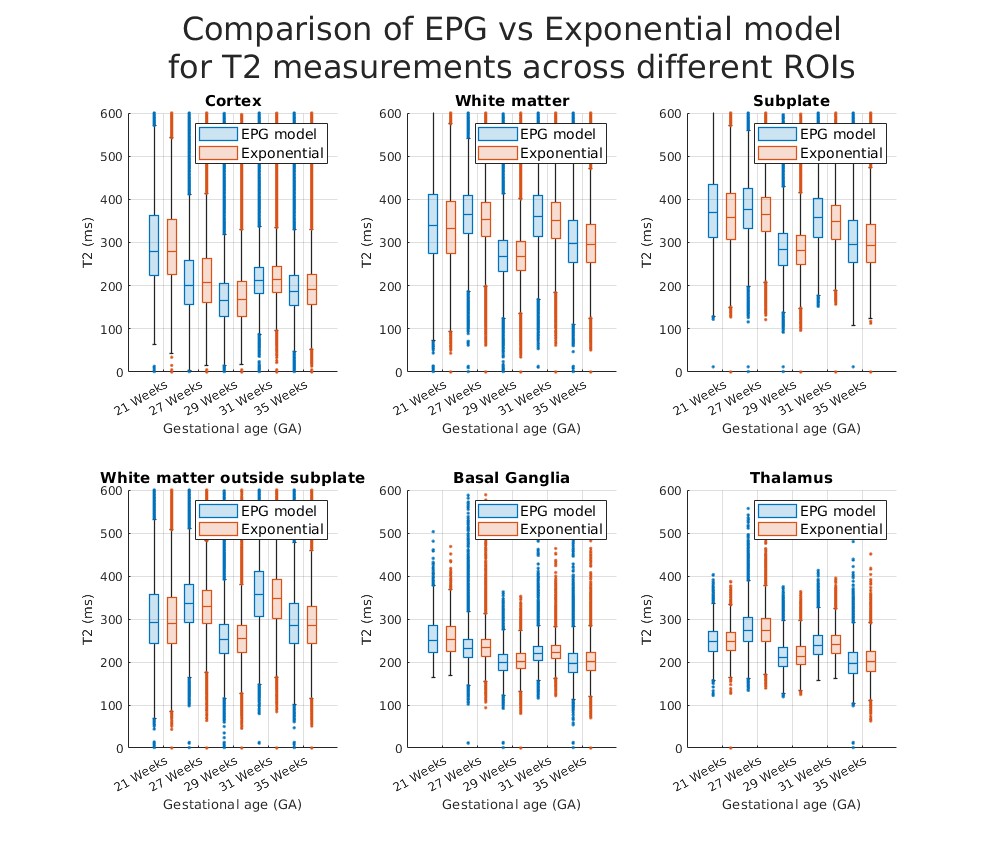
Figure 1a shows that shearlet denoising of the acquired images is effective for both acquired data and reconstructed T2 maps. Figure 1b shows distributions of T2 values fitted by the exponential signal model to the original (noisy) vs. denoised data and, overall, the values follow similar patterns with minor shifts.Figure 2 shows comparison of fitted T2 maps for the 27 week old subject. While both maps (top-left and middle) and residuals (bottom-left and middle) look similar, the difference map (top-right) shows EPG and exponential models diverge for higher T2 values, with EPG predicting lower T2 values than the exponential model. This is observable in particular in the subplate and CSF regions. This relationship between the predictions of the two models is visualised using the scatter-plot (bottom-right). Figure 3 presents T2 measurements using exponential and EPG models, suggesting both models perform very similarly for the tissues inside the brain.
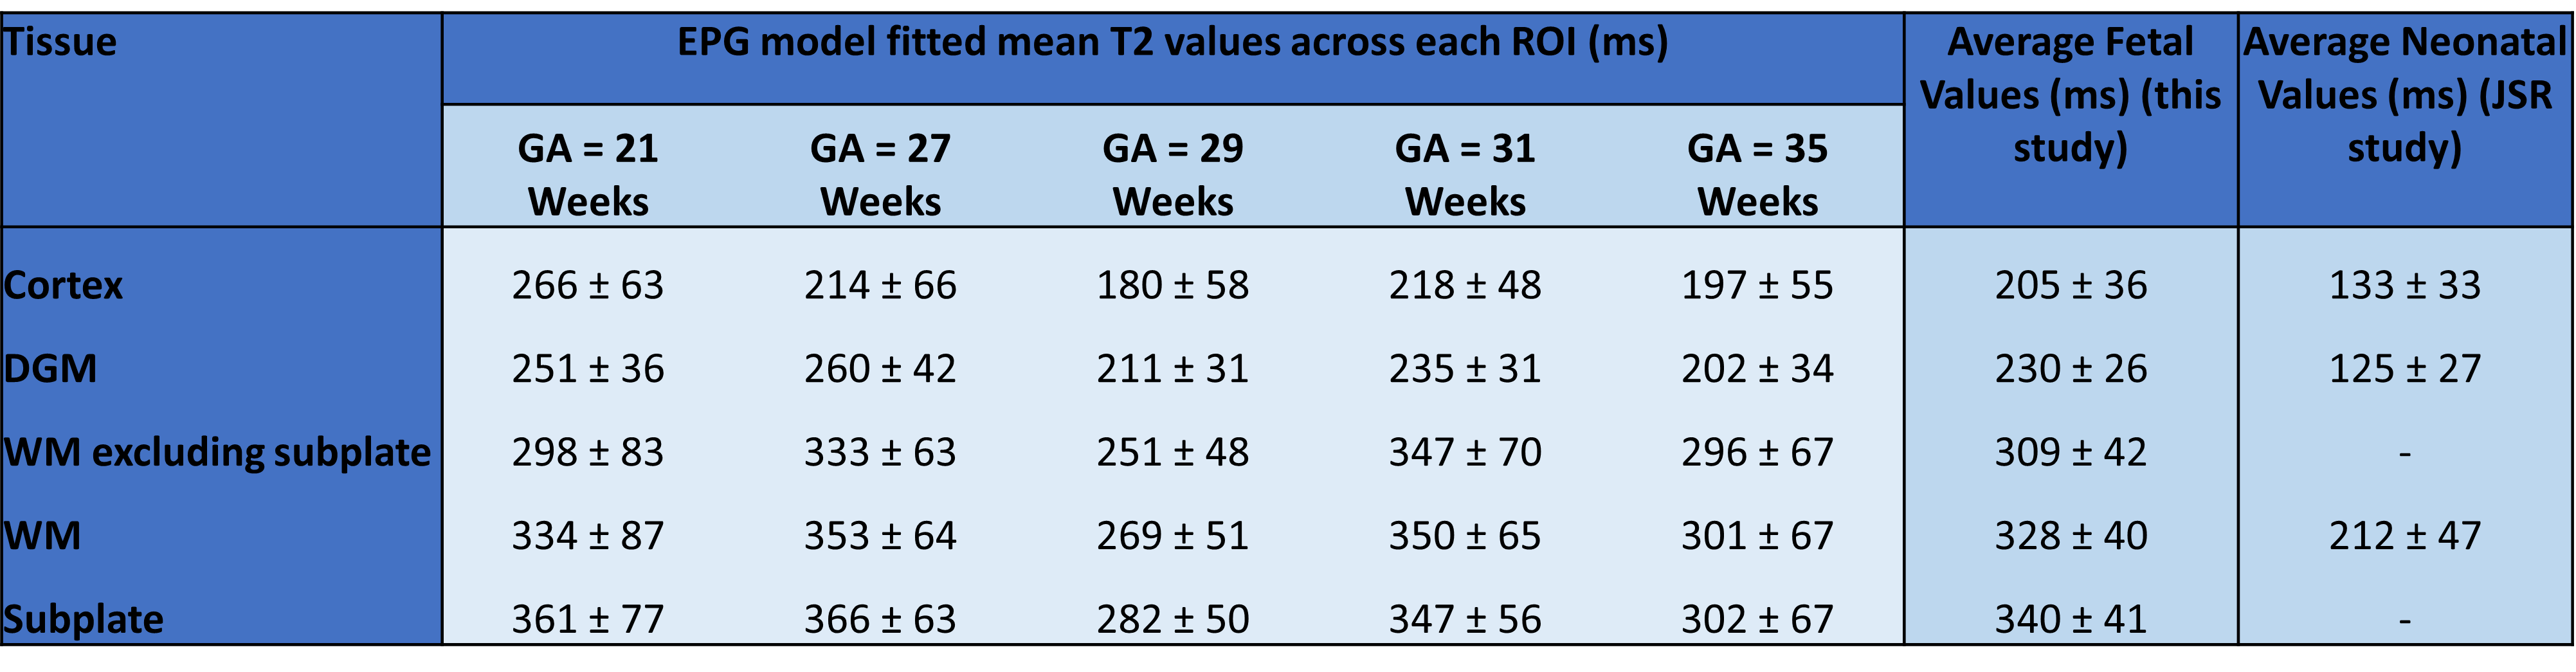
Figure 4 displays average EPG-based T2 values for different tissue classes of individual fetuses, the average over all fetal subjects and a comparison to neonatal T2 values measured by Joint System Relaxometry (JSR)13. On average, we measured T2 around 200ms in cortex, 230ms in deep grey matter and 330ms in white matter. These values were significantly higher in all fetuses than neonatal T2 values measured by JSR. The water-rich subplate had a higher average T2 value of 340ms, likely under-estimated due to image quality issues and partial volume effects. Visual inspection confirmed parts of subplate, as well as periventricular white matter, can reach T2 values of 400-600ms.
The fetal T2 maps displayed in Figure 5 were constructed with the EPG-model dictionary fitted to the denoised SVRTK reconstructions. The maps display well-defined structures of fetal brain tissues observable in original single-shot TSE reconstructions.
Dicussion and Conclusion
We present a novel method to measure T2 relaxation times inside the fetal brain based on standard single-shot TSE sequences with altering echo times. Overall, this method retains structural quality from single-shot TSE images in the T2-maps. While the resulting measurements are promising, more validation needs to be performed, as there are currently no ground truth T2 values for in-vivo fetal MRI. In addition, cross vendor and repeatability studies should be performed to test the robustness of the quantitation from the method proposed.Acknowledgements
I would like to acknowledge funding from the EPSRC Centre for Doctoral Training in Smart Medical Imaging (EP/S022104/1)
This work was supported by core funding from the Wellcome/EPSRC Centre for Medical Engineering [WT203148/Z/16/Z] and by the National Institute for Health Research (NIHR) Biomedical Research Centre based at Guy’s and St Thomas’ NHS Foundation Trust and King’s College London and/or the NIHR Clinical Research Facility. The views expressed are those of the author(s) and not necessarily those of the NHS, the NIHR or the Department of Health and Social Care.
References
1. Mary Rutherford, Shuzhou Jiang, Joanna Allsop, Lucinda Perkins, Latha Srinivasan, Tayyib Hayat, Sailesh Kumar, and Jo Hajnal. MR imaging methods for assessing fetal brain development. Developmental Neurobiology, 68(6):700–711, 2008.
2. Y Yamashita, T Namimoto, Y Abe, M Takahashi, J Iwamasa, K Miyazaki, and H Okamura. MR imaging of the fetus by a HASTE sequence. AJR. American journal of roentgenology, 168(2):513–519,1997.
3. Anna I Blazejewska, Sharmishtaa Seshamani, Susan K McKown, Jason S Caucutt, Manjiri Dighe,Christopher Gatenby, and Colin Studholme. 3D in utero quantification of T2* relaxation times in human fetal brain tissues for age optimized structural and functional MRI. Magnetic resonance in medicine, 78(3):909–916, 2017.
4. VU Schmidbauer, GO Dovjak, MS Yildirim, G Mayr-Geisl, M Weber, MC Diogo, GM Gruber, F Prayer, R-I Milos, M Stuempflen, et al. Mapping human fetal brain maturation in vivo using quantitative MRI. American Journal of Neuroradiology, 42(11):2086–2093, 2021.
5. Serge Vasylechko, Christina Malamateniou, Rita G Nunes, Matthew Fox, Joanna Allsop, Mary Rutherford, Daniel Rueckert, and Joseph V Hajnal. T2* relaxometry of fetal brain at 1.5 Tesla using a motion tolerant method. Magnetic Resonance in Medicine, 73(5):1795–1802, 2015.
6. Hélène Lajous, Tom Hilbert, Christopher W Roy, Sébastien Tourbier, Priscille de Dumast,Thomas Yu, Jean-Philippe Thiran, Jean-Baptiste Ledoux, Davide Piccini, Patric Hagmann, et al. T2 mapping from super-resolution-reconstructed clinical fast spin echo magnetic resonance acquisitions. In International Conference on Medical Image Computing and Computer-Assisted Intervention, pages 114–124. Springer, 2020.
7. Maria Kuklisova-Murgasova, Gerardine Quaghebeur, Mary A Rutherford, Joseph V Hajnal, and Julia A Schnabel. Reconstruction of fetal brain MRI with intensity matching and complete outlier removal. Medical image analysis, 16(8):1550–1564, 2012.
8. Gitta Kutyniok, Jakob Lemvig, and Wang-Q Lim. Optimally sparse approximations of 3D functions by compactly supported shearlet frames. SIAM Journal on Mathematical Analysis, 44(4):2962–3017, 2012.
9. M Deprez, A Uus, J Van Ameron, T Roberts, L Jackon, and I Grigorescu. SVRTK: Slice-to-volume reconstruction toolkit, 2012.
10. Matthias Weigel. Extended phase graphs: dephasing, RF pulses, and echoes-pure and simple. Journal of Magnetic Resonance Imaging, 41(2):266–295, 2015.
11. Shaihan J Malik, Rui Pedro AG Teixeira, and Joseph V Hajnal. Extended phase graph formalism for systems with magnetization transfer and exchange. Magnetic resonance in medicine, 80(2):767–779, 2018.
12. Antonios Makropoulos, Emma C Robinson, Andreas Schuh, Robert Wright, Sean Fitzgibbon, Jelena Bozek, Serena J Counsell, Johannes Steinweg, Katy Vecchiato, Jonathan Passerat-Palmbach,et al. The developing human connectome project: A minimal processing pipeline for neonatalcortical surface reconstruction. Neuroimage, 173:88–112, 2018.7.
13. Rui Pedro AG Teixeira, Shaihan J Malik, and Joseph V Hajnal. Joint system relaxometry (JSR) and cramer-rao lower bound optimization of sequence parameters: a framework for enhanced precision of despot T1 and T2 estimation. Magnetic Resonance in Medicine, 79(1):234–245, 2018
Figures