0272
High spatial resolution T2 mapping via multi-shot multiple overlapping-echo detachment imaging1Xiamen University, Xiamen, China, 2Zhejiang University, Hangzhou, China, 3University of Rochester, Rochester, NY, United States
Synopsis
Keywords: Quantitative Imaging, Quantitative Imaging, multiple overlapping-echo detachment imaging
A multi-shot acquisition strategy is adapted to multiple overlapping-echo detachment imaging (MOLED), implementing T2 mapping with the spatial resolution of submillimeter. Compared with ssh-MOLED (ssh- for single-shot), msh-MOLED (msh- for multi-shot) are more resistant to B0 inhomogeneity, leading to quantitative results with less distortion. Besides, msh-MOLED fulfills a high acquisition efficiency. Accuracy of msh-MOLED was validated on phantoms with a 7T zoological scanner and a 3T whole-body scanner. Higher spatial resolution also alleviates partial volume effect and results in a better structure delineation of msh-MOLED, which was corroborated with in vivo experiments.Introduction
Quantitative magnetic resonance imaging (qMRI) provides images without the influences of the choice of pulse sequence or acquisition parameters and operator’s habits, while its lengthy scan time decreases image throughputs and limits its application in clinical practice.1 In this context, we have proposed a single-shot quantitative method named multiple overlapping-echo detachment imaging (MOLED) to greatly shorten the scan time.2 In this work, we adapted an interleaved multi-shot acquisition strategy to MOLED to overcome the limitation to spatial resolution and the nonresistance to B0 inhomogeneity of single-shot MOLED. Validation experiments demonstrate that our method is accurate and reproducible.Methods
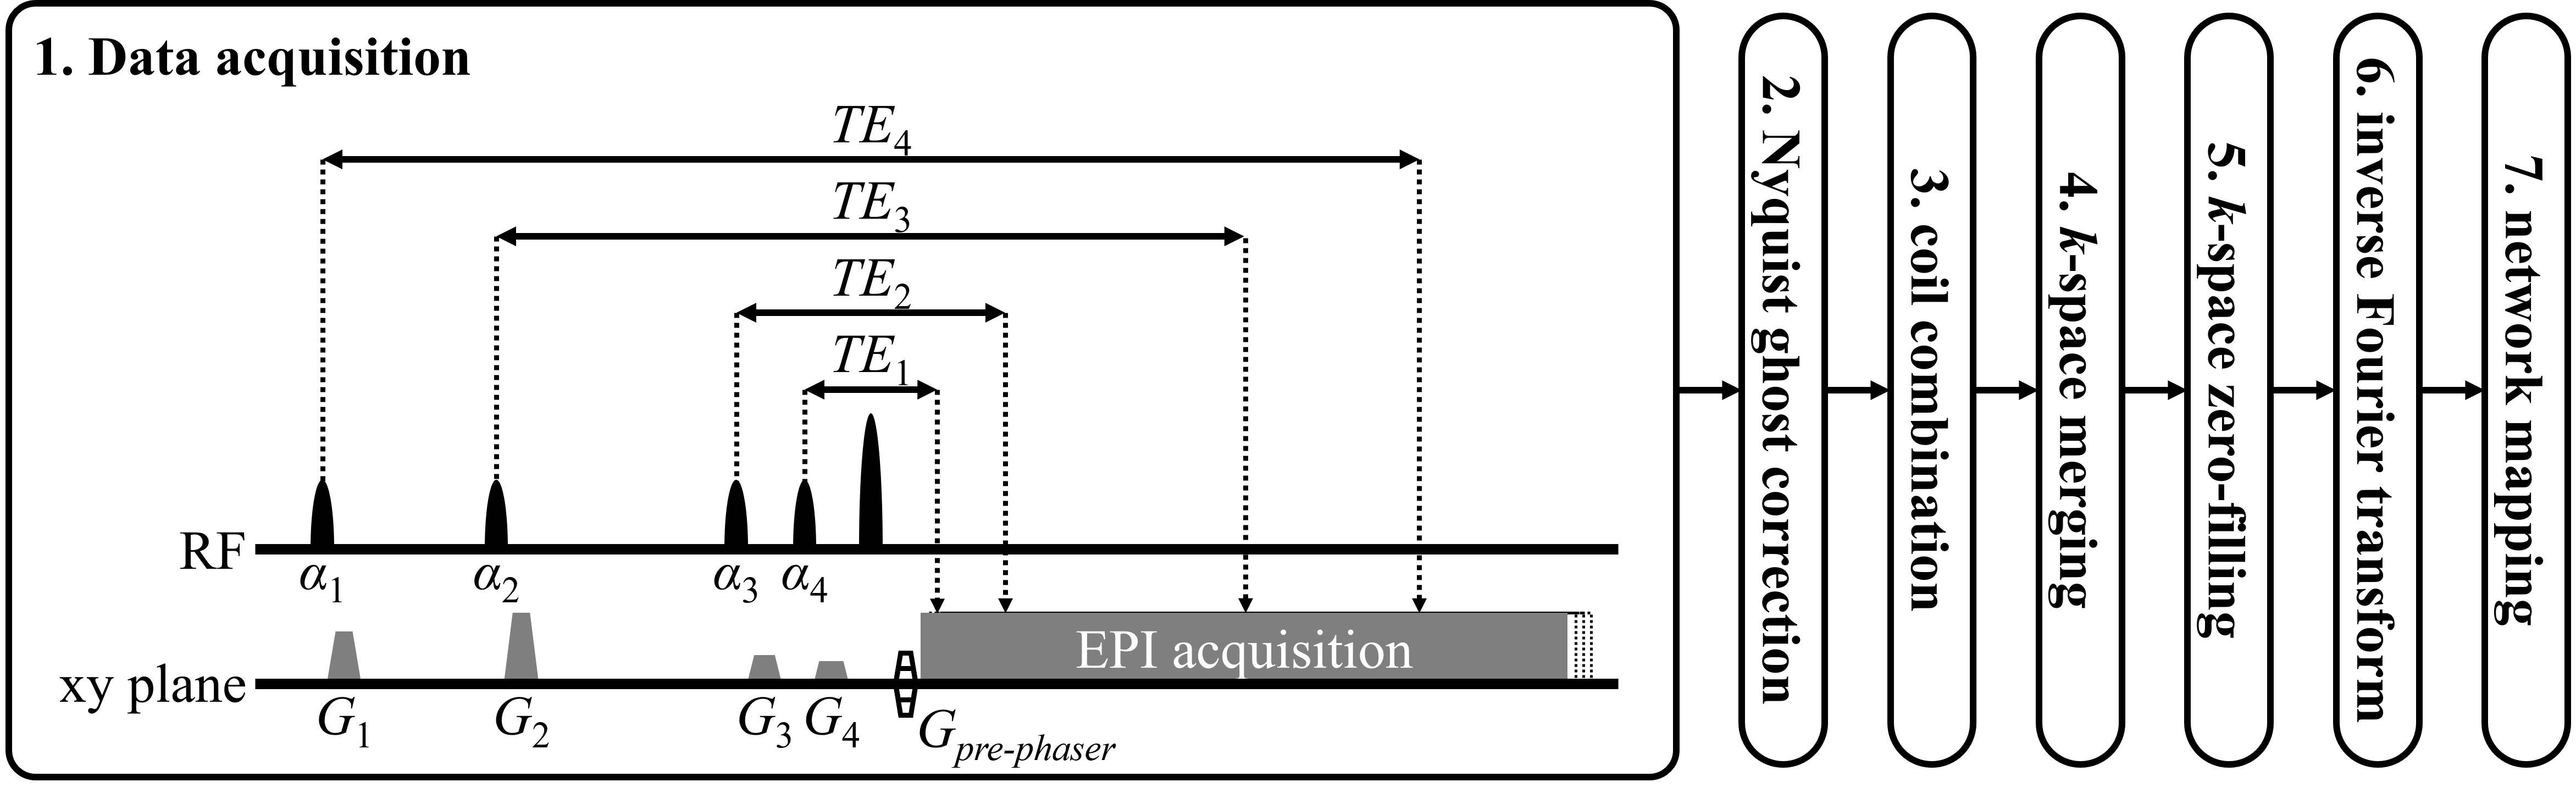
Method flowchart: As illustrated in Figure 1, multiple T2-weighted (T2w) information was captured in each segment of k-space, which would be merged into one k-space after the Nyquist N/2 ghosts were corrected by a three-line navigator and after coil combination. Thereafter, the k-space would be zero-filled, expanding its matrix size to double. After inverse Fourier transform, msh-MOLED image (msh- for multi-shot) was input to a trained neural network2 and yielded final T2 mapping results. A U-Net architecture along with 1400 training samples was engaged for network training, and the training details were same as our previous description.3Phantom experiment A: A 7.0T animal MRI system (Varian, Palo Alto, CA, USA) equipped with a single-channel volume coil was used for data acquisition. Scan parameters: field of view (FOV) = 50 mm×50 mm, slice thickness = 3.0 mm, slice number = 1, bandwidth (BW) = 1628 Hz/pixel, matrix size = 256×256, segment number = 4, TR = 2.0 s, TE1,2,3,4 = 19, 42, 64, and 86 ms. Reference T2 map was mono-exponentially fitted from single-echo spin-echo (SESE) images whose TR was 5.0 s and TEs were 20, 50, 80, and 110 ms.
Phantom experiment B: A 3.0T whole-body MRI system (Prisma, Siemens Healthcare, Erlangen, Bavaria Land, Germany) equipped with a 20-channel head coil was used for data acquisition. Scan parameters: FOV = 220 mm×220 mm, slice thickness = 3.0 mm, slice number = 11, BW = 850 Hz/pixel, matrix size = 256×256, segment number = 8, TR = 8.0 s, TE1,2,3,4 = 23, 45, 66, and 87 ms. Reference T2 maps were derived from SESE images (TR = 2.5 s, TEs = 15, 35, 50, 70, 90, and 120 ms).
Brain experiment: Hardware setup and most scan parameters were identical to phantom experiment B, except the following parameters: slice number = 21, BW = 1220 Hz/pixel, segment number = 4, TR = 5.0 s, TE1,2,3,4 = 12, 26, 75, and 111 ms. An ssh-MOLED (ssh- for single-shot) was also performed for comparison (BW = 1302 Hz/pixel, TR = 8.0 s, and TE1,2,3,4 = 22, 52, 82, and 111 ms). Reference T2 maps were derived from SESE images (TR = 2.5 s, TEs = 10, 25, 50, and 90 ms). The total acquisition time (TA) of msh-MOLED was 30 s, while the TA of SESE was 51 min and 32 s.
Results
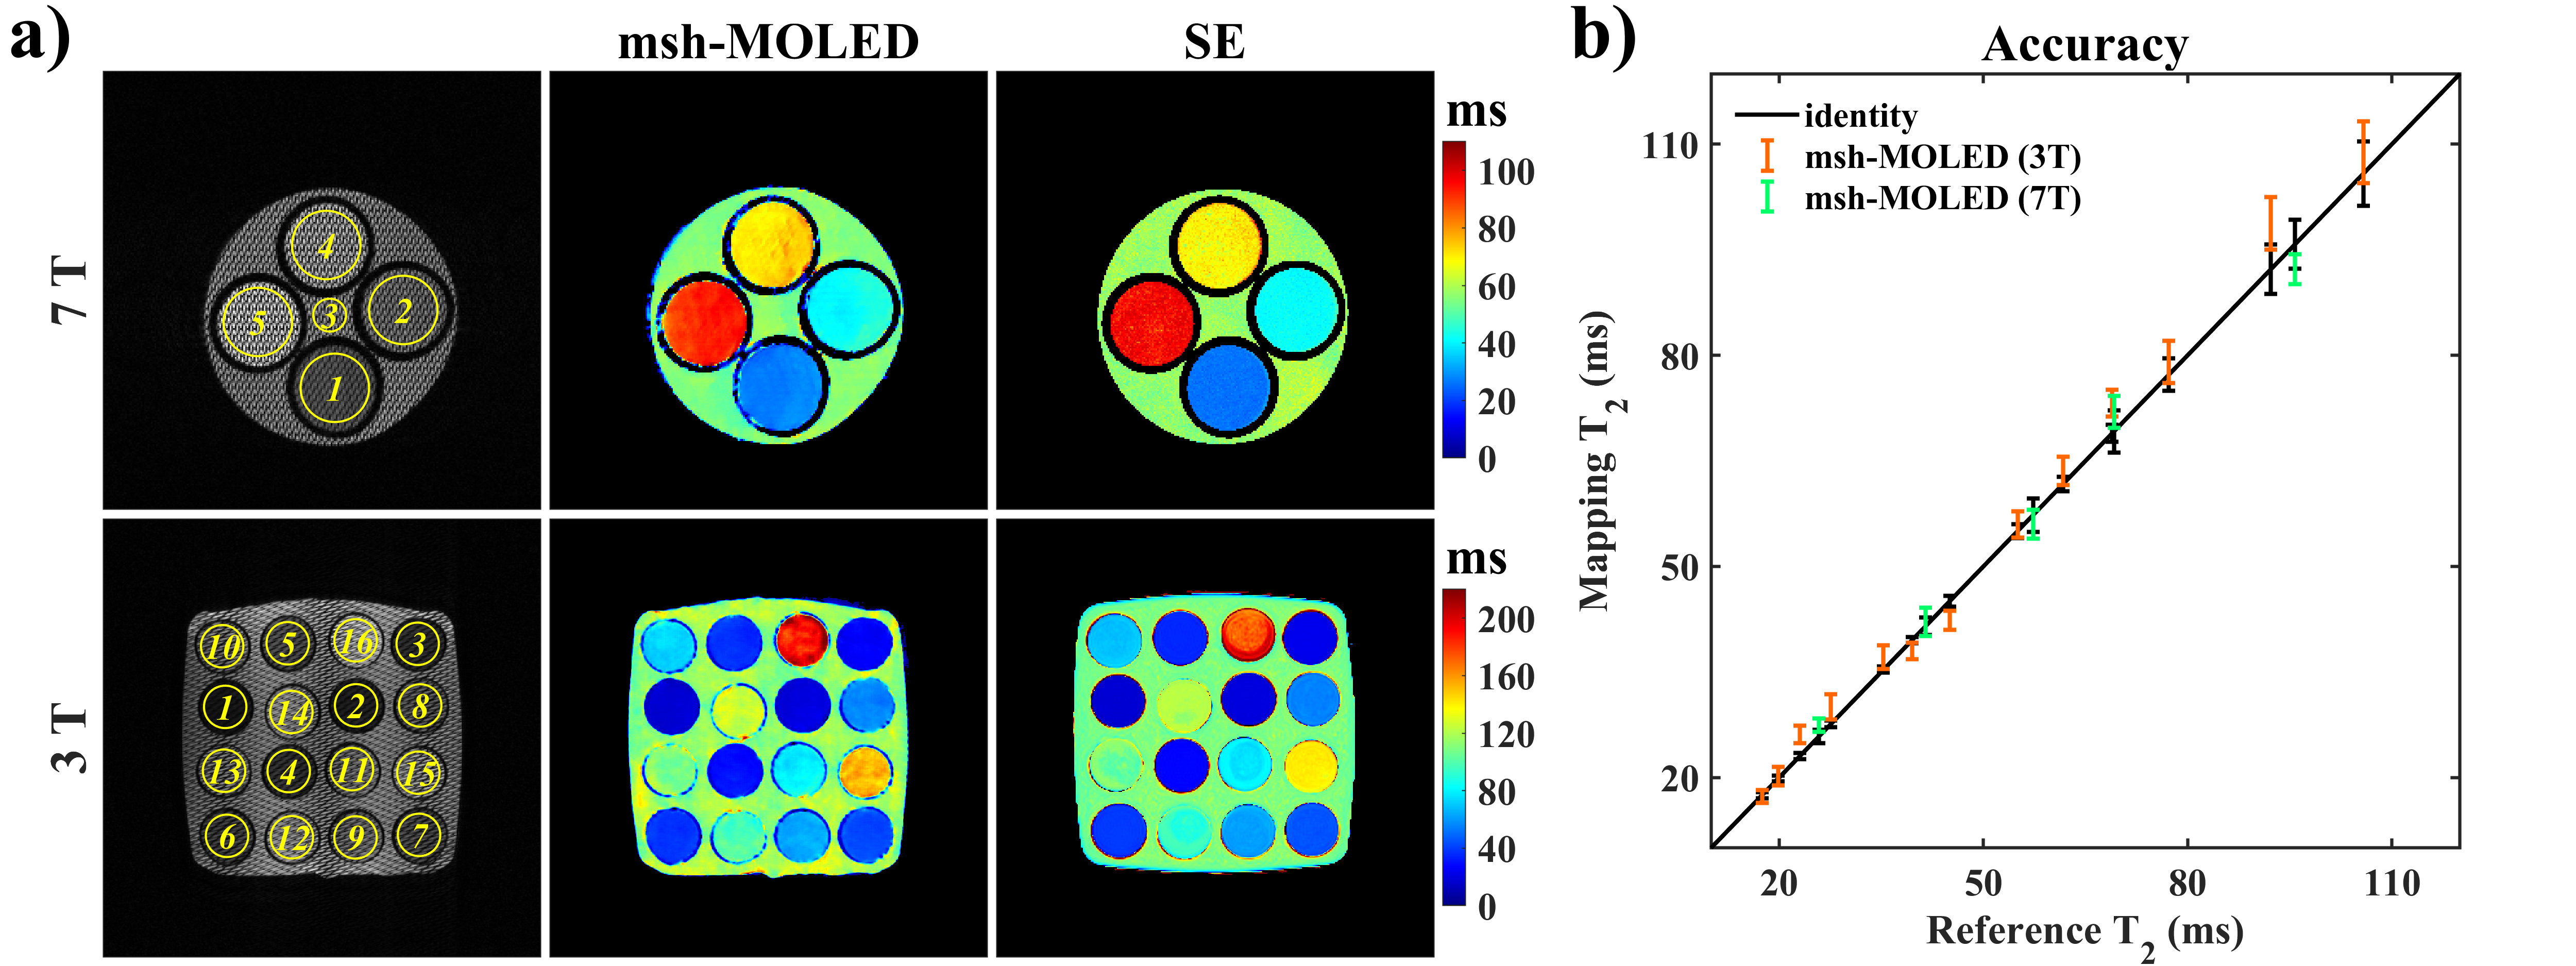
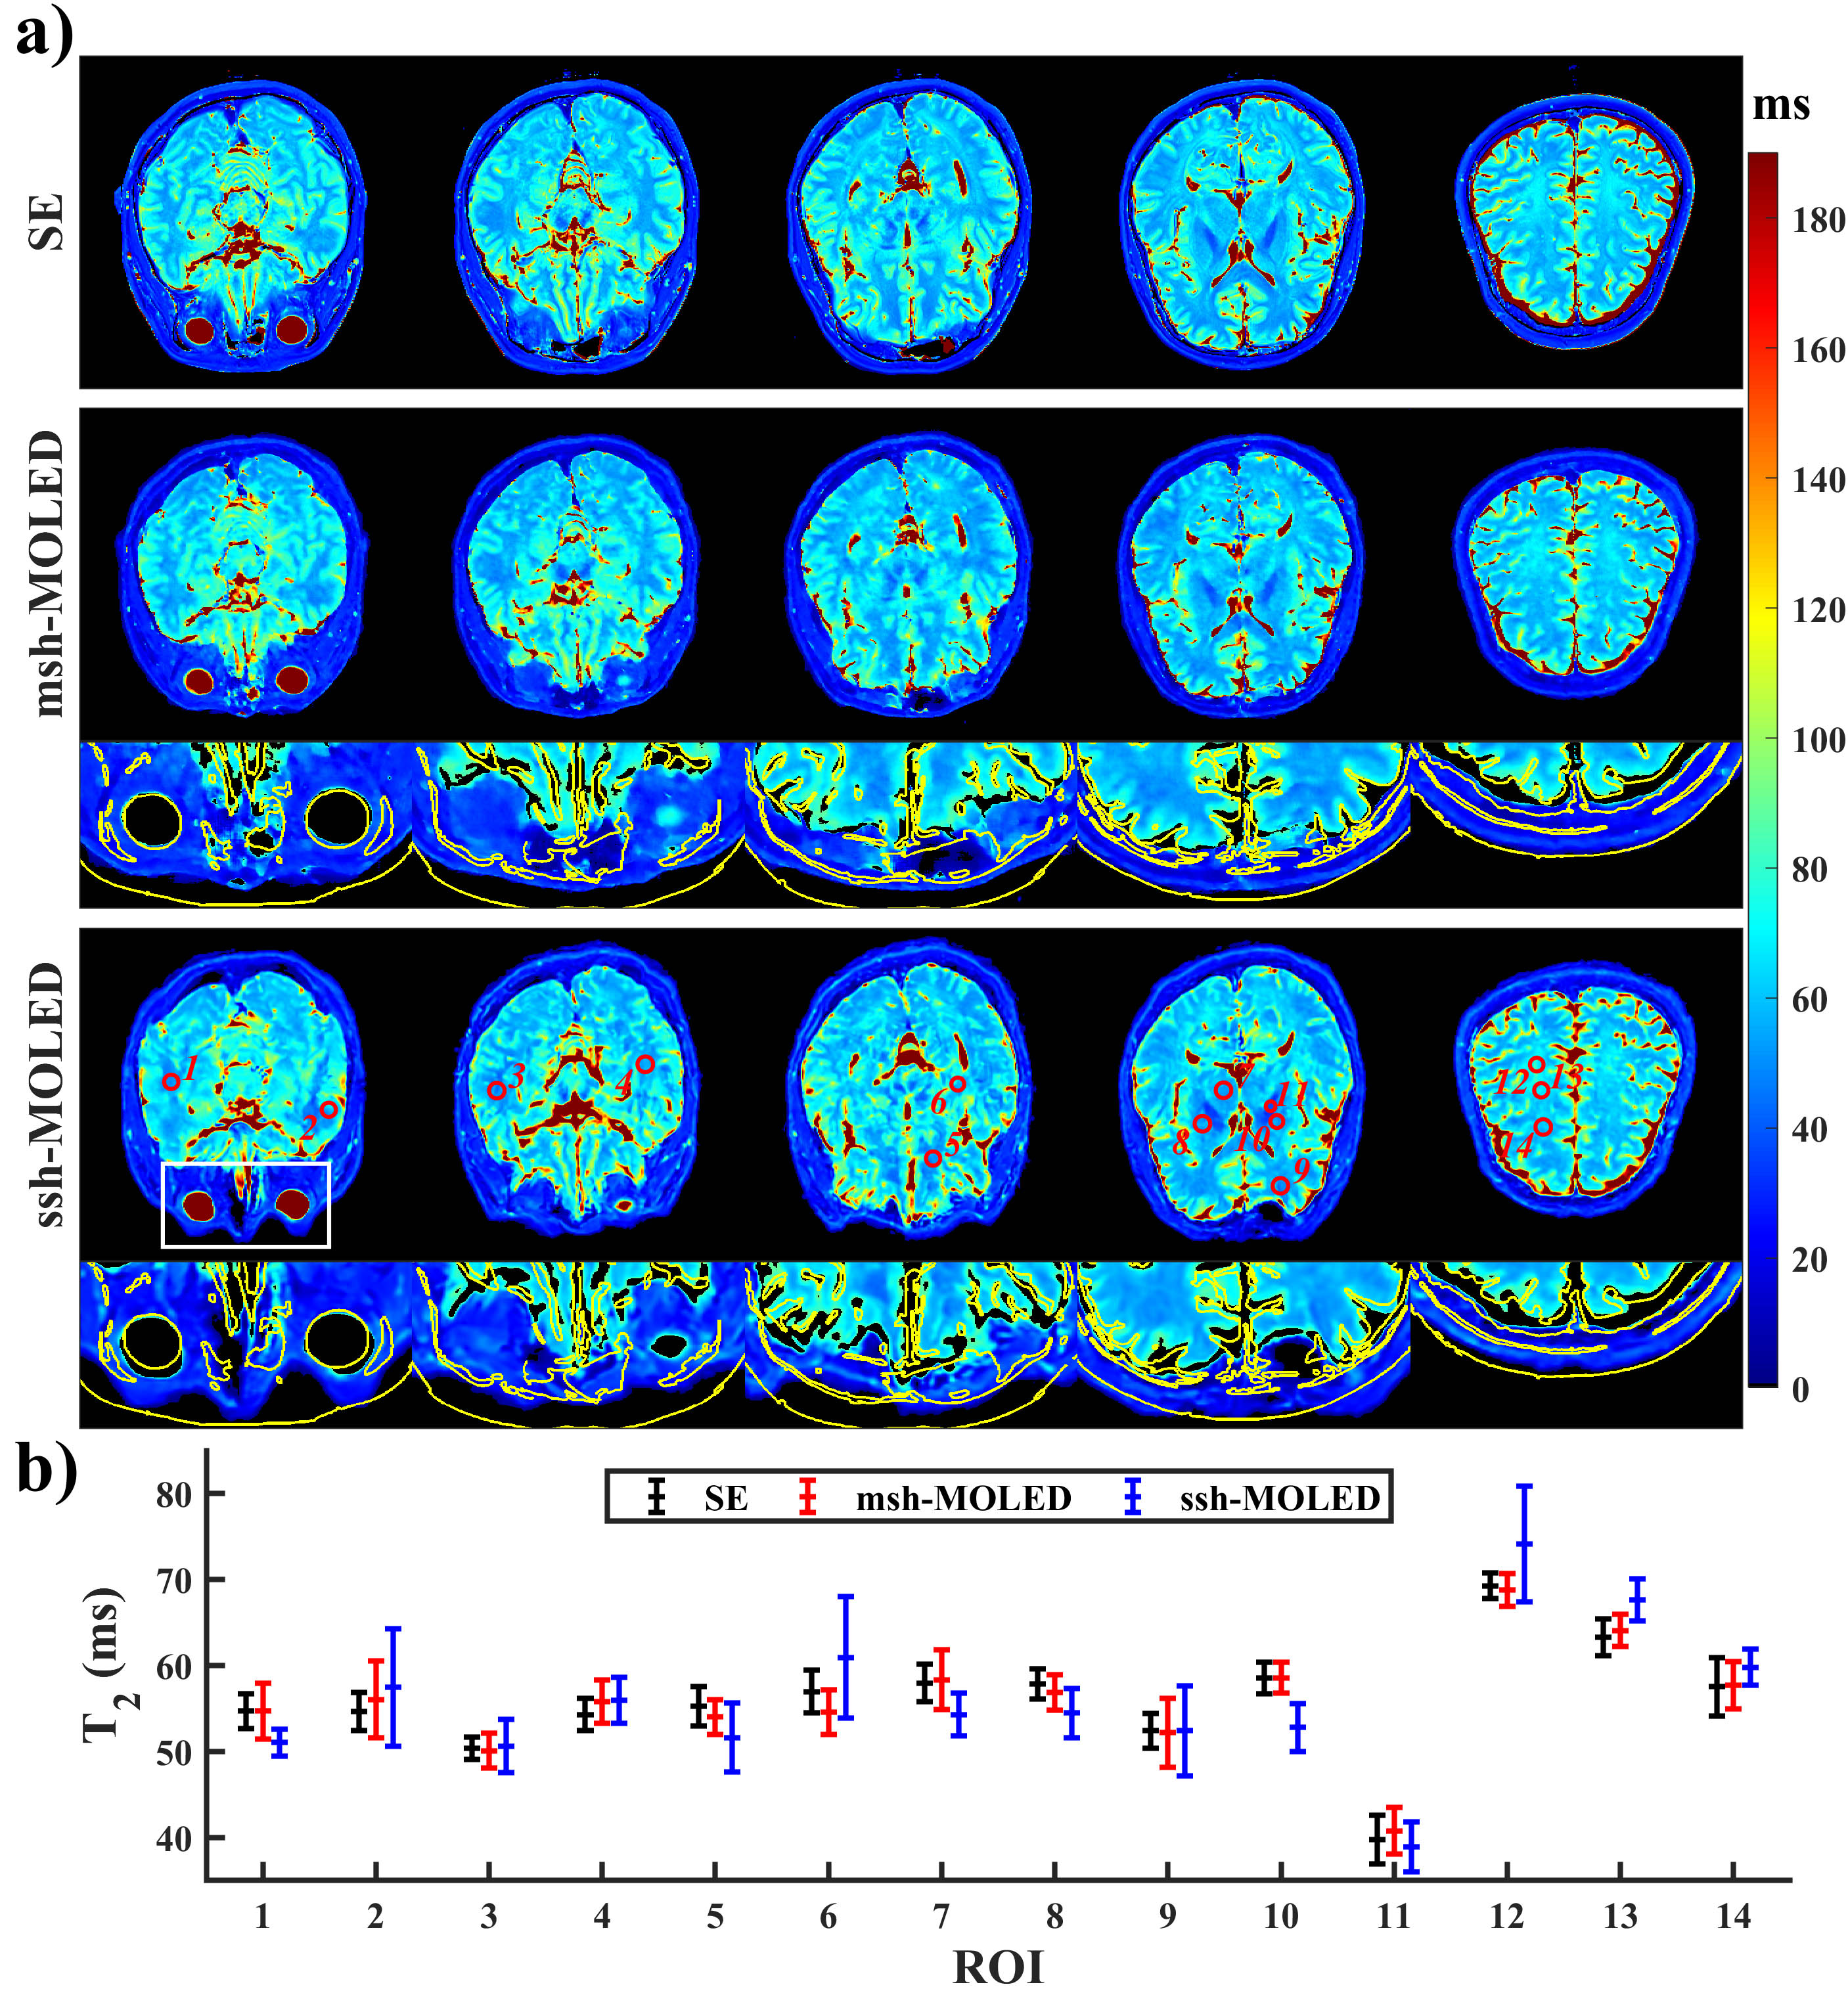
Figure 2 displays the results of two phantom experiments. Mean T2 values along with standard deviations (SDs) were calculated from circular regions of interest (ROIs), and the ROIs with mean T2 values over 120 ms were not counted (i.e., the 14th to 16th ROIs of the 3T results). The linear fitting between the reference T2 and msh-MOLED T2 gave a slope/y-intercept of 0.943/3.339 (R2 = 0.994) on 7T, and 1.054/-1.007 (R2 = 0.993) on 3T.Figure 3 displays the in vivo results. A threshold of 90 ms was used to roughly classify parenchyma and cerebrospinal fluid, and the edge of the parenchyma was calculated with the Canny operator.4 ROIs were manually delineated in the parenchyma area with limited B0-induced distortion, and Pearson’s correlation coefficient was 0.9151/0.9868 for ssh-/msh-MOLED. Facilitated by the spatial resolution, structures such as putamen (ROI: 8th and 10th), thalamus (7th), and globus pallidus (11th) were more exquisite in msh-MOLED and got a more accurate quantification compared with ssh-MOLED.
Discussion and conclusion
In this work, we proposed and verified a novel qMRI method that implements T2 mapping with submillimeter spatial resolution. Experiments on phantoms and the human brain demonstrated the accuracy of msh-MOLED, and various choices of scan parameters in different vendor scanners also defended its robustness and reproducibility. In contrast to the original ssh-MOLED, msh-MOLED allows more flexible imaging parameter choices, resulting in an overall improvement in image quality. For example, given a fixed BW in the phase-encoding direction, the geometric distortion induced by B0 inhomogeneity can be alleviated if the segment number increases; and the partial volume effect is also moderated when the voxel size decreases, resulting in a more accurate quantification as well as a more precise tissue classification (Figure 3). Besides, this method also ensures a high acquisition efficiency. For example, 48 slices with an isotropic in-plane resolution of 0.86 mm are accessible within 90 s. Future work on msh-MOLED would focus on its clinical practices that demand high spatial resolution and image fidelity, such as cartilage, prefrontal lobe, and posterior chamber, somewhere unreachable for ssh-MOLED.Acknowledgements
This work was supported in part by the Nation Natural Science Foundation of China under 11775184 and 22161142024.References
1. Kijowski R, Blankenbaker DG, del Rio AM, et al. Evaluation of the articular cartilage of the knee joint: Value of adding a T2 mapping sequence to a routine MR imaging protocol. Radiology. 2013; 267(2): 503-513.
2. Zhang J, Wu J, Chen SJ, et al. Robust single-shot T2 mapping via multiple overlapping-echo acquisition and deep neural network. IEEE Trans Med Imaging. 2019; 38(8): 1801-1811.
3. Ouyang BY, Yang QZ, Wang XY, et al. Single-shot T2 mapping via multi-echo-train multiple overlapping-echo detachment planar imaging and multitask deep learning. Med Phys. 2022. DOI:10.1002/mp.15820.
4. Canny J. A computational approach to edge-detection. IEEE Trans Pattern Anal Mach Intell. 1986; 8(6): 679-698.
Figures