0271
Full brain relaxometry at 7T in 3 minutes by accelerated MR-STAT using a low-SAR flip angle train1Computational Imaging Group for MR diagnostics & therapy, Center for Image Sciences, UMC Utrecht, Utrecht, Netherlands
Synopsis
Keywords: Quantitative Imaging, Quantitative Imaging
MR-STAT is a framework that enables the estimation of multi-parametric quantitative MR-maps from a single short scan. Quantitative imaging at 7T can be used to probe the brain’s microstructure at high resolution. We show the first results of MR-STAT at 7T and show that SAR-limitations and B1+-inhomogeneities can be successfully addressed by designing a low-SAR flip angle train and using a B1+-prior during reconstruction. In addition, we use the increased SNR at 7T to achieve two-fold acceleration of the MR-STAT acquisition and show that high quality parameters can be obtained both on a gel-phantom and in-vivo (full-brain) in 3 minutes.Introduction
MR-STAT1 is a framework that enables the estimation of multi-parametric quantitative MR-maps from time-domain data of a single short scan. Here, the quantitative parameters are encoded into the signal by using a combination of Cartesian gradient encoding and a time-varying flip angle train creating a non-balanced transient-state sequence. Quantitative parameter maps are obtained by directly solving for spatial localization and estimating the tissue parameters in a single large-scale non-linear optimization. Quantitative imaging at high field (≥7T) can be used to probe the brain’s microstructure at high resolution and can yield insights into e.g., the myelination, oxygenation and iron content distribution2–5. The two main challenges of quantitative imaging at 7T are SAR-limitations and B1+-inhomogeneities. Here, SAR limits the root-mean-square (RMS) flip angle allowed in the flip angle train which affects the SNR of the parameter encoding. B1+-inhomogeneities, on the other hand, can lead to a bias in estimated tissue parameters when it is not properly modelled. In this work, we demonstrate that the MR-STAT framework can be applied at high field (7T) by using a 7T optimized low-SAR flip angle train and a B1 prior. Additionally, we show that the increased SNR at 7T can be used to shorten scan time of the MR-STAT acquisition by allowing for two-fold undersampling leading to a full brain protocol of 3 minutes.Methods
ExperimentsA transient state gradient spoiled sequence was used to acquire data in a gel-phantom (TO5, Eurospin II test system, Scotland) and a volunteer on a 7T MR-scanner (Philips, The Netherlands) using a 32-channel receive array (Nova Medical, USA) with the following imaging parameters: voxel size=1x1 mm2, slice thickness=3 mm, FOV=224x224 mm2, Nslices = 5 (gel-phantom) or 27 (in-vivo), slice gap =1.5 mm, TR=11 ms and TE=5.5 ms. To encode the quantitative parameters, five Cartesian k-spaces were acquired per slice with each k-space featuring two-fold undersampling (Figure 1).
The BLAKJac6 framework was used to design a flip angle train that minimizes the noise in the estimated T1, T2 and proton-density (ρ) while adhering to the SAR limits by limiting the RMS-flip angle. Here, the flip angle train was optimized specifically for low SAR and using higher T1 and lower T2 ranges in the brain which are typical for 7T. This resulted in an optimized flip angle train featuring an RMS-flip angle of 35 degrees and a maximum flip angle of 72 degrees (Figure 1). Each slice also featured an initial adiabatic inversion pulse (hyperbolic secant) with a 10 ms inversion delay. The scan time per slice was 6.2 s, which yielded a total scan time of 2:47 [min:s] for the whole-brain acquisition.
B1+-inhomogeneities were included in the MR-STAT framework by initializing the MR-STAT reconstruction with a measured B1+-map which was kept fixed during the reconstruction. This B1+-mapping was performed using a DREAM7 B1+-mapping sequence with a STEAM angle of 40 degrees, a 3.5x3.5x3.5 mm3 isotropic resolution, whole-brain/phantom coverage and a 13 second scan time.
Reconstruction
The MR-STAT reconstructions were performed on a GPU (NVIDIA, Titan X) using a reconstruction algorithm written in the Julia programming language8. To initialize this algorithm, the B1+-map and coil sensitivities were re-gridded to the target resolution of 1 x 1 mm2 in-plane.
Results
Figure 2 shows the quantitative maps and B1+-maps for the gel-phantom. Here, a large B0-inhomogeneity (~400 Hz) was observed to cause artefacts in the top of the phantom at an air-water boundary, which could not be mitigated by B0-shimming. The reconstructed quantitative values (Figure 3) featured a mean relative error of 3.2% for T1 and 8.4% for T2. The largest deviations in T2 an T1 were observed in the tubes suffering from the B0-inhomogeneities while an overestimation of the T2-values was observed for T2>100 ms.Figure 4 shows the in-vivo quantitative parameters maps and B1+-maps for several slices in the brain. All parameter maps show a high contrast-to-noise ratio allowing for a clear distinction between gray and white matter. A bias in T2 and T1-values was observed in the lower part of the brain due to a bias in the B1+-mapping at extremely low B1+(<40% of the demanded B1+) and B0-inhomogeneities from the ear cavities resulting in imperfect inversion. In addition, the T2-maps featured some artefacts in slice #12 caused by blood pulsation.
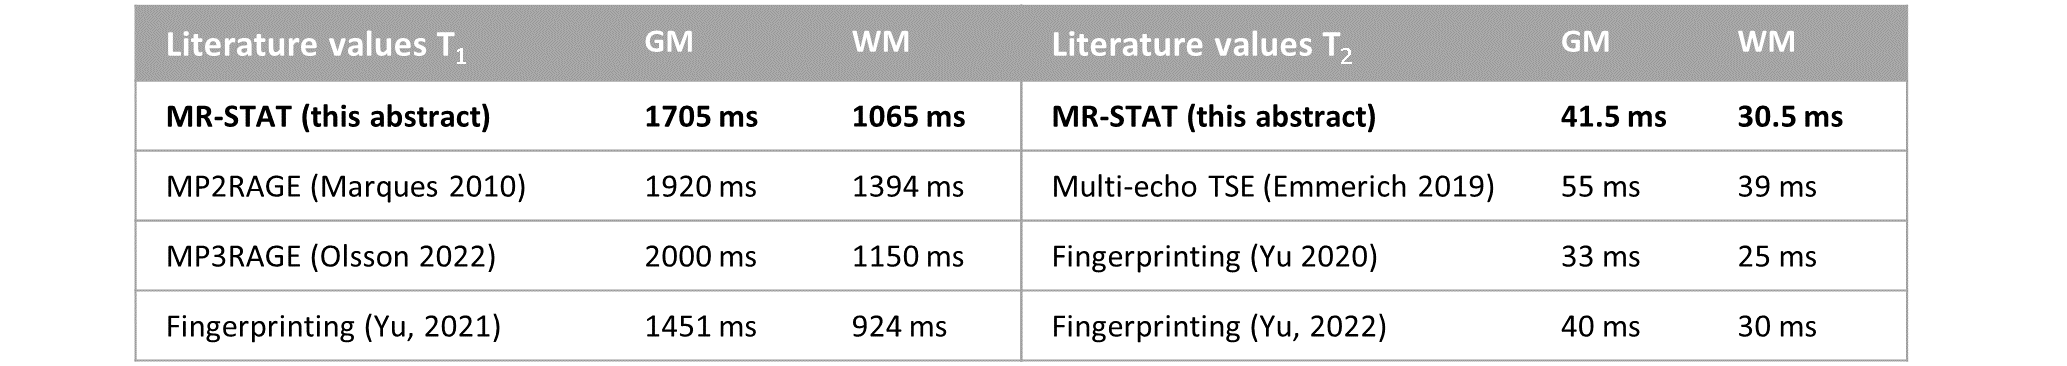
Table 1 shows the quantitative values for gray/white matter. Here, the T1 and T2-values of gray/white matter fall in the range of values earlier reported in literature9–12.
Discussion and Conclusion
In this work, we demonstrated an accelerated MR-STAT acquisition at 7T that yielded high-quality quantitative parameters maps both in-vitro and on a full-brain in three minutes. This was possible due to the use of a flip angle train that was optimized for low SAR, and T1 and T2 values occurring at 7T using the BLAKJac framework. In addition, we showed that B1+-sensitivity of the parameters mapped could be reduced by incorporating measured B1+-maps which could be further improved by either using an inversion pulse with a lower B1+-sensitivity (e.g. TR-FOCI13) or by fully omitting the inversion pulse. The results from this work also indicate that ample SNR is still available at two-fold acceleration which might enable additional acceleration in the future.Acknowledgements
This work has been financed by NWO grant number 18951References
1. Sbrizzi A, Heide O van der, Cloos M, et al. Fast quantitative MRI as a nonlinear tomography problem. Magn. Reson. Imaging 2018;46:56–63 doi: 10.1016/J.MRI.2017.10.015.
2. Callaghan MF, Helms G, Lutti A, Mohammadi S, Weiskopf N. A general linear relaxometry model of R1 using imaging data. Magn. Reson. Med. 2015;73:1309–1314 doi: 10.1002/MRM.25210.
3. Bhogal AA, Siero JCW, Zwanenburg J, Luijten PR, Philippens MEP, Hoogduin H. Quantitative T1 mapping under precisely controlled graded hyperoxia at 7T. J. Cereb. Blood Flow Metab. 2017;37:1461–1469 doi: 10.1177/0271678X16656864.
4. Waehnert M, Dinse J, Schäfer A, Geyer S, Neuroimage PB-, 2016 undefined. A subject-specific framework for in vivo myeloarchitectonic analysis using high resolution quantitative MRI. Elsevier.
5. Fritz FJ, Poser BA, Roebroeck A. MESMERISED: Super-accelerating T1 relaxometry and diffusion MRI with STEAM at 7 T for quantitative multi-contrast and diffusion imaging. Neuroimage 2021;239:118285 doi: 10.1016/j.neuroimage.2021.118285.
6. Fuderer M, van der Heide O, Liu H, van den Berg CAT, Sbrizzi A. Efficient performance analysis and optimization of transient-state sequences for multi-parametric MRI. NMR Biomed. 2022 doi: 10.1002/nbm.4864.
7. Nehrke K, Börnert P. DREAM-a novel approach for robust, ultrafast, multislice B1 mapping. Magn. Reson. Med. 2012;68:1517–1526 doi: 10.1002/mrm.24158.
8. van der Heide O, Sbrizzi A, van den Berg CAT. Faster Bloch simulations and MR-STAT reconstructions on GPU using the Julia programming language. In: Proceedings of the 30th Annual Meeting of ISMRM. ; 2021. p. 3063.
9. Marques JP, Kober T, Krueger G, van der Zwaag W, Van de Moortele PF, Gruetter R. MP2RAGE, a self bias-field corrected sequence for improved segmentation and T1-mapping at high field. Neuroimage 2010;49:1271–1281 doi: 10.1016/j.neuroimage.2009.10.002.
10. Yu Z, Madelin G, Sodickson DK, Cloos MA. Simultaneous proton magnetic resonance fingerprinting and sodium MRI. Magn. Reson. Med. 2020;83:2232–2242 doi: 10.1002/mrm.28073.
11. Yu Z, Hodono S, Dergachyova O, et al. Simultaneous 3D acquisition of 1H MRF and 23Na MRI. Magn. Reson. Med. 2022;87:2299–2312 doi: 10.1002/mrm.29135.
12. Olsson H, Andersen M, Kadhim M, Helms G. MP3RAGE: Simultaneous mapping of T1 and B1+ in human brain at 7T. Magn. Reson. Med. 2022;87:2637–2649 doi: 10.1002/mrm.29151.
13. Hurley AC, Al-Radaideh A, Bai L, et al. Tailored RF pulse for magnetization inversion at ultrahigh field. Magn. Reson. Med. 2010;63:51–58 doi: 10.1002/mrm.22167.
Figures
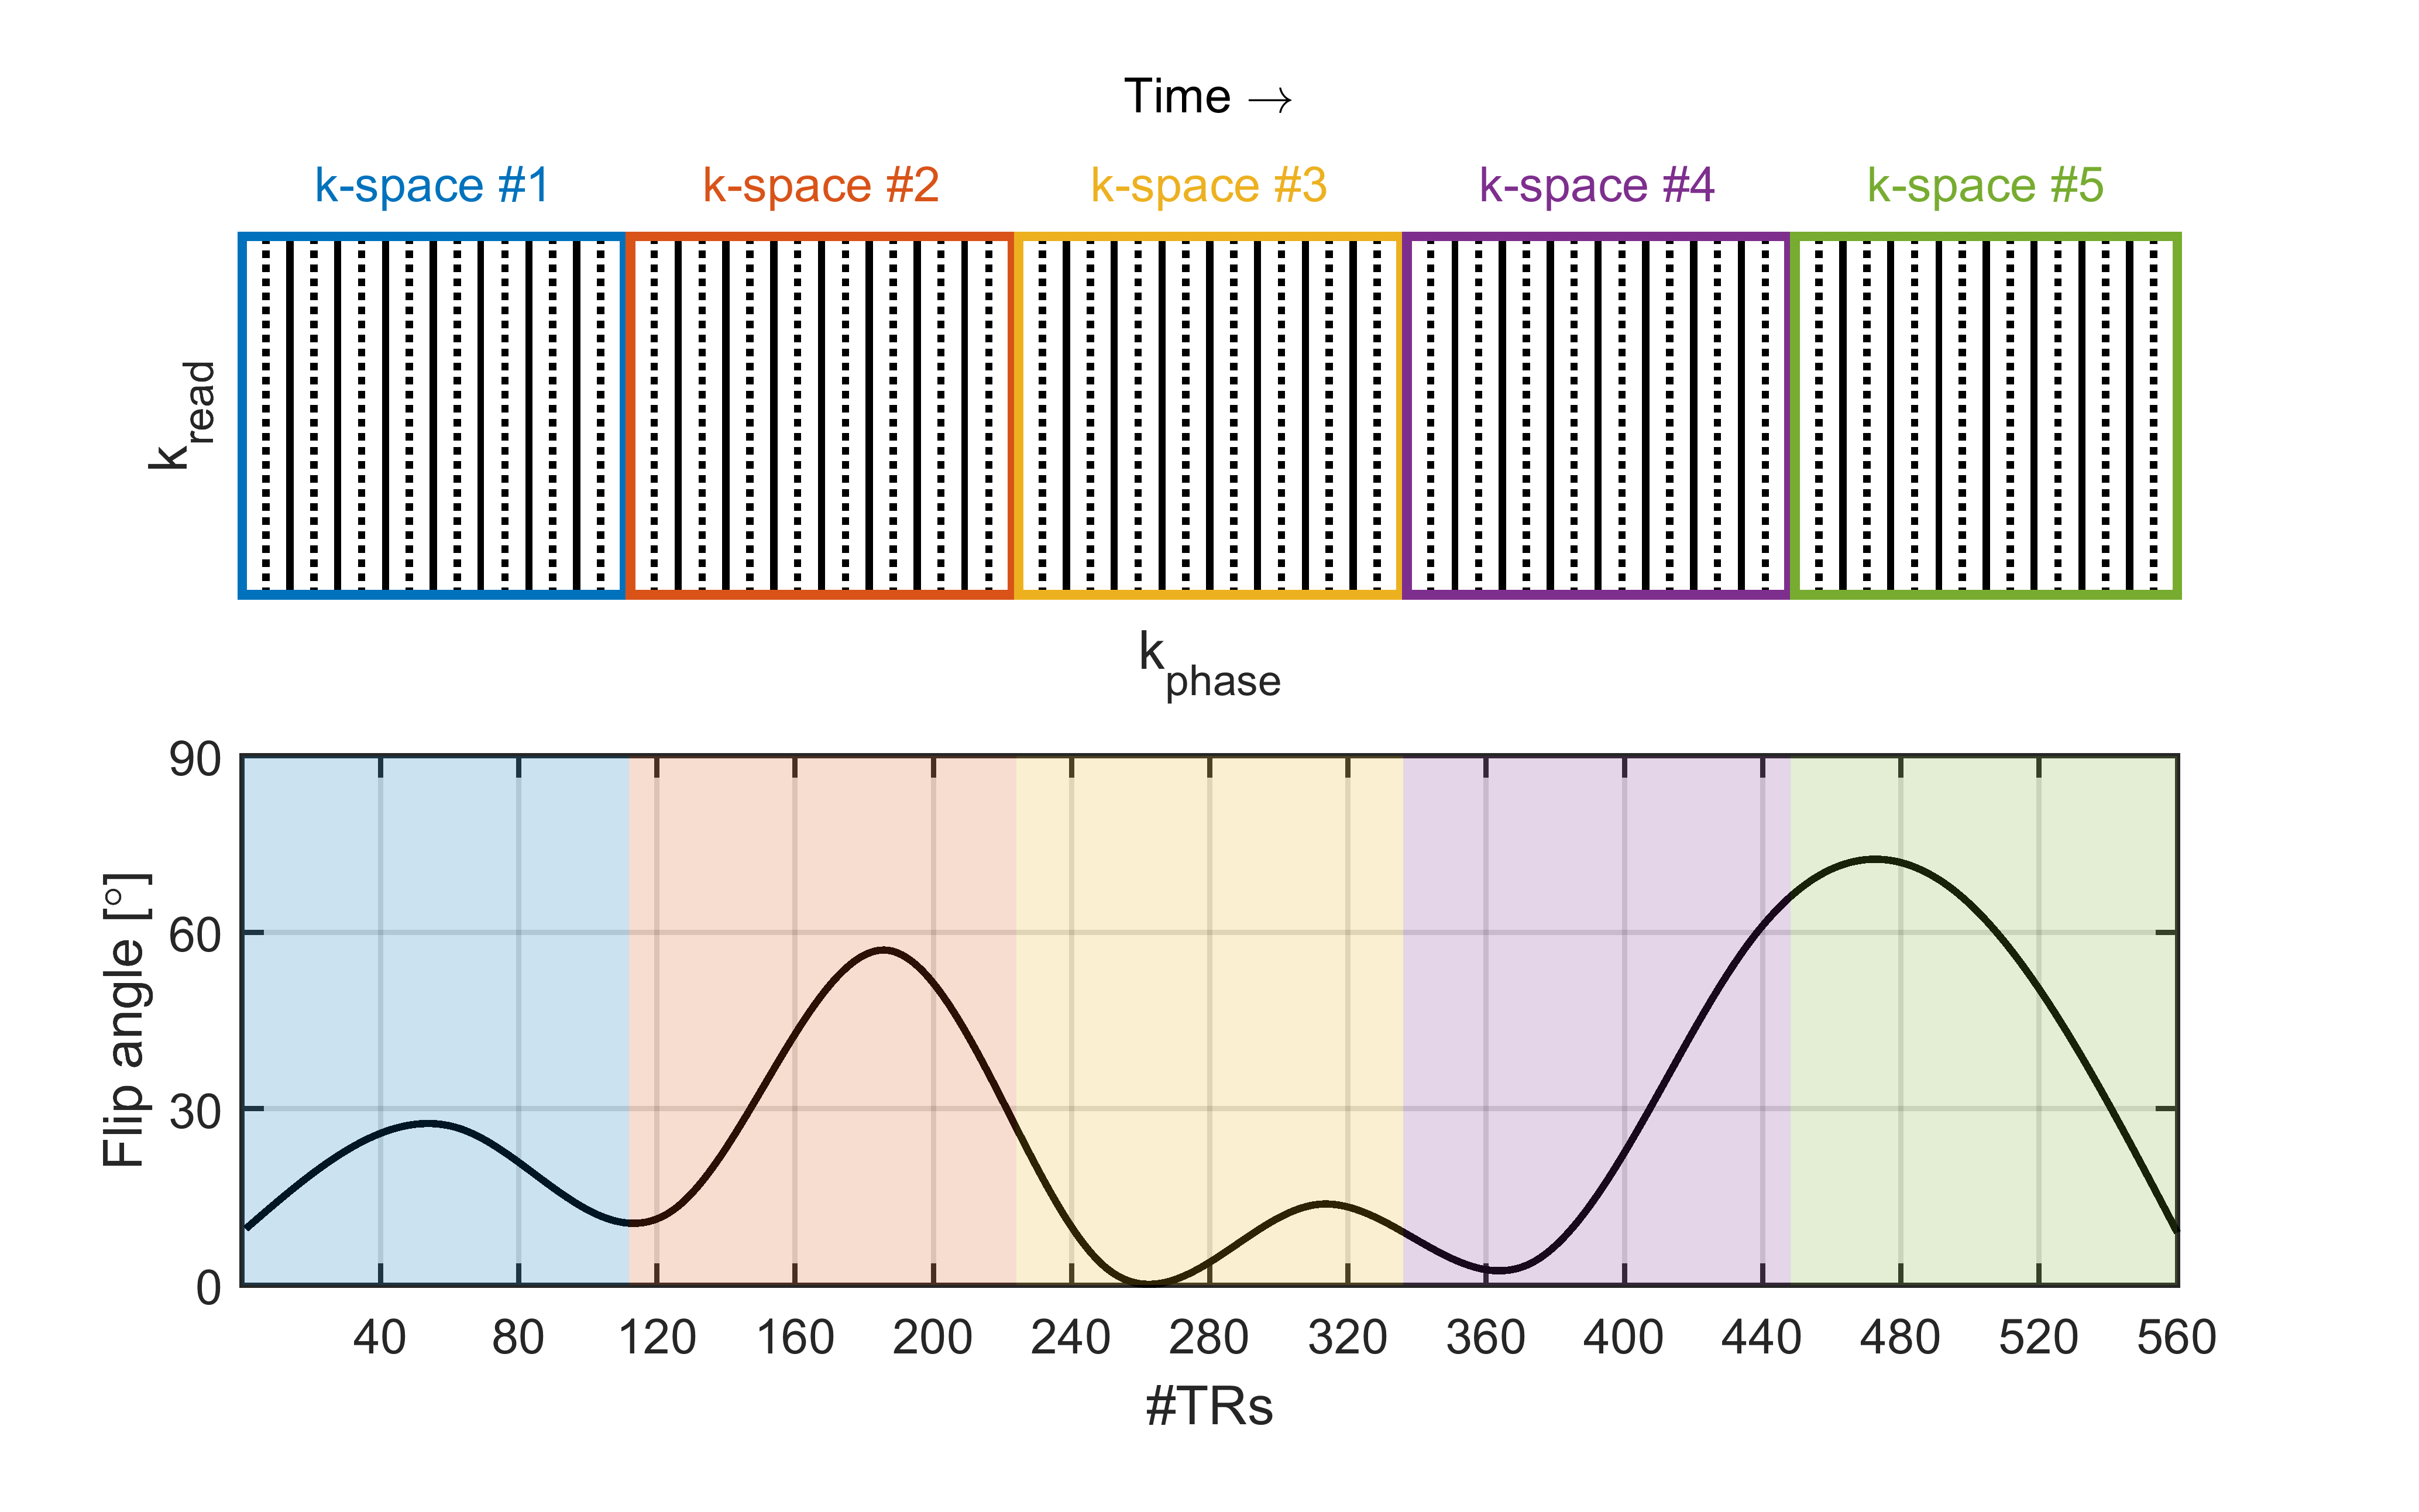
Figure 1 Top: A schematic depiction of the sampling scheme for the accelerated MR-STAT acquisition. Five k-spaces were acquired which were two-fold undersampled (indicated by the solid lines). Bottom: the BLAKJac-optimized low SAR flip angle train.
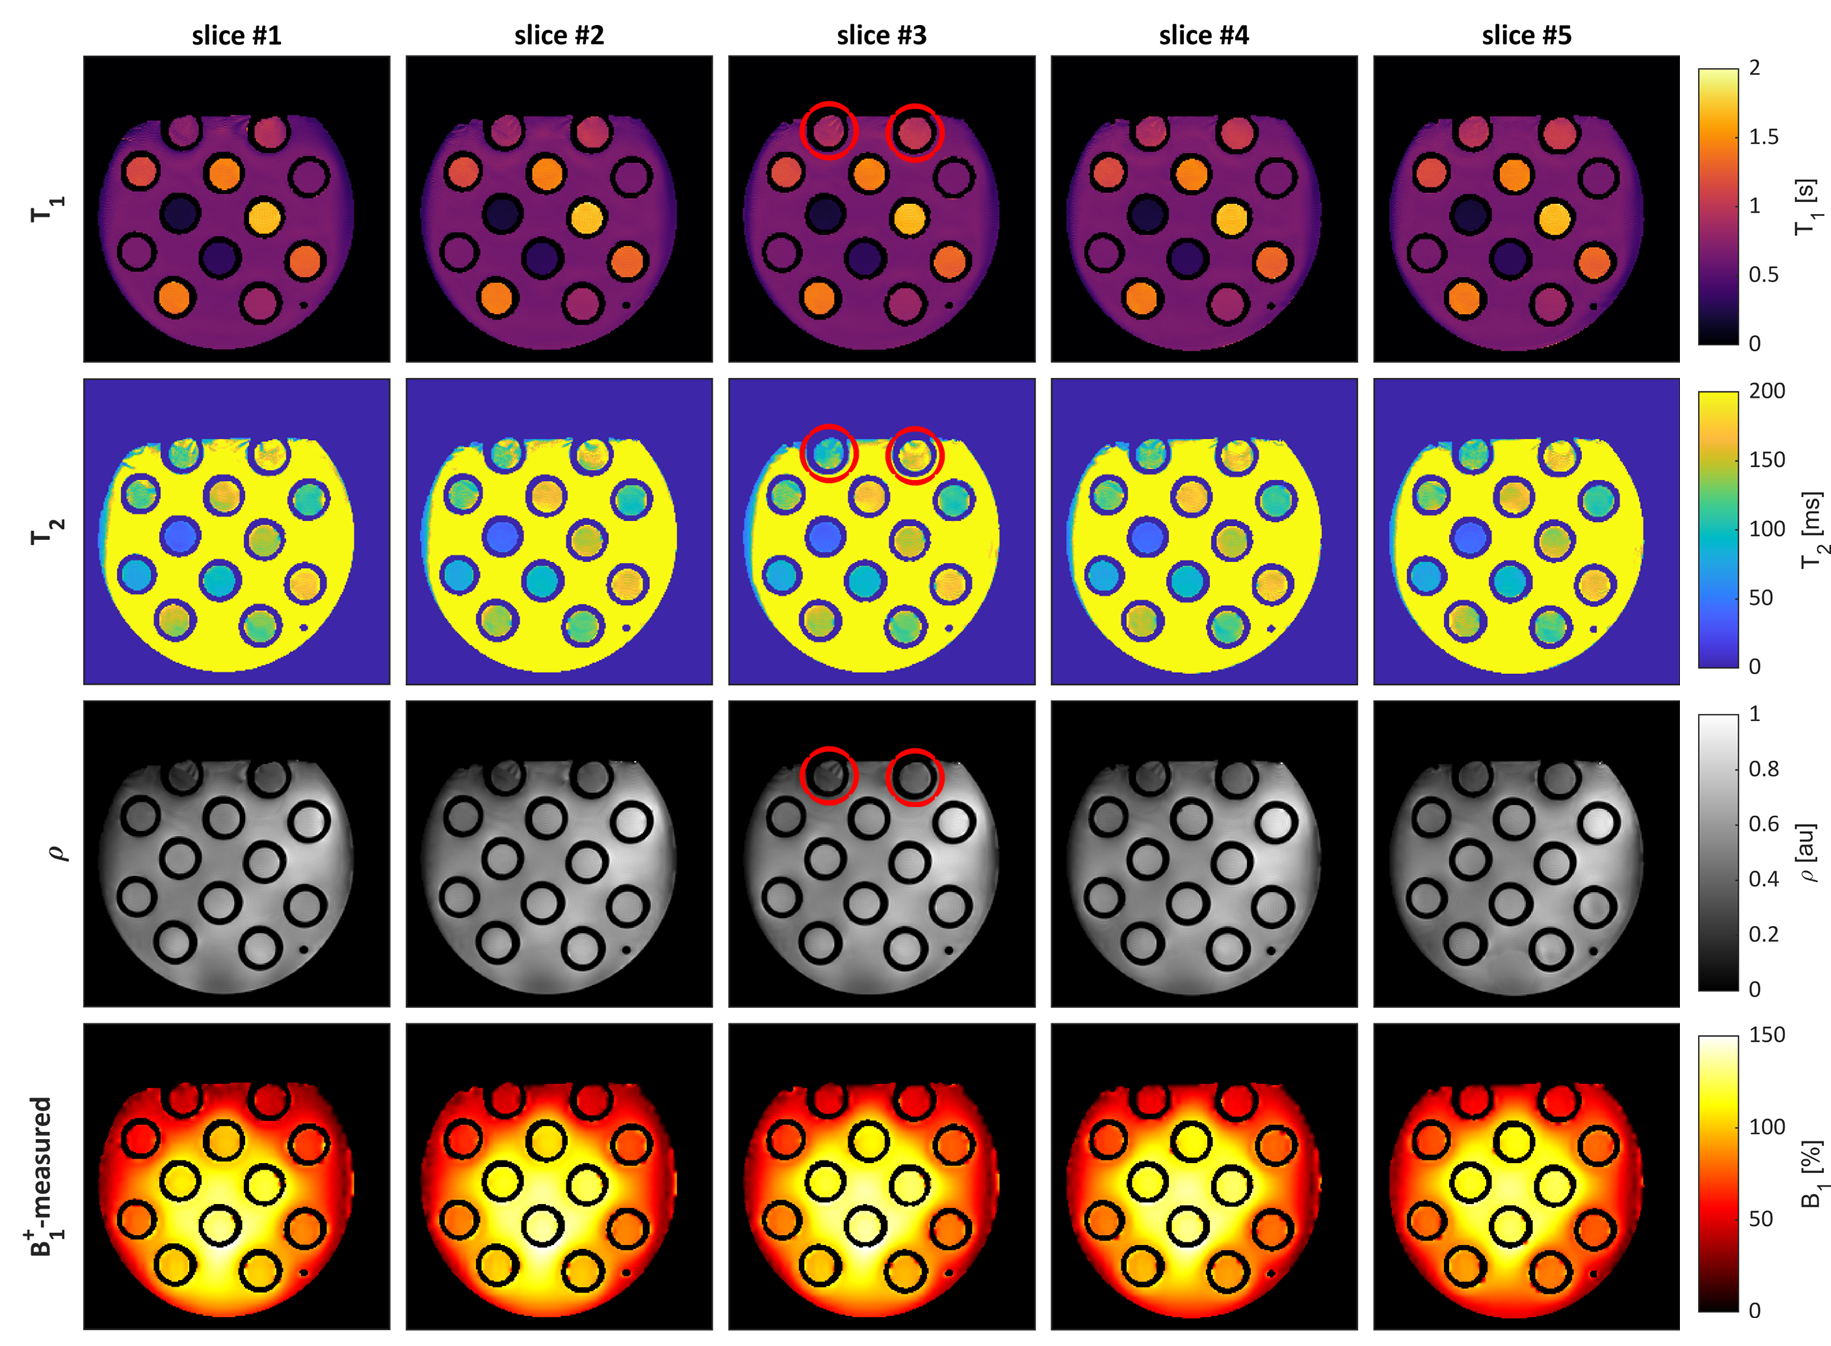
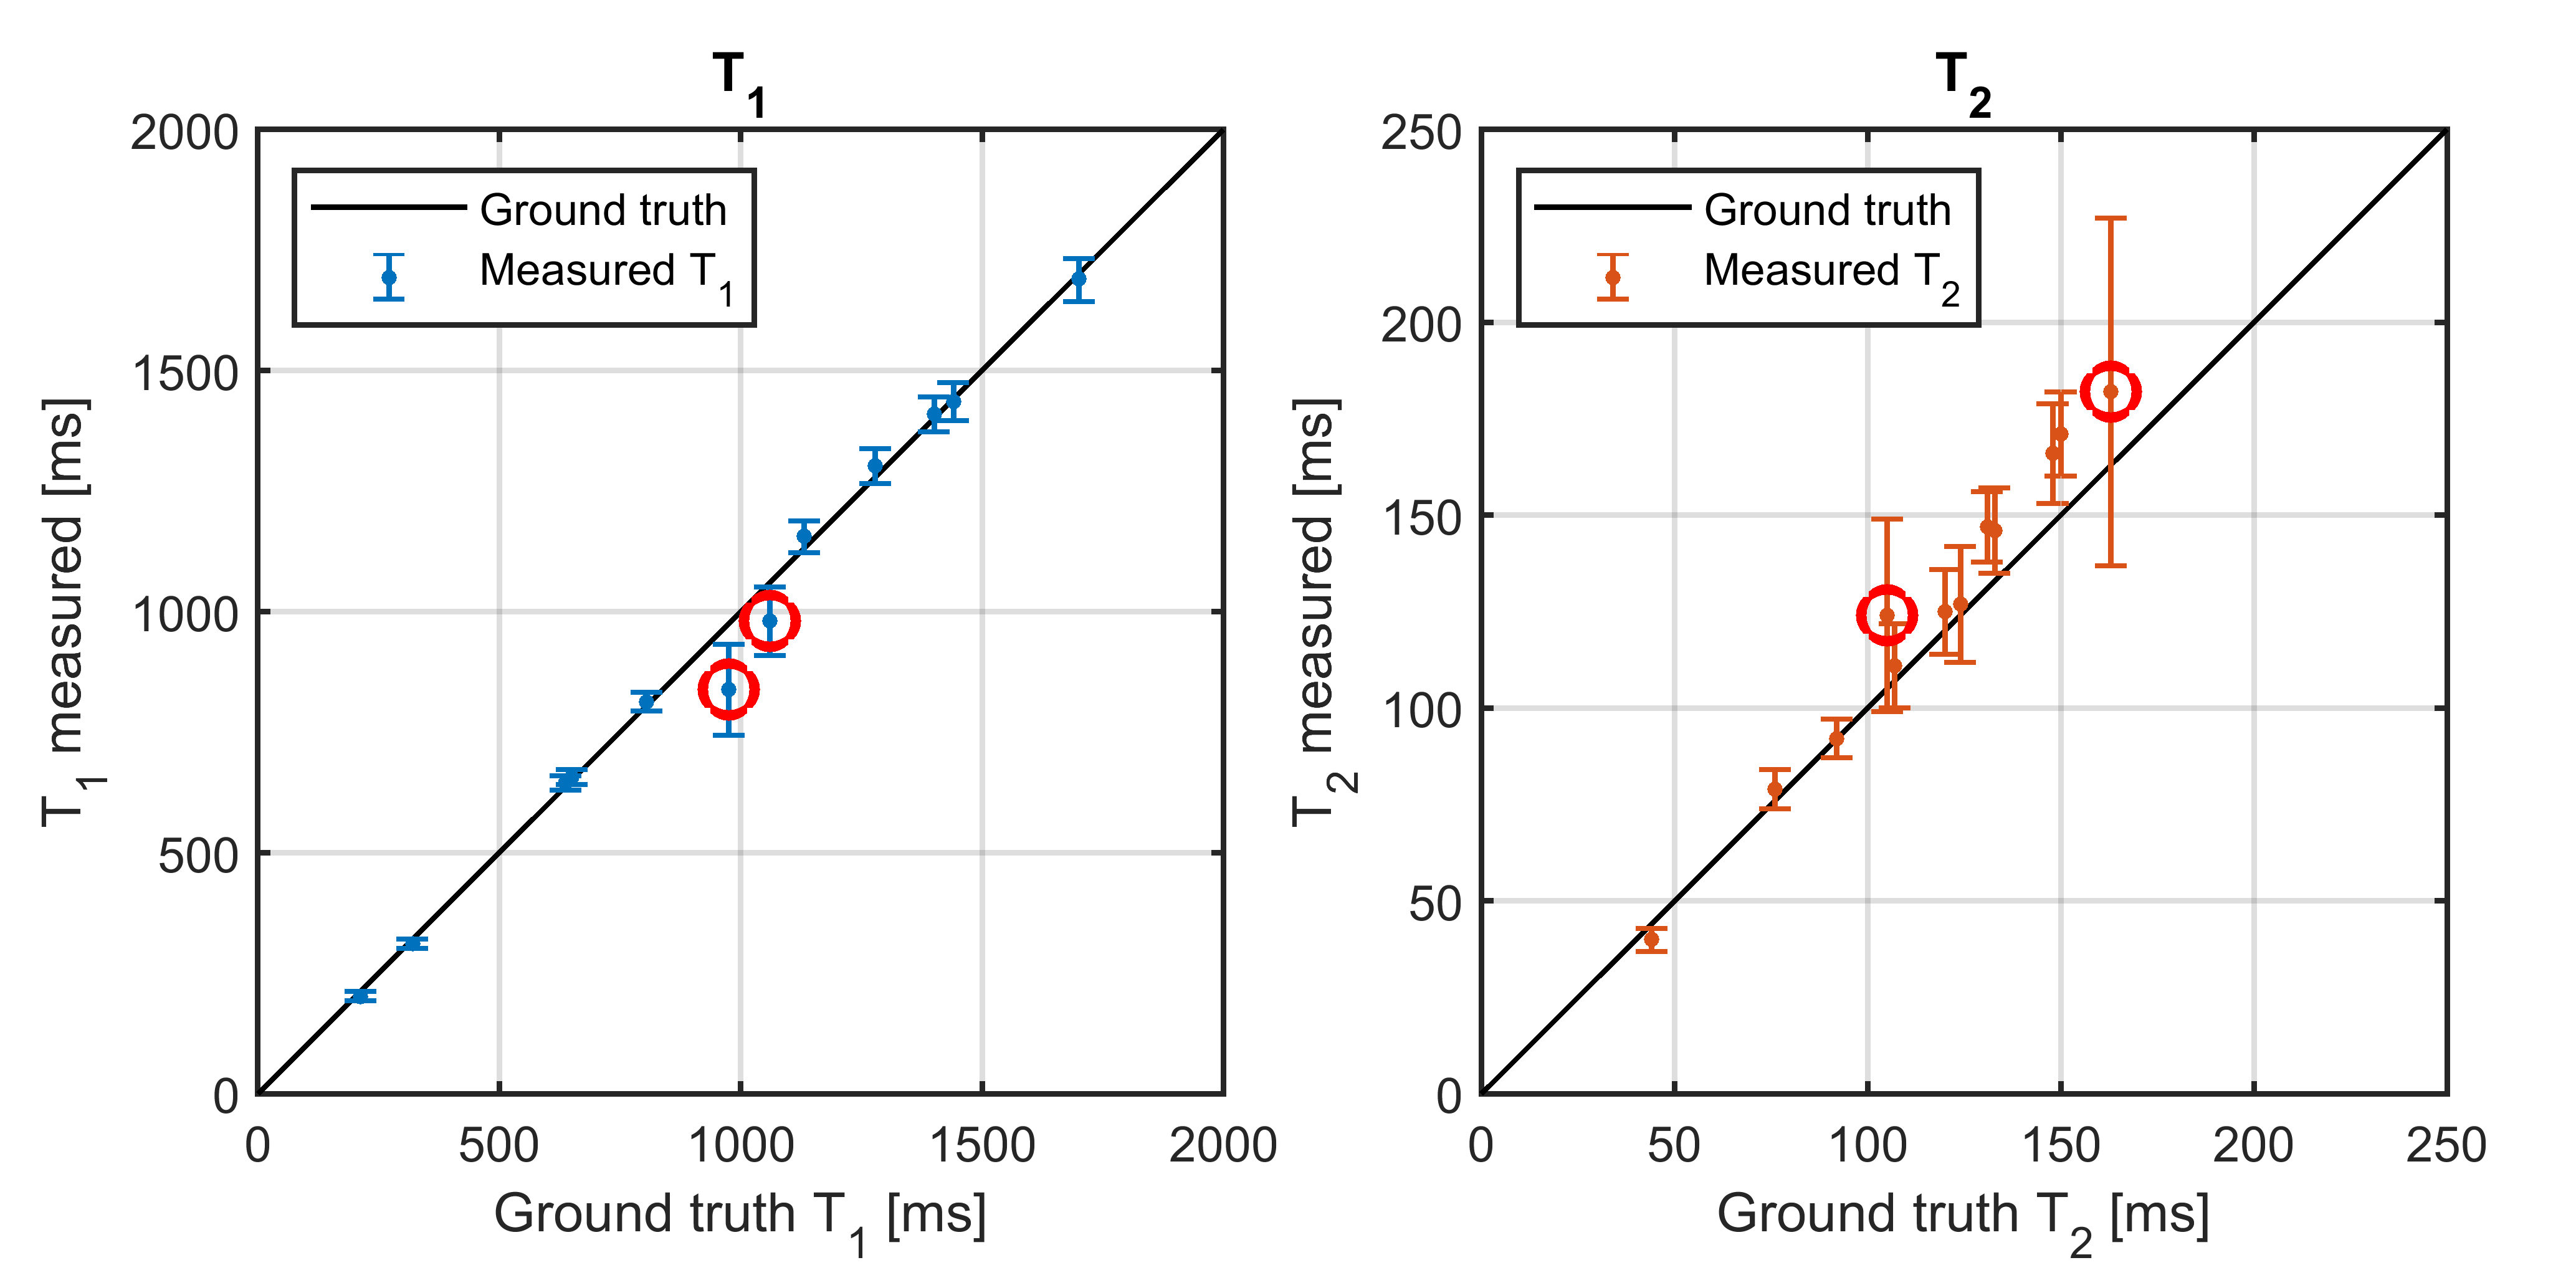
Figure 3 Plot of the measured T1 and T2 values versus the ground truth of values with the error bars indicating the standard deviation in the tube. Note that the two tubes (indicated by the red circles) with the largest deviation in T1-value are the ones located close to the B0-inhomogeneity. Ground truth values were obtained by acquiring a series of inversion recovery spin-echo acquisitions (T1) and single-echo spin echo acquisitions (T2) at varying inversion and echo times.
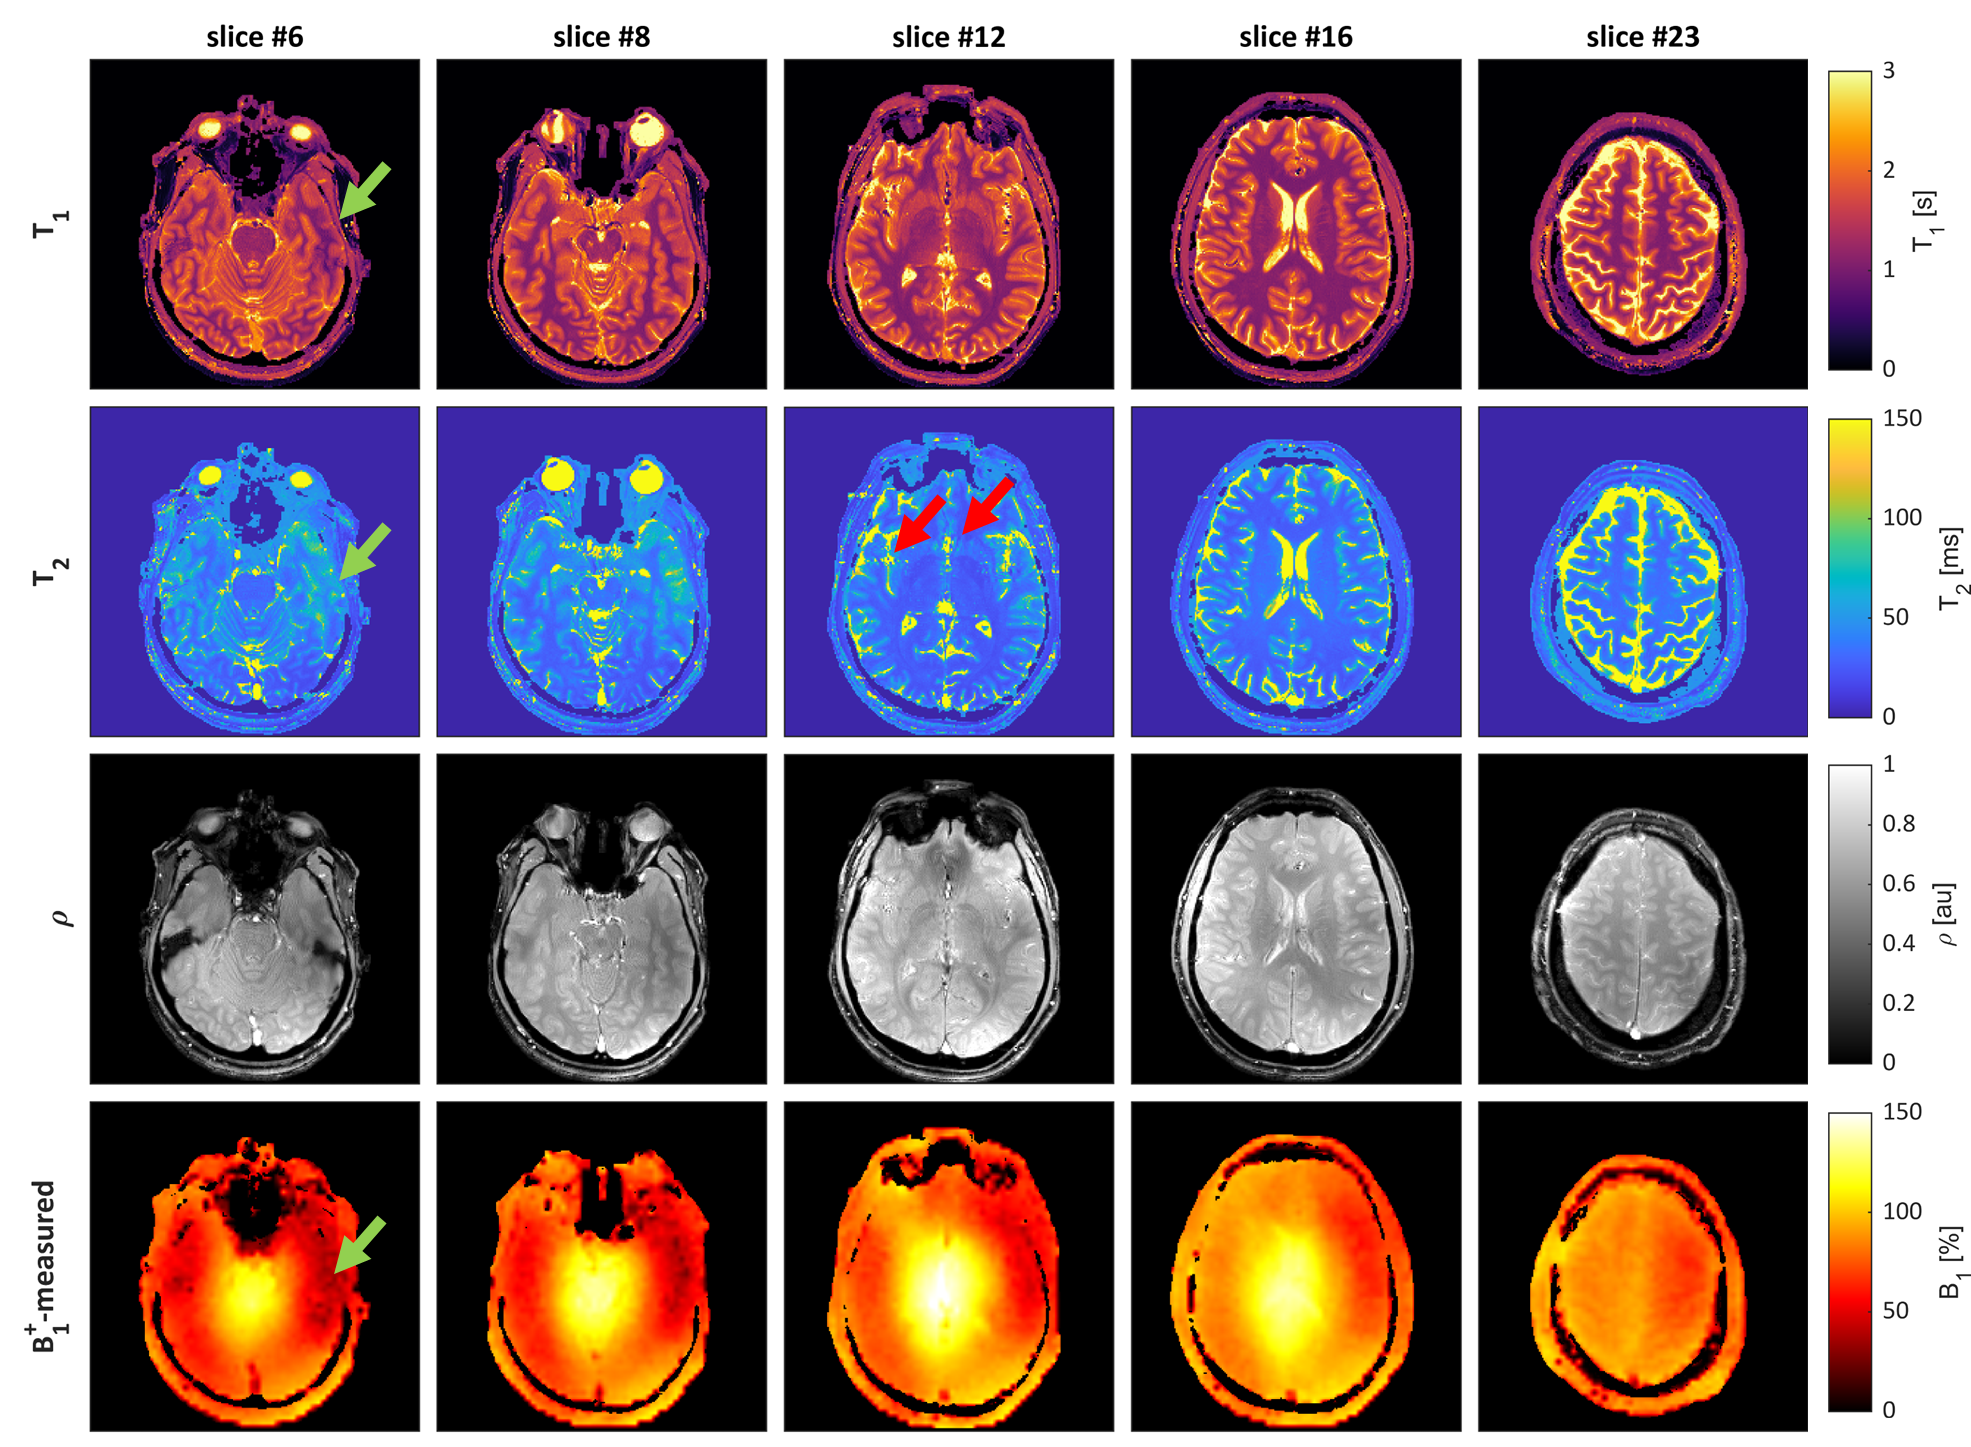
Figure 4 The estimated parameter maps (T1, T2 and proton-density) and the measured and re-gridded B1+-maps for 5 representative slices from the in-vivo acquisition. The green arrows indicate an area where extremely low B1+ caused a bias in T1 and T2 values while the red arrows point to pulsation artefacts caused by blood flow.