0270
High-resolution whole-brain multi-parameter mapping at 7 Tesla with interleaved fly-back 3D-EPI and universal pTX pulses1German Center for Neurodegenerative Diseases (DZNE), Bonn, Germany, 2Commissariat à l’Energie Atomique, CNRS, NeuroSpin, Baobab, Université Paris-Saclay, Gif sur Yvette, France, 3GIGA - Cyclotron Research Centre - In Vivo Imaging, University of Liège, Liège, Belgium, 4Department of Neurology, University Hospital Bonn, Bonn, Germany, 5Department of Physics and Astronomy, University of Bonn, Bonn, Germany
Synopsis
Keywords: Quantitative Imaging, High-Field MRI, MPM, QSM, 3D-EPI
We present a versatile high-resolution whole-brain multiparametric/susceptibility mapping protocol at 7T, introducing interleaved fly-back skipped-CAIPI 3D-EPI. To overcome the impeding limitations of B1+ inhomogeneity, universal pTX pulses for excitation and magnetization transfer saturation are employed. Within 17 minutes scan time, 0.6mm isotropic whole-brain MT-/PD-/T1-weighted magnitude and phase images at four echo times and corresponding quantitative parameter maps are obtained. Supplementary output, like SWI and MPRAGE-like images can be generated as well. Scan efficiency is high and geometric distortions are negligible. Optionally, the interleaved fly-back acquisition allows a separate analysis of two monopolar readout images.Introduction
Combining multiparametric mapping (MPM)1 with scan-efficient segmented 3D-EPI has been shown to provide reliable quantitative parameter maps at 1mm isotropic resolution within only 3 minutes at 3T.2 At 7T, results were yet compromised mainly by inhomogeneous B1+. In this study, targeting the cerebellum, we tackle those problems by using universal parallel transmit (pTX) excitation3 and magnetization transfer (MT) saturation pulses. At the same time, by introducing a scan-efficient interleaved fly-back EPI readout, sensitivity to off-resonance artifacts and other scan imperfections is reduced. The two simultaneously acquired monopolar magnitude and phase images per contrast can either be analyzed separately or averaged before analysis.Methods
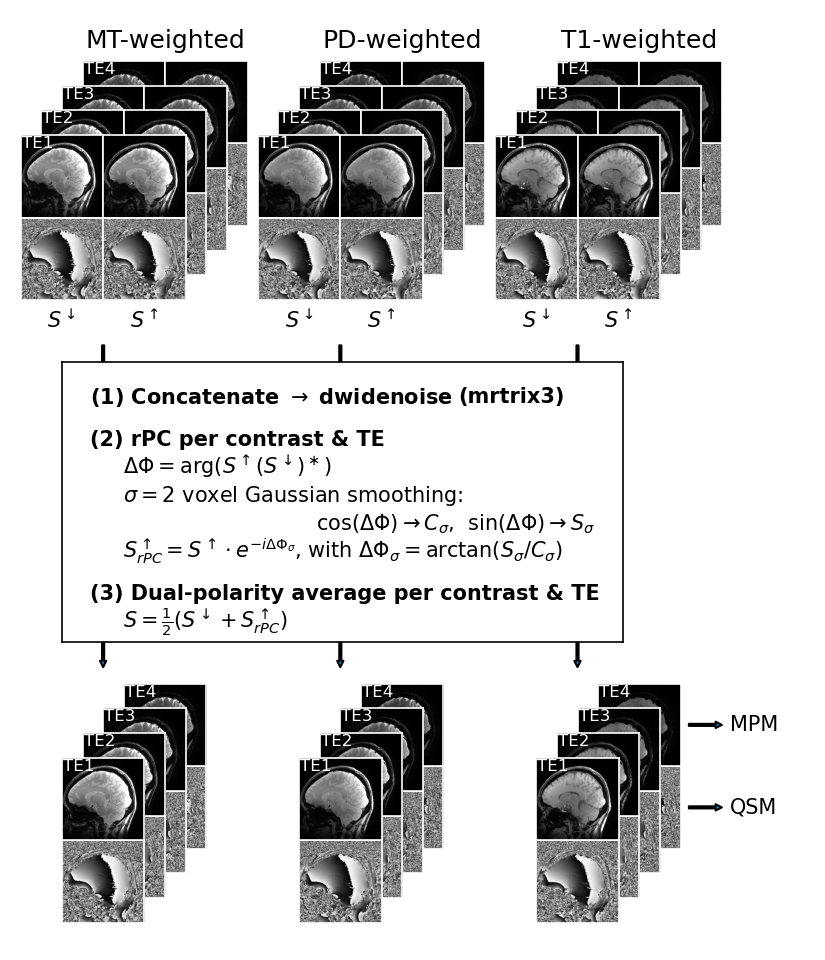
A custom segmented multi-echo 3D-EPI sequence with skipped-CAIPI sampling4 is used for all images acquired with a Siemens MAGNETOM 7TPlus system (Siemens, Healthineers) with a 32Rx/8Tx head coil. Three major novelties have been implemented:- As depicted in Fig. 1, two monopolar multi-echo images, S↓ and S↑, are acquired simultaneously by combining an interleaved fly-back EPI readout with skipped-CAIPI sampling (3x2z1, segmentation factor 23, partial Fourier 6/8, EPI factor 4, FOV=216x216x192mm3, 0.6mm isotropic resolution, TE=[5.3, 12.2, 19.1, 26.0]ms, TR/nominal FA/TA for MTw, PDw, T1w: 48ms/6°/6:08min, 34.5ms/4°/4:28min, 34.5ms/25°/4:28min). Remaining phase inconsistencies of S↑ compared to S↓, can be corrected retrospectively in image space as shown in Fig. 2 (S↑rPC).
- Either simple CP-mode water excitation5 or pTX interleaved binomial 5-kT-points excitation6 is performed (“X” in Fig. 1A). For MT saturation (“S” in Fig. 1A), either a 10ms CP-mode Gaussian pulse (nominal FA=200°), or 10ms pTX saturation based on pulse design for homogeneity (PUSH)7 is performed.
- To avoid time-consuming, on-line pTX pulse computations, universal excitation and MT saturation pTX pulses3 – optimized for the whole-brain, based on a pre-acquired B1+ and B0 data base of 10 subjects – are used. The latter homogenizes the root-mean-squared B1+.
Results
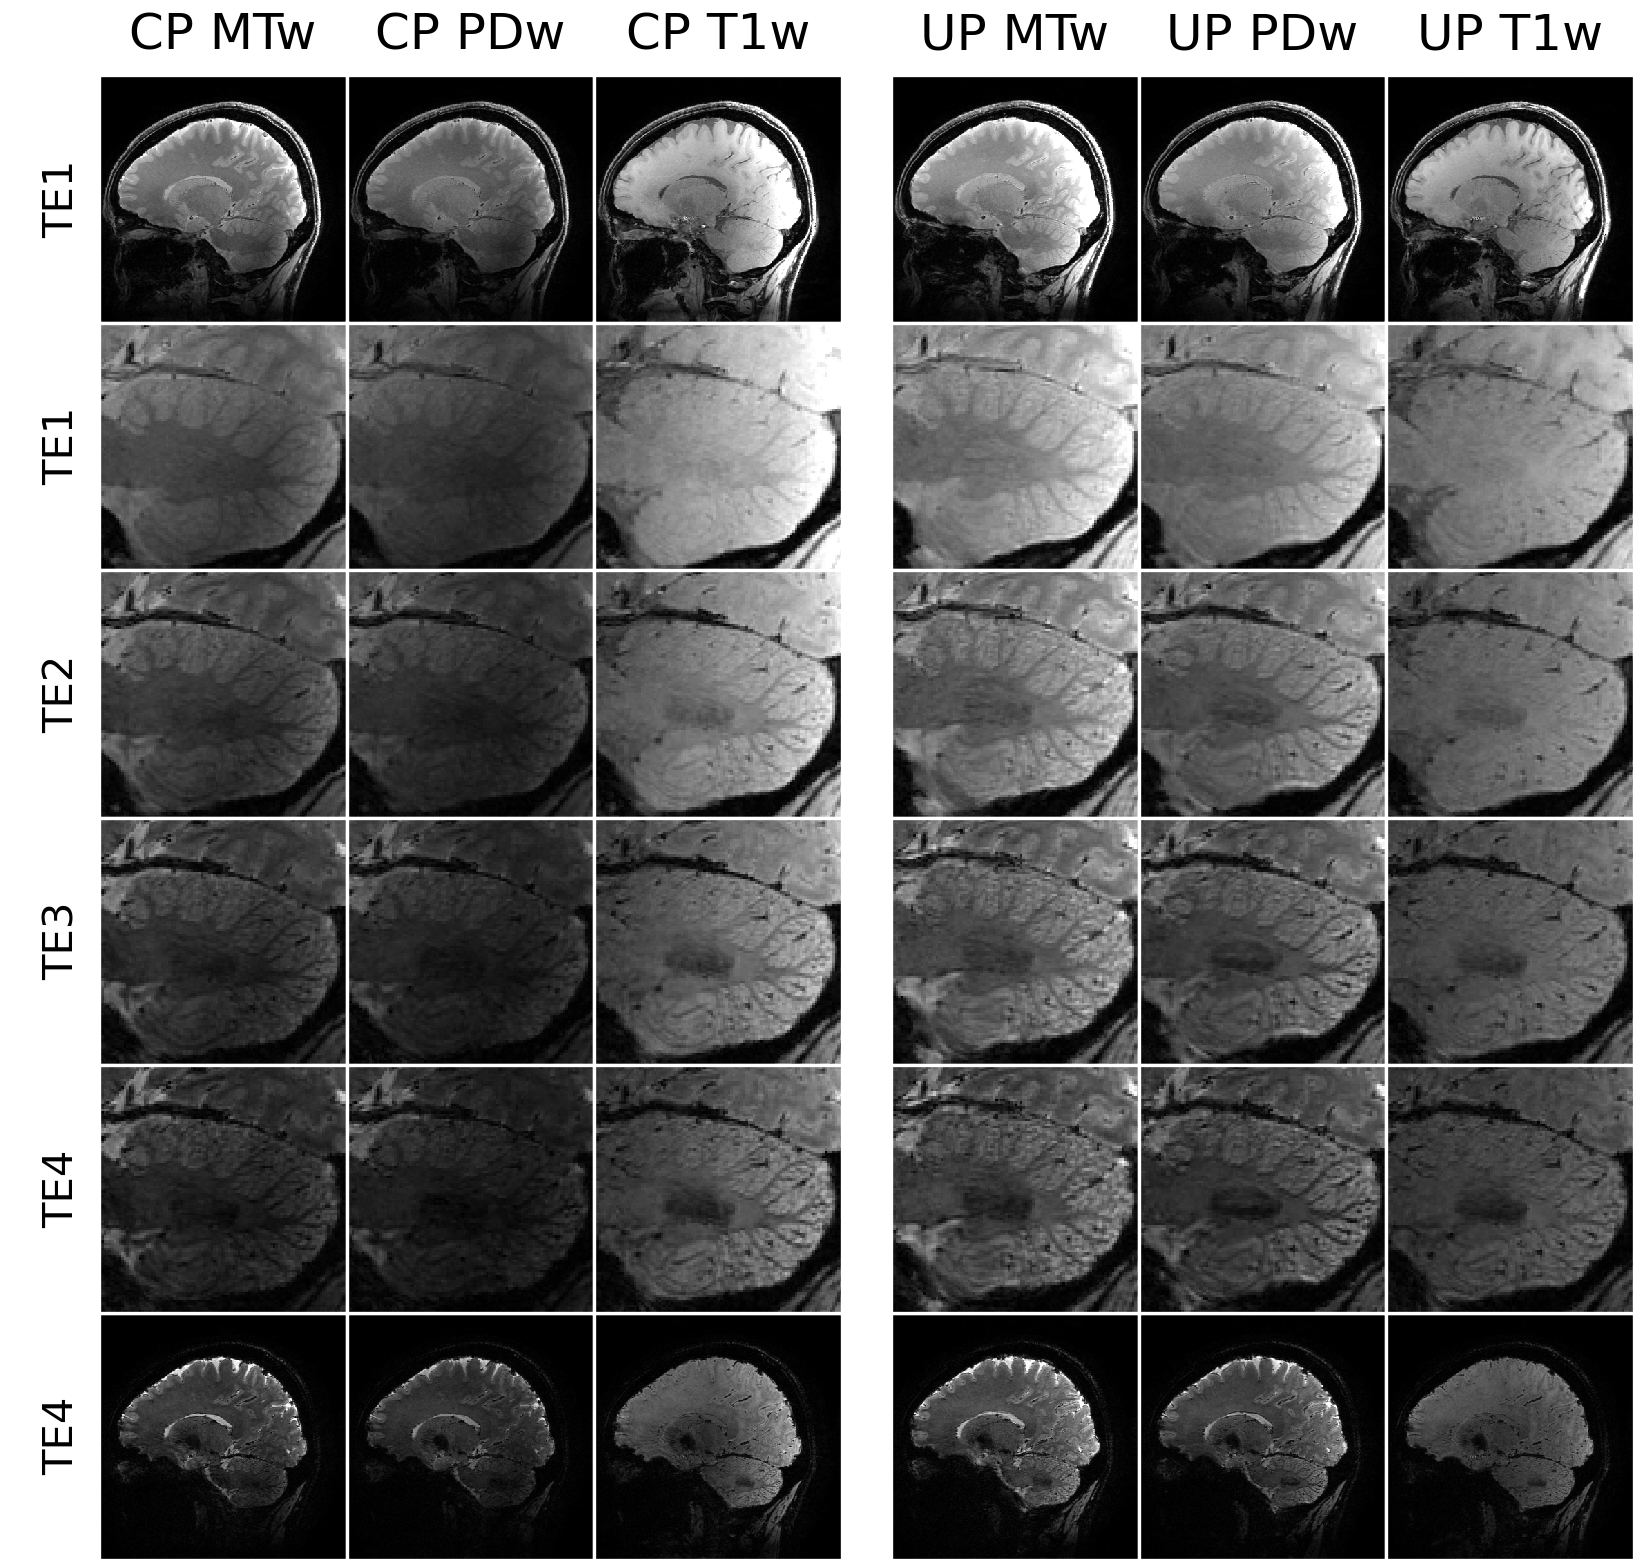
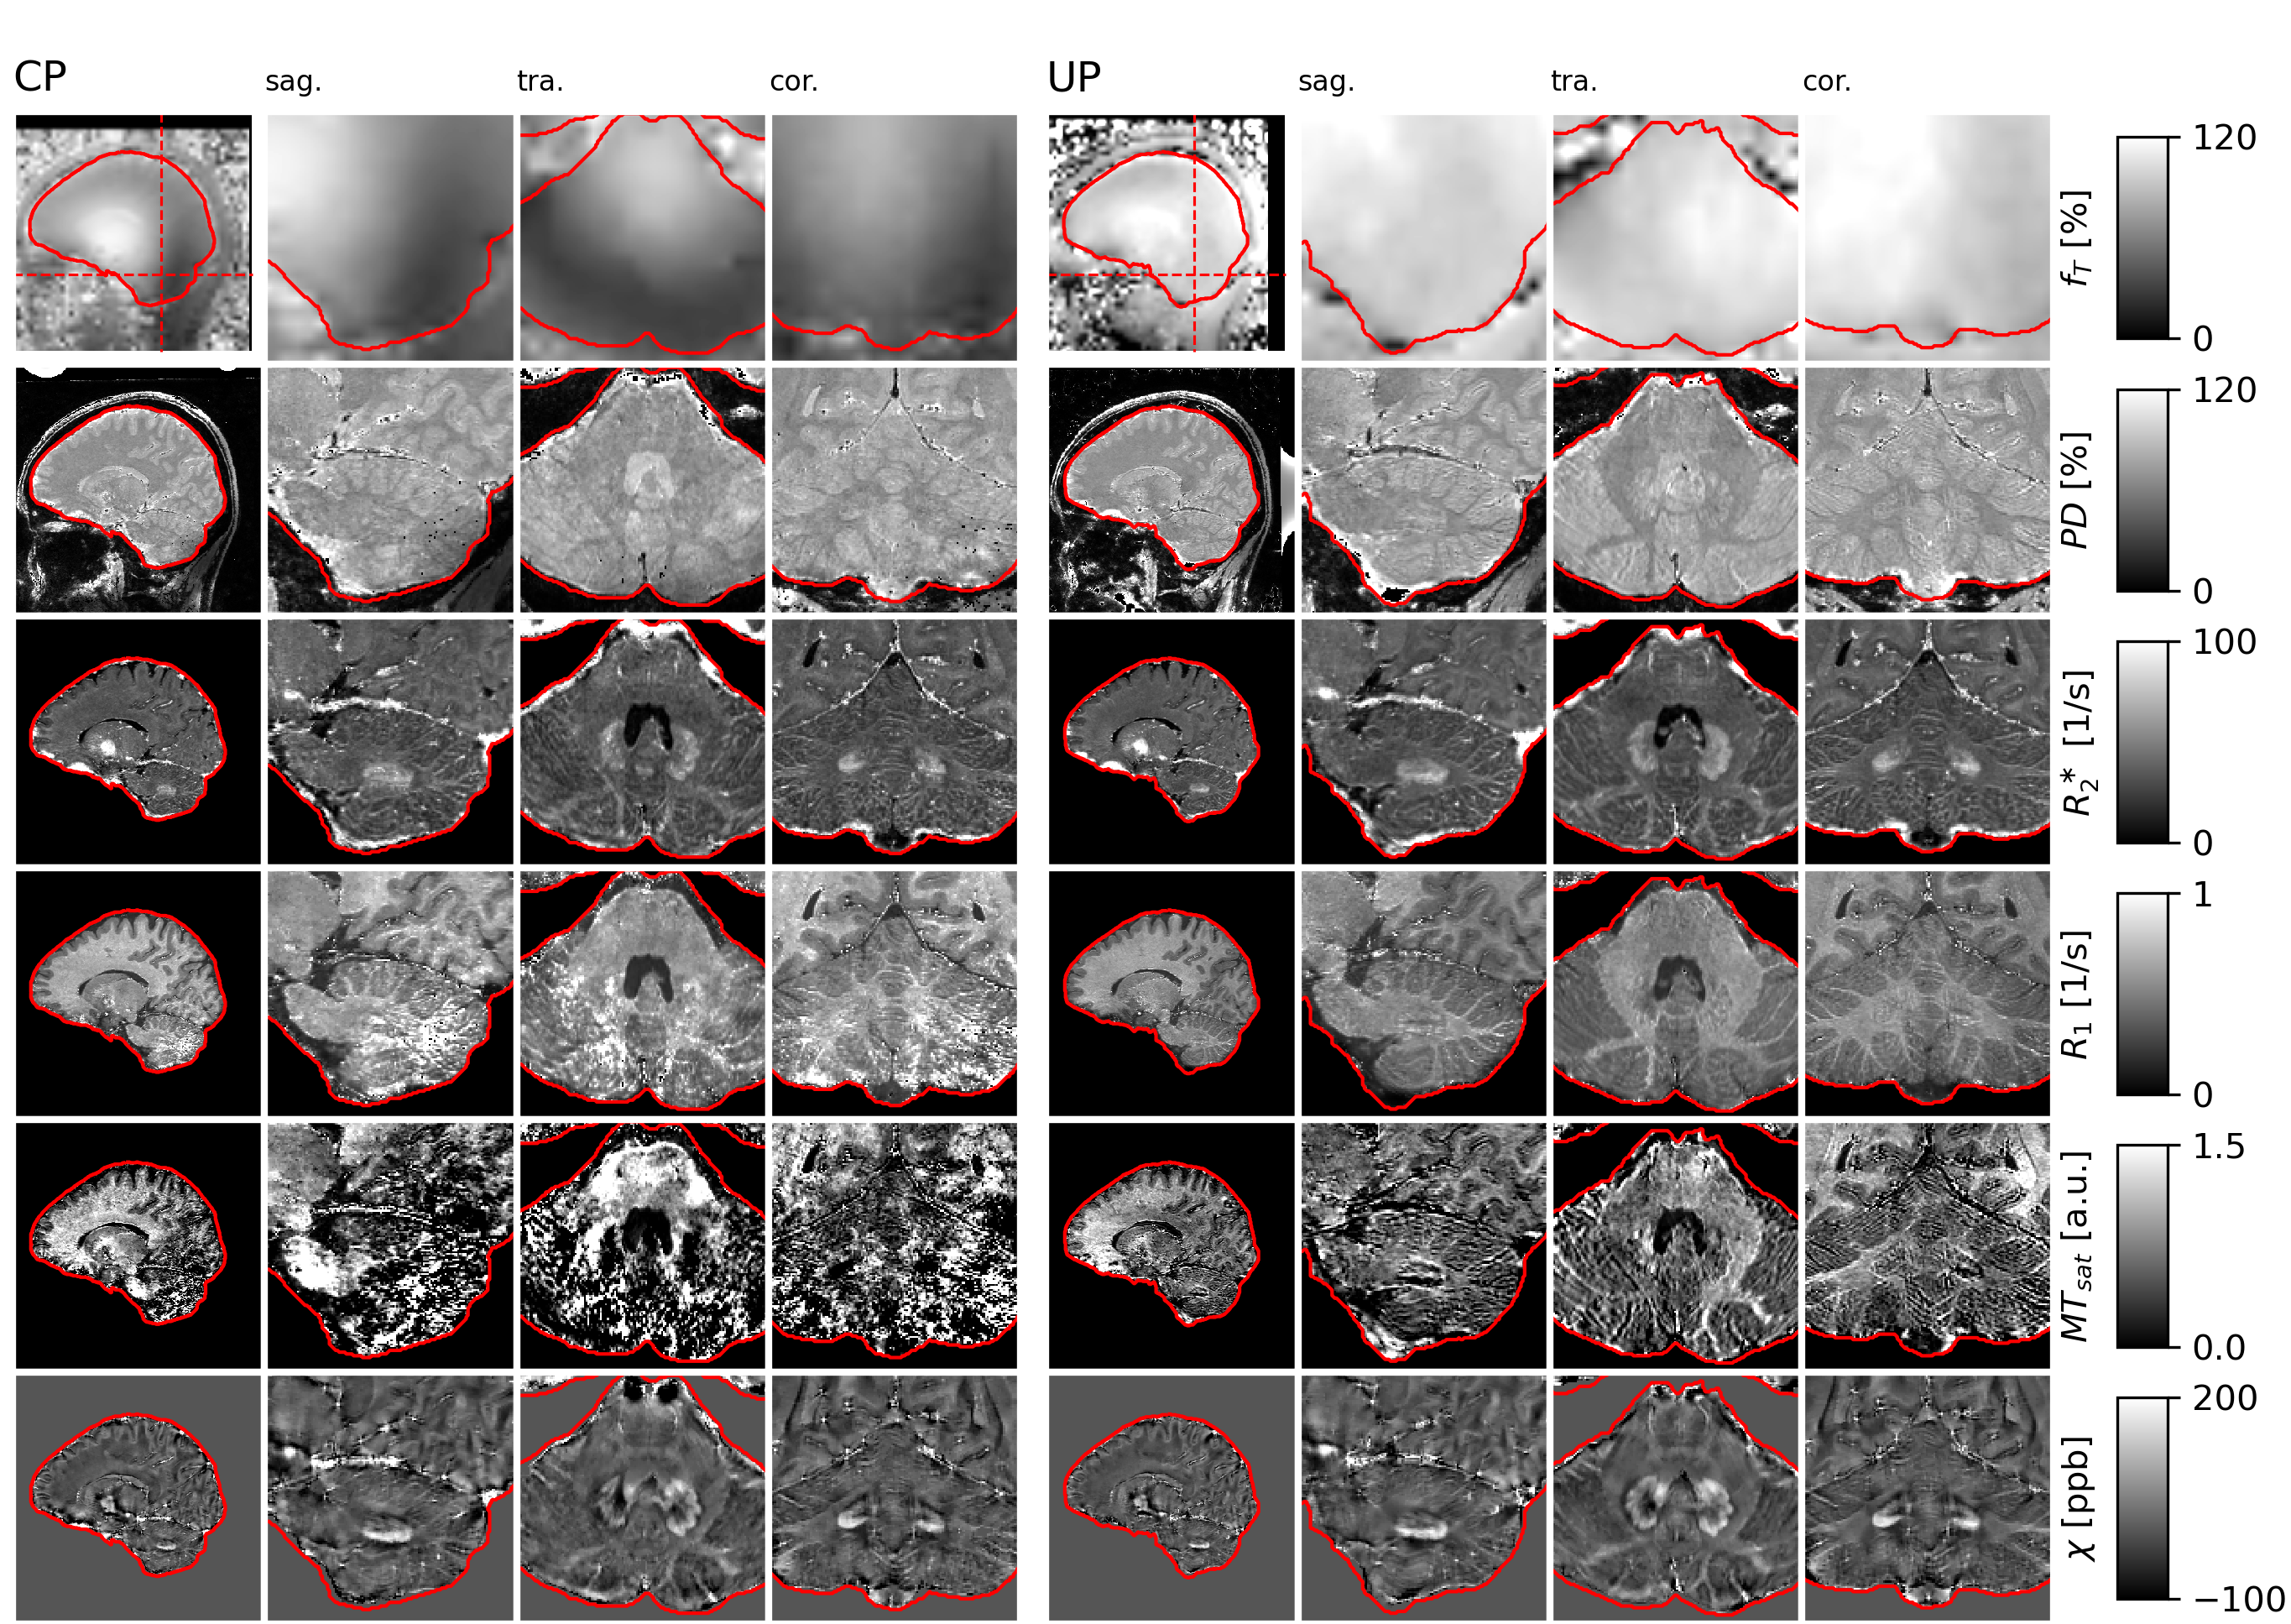
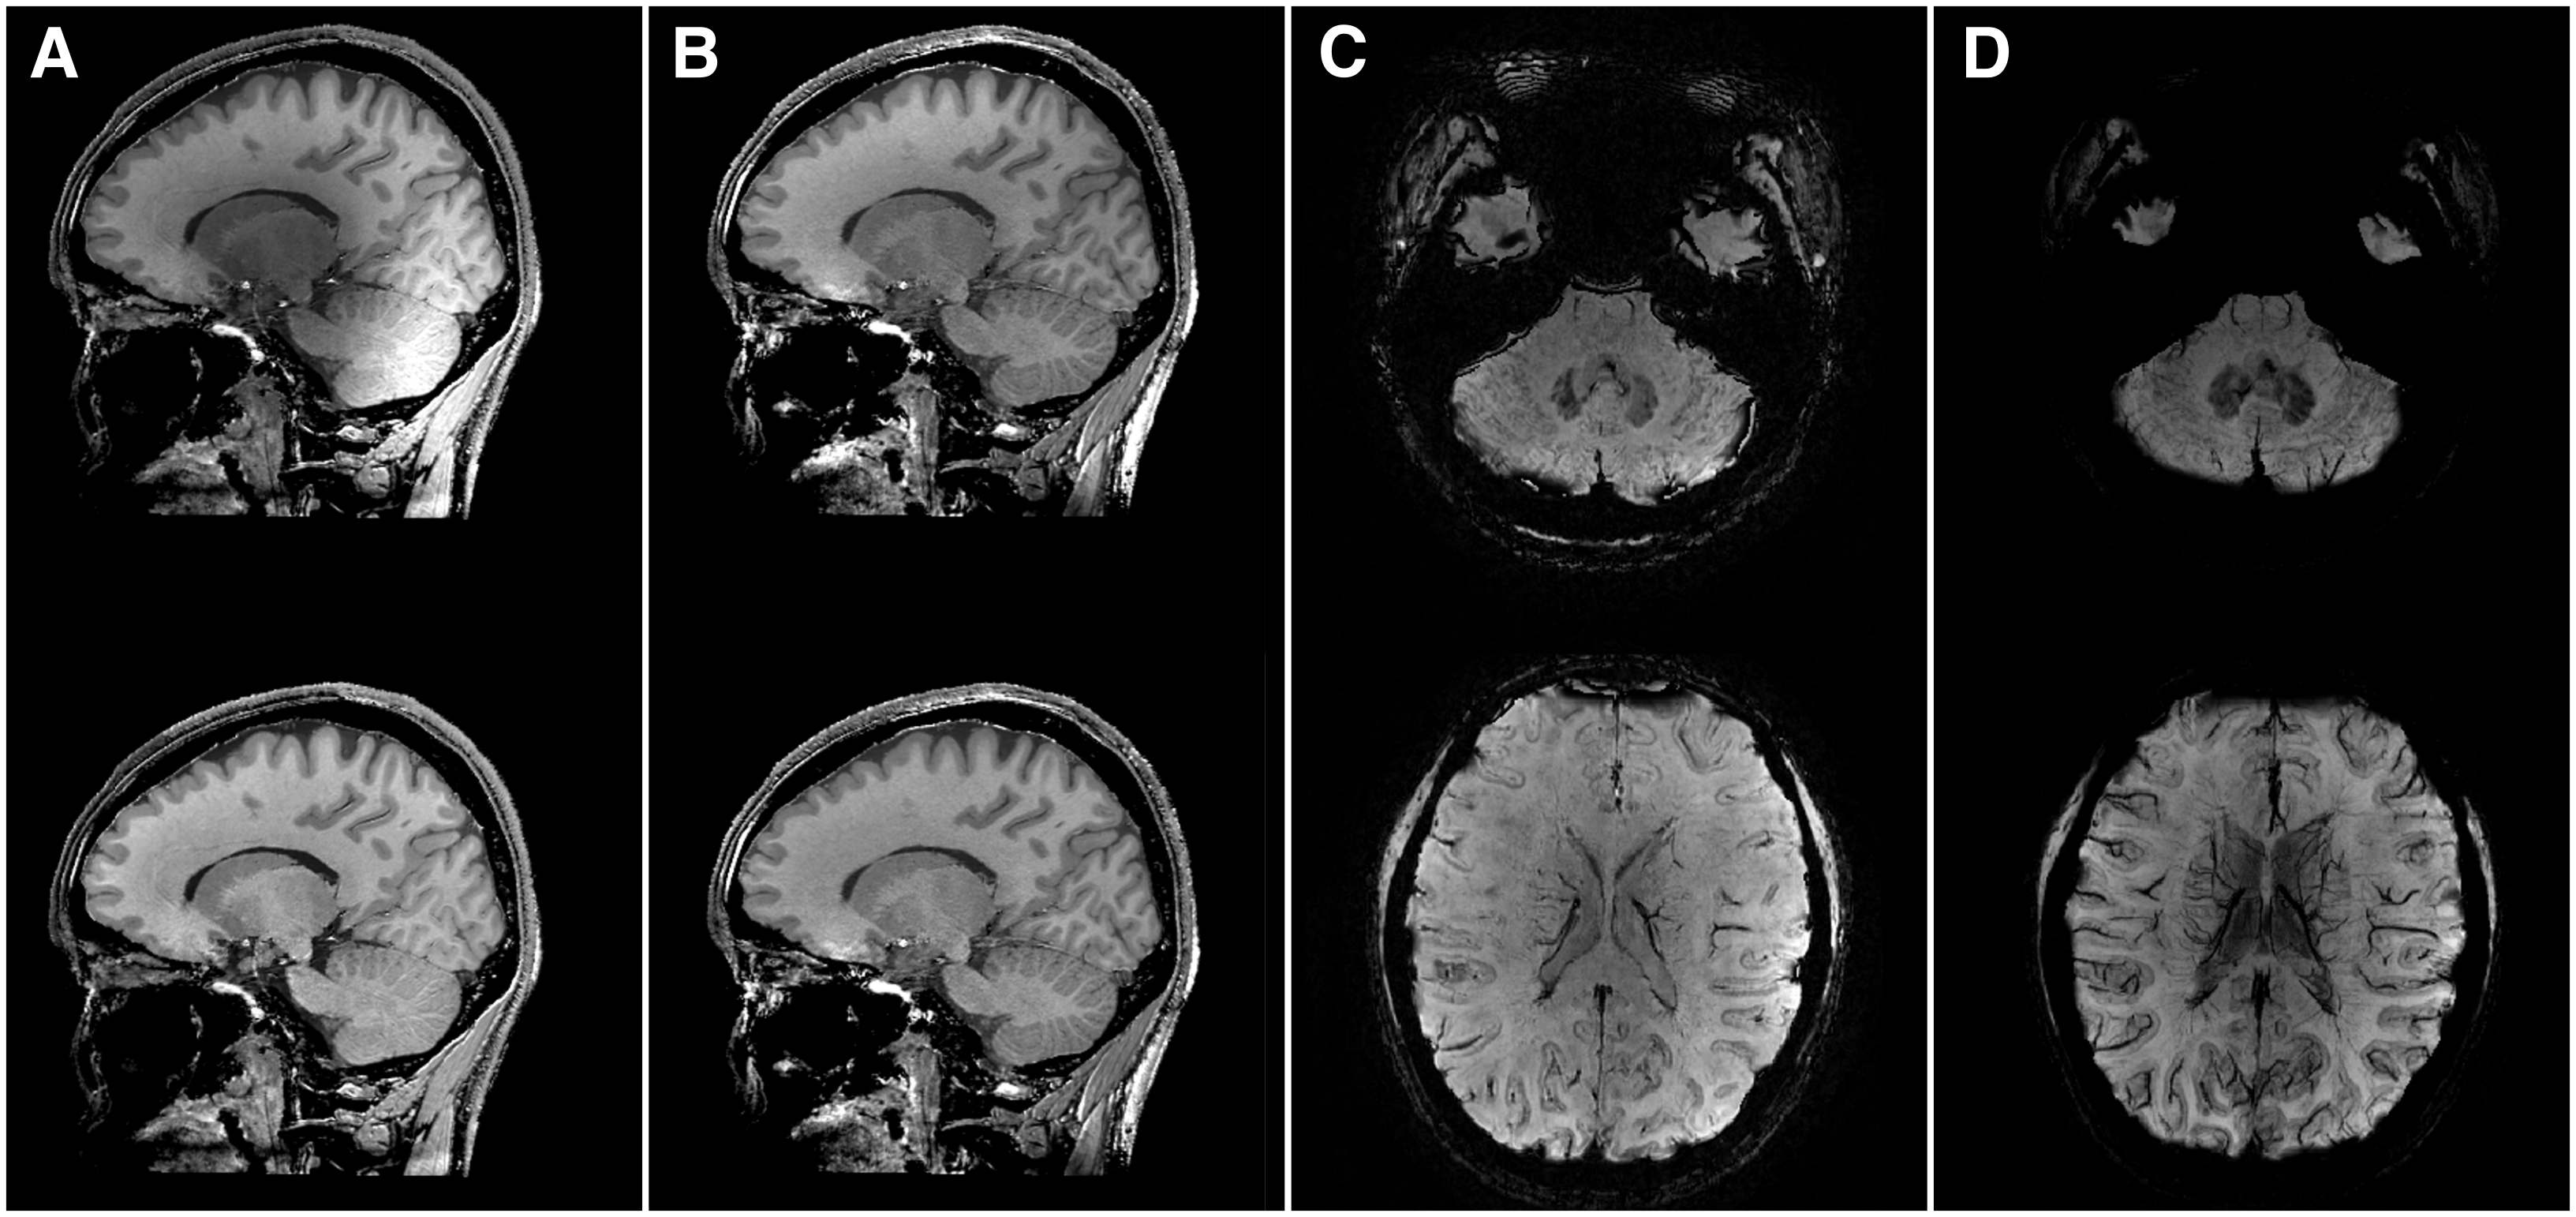
Figure 3 shows dual-polarity-averaged magnitudes for all contrasts at all TEs using CP pulses and UPs. The multi-parameter maps in Fig. 4 show clear deficits when using CP pulses, in particular R1 and MTsat in the cerebellum. The UP data achieve good results throughout the brain. Only MTsat still shows some degree of inhomogeneity. Fig. 5 shows supplementary example output generated from the same data, e.g. MPRAGE-like and susceptibility-weighted images (SWI).Discussion
The weighted magnitude images (Fig. 3) already show that the UPs clearly gain signal and contrast compared to the CP pulses. Accordingly, the resulting parameter maps of Fig. 4 are largely improved in the critical area of the cerebellum. Since only the MTsat shows residual inhomogeneities, despite its clear improvement over the CP-mode maps, it seems that further improving the PUSH MT saturation pulses may be required.The interleaved binomial kT-point excitation pulses homogenize the excitation sufficiently. However, comparing the UP to the CP R1 maps, one can appreciate that particularly white mater R1 is decreased with the UPs. This is likely due to a different amount of accidental MT saturation, particularly in the T1w. image: the 1ms long CP pulses are more narrow-banded and thus result in less unwanted MT saturation than usual in MPM;2 the UP pulses, on the other hand, consisting of several very short subpulses, were not optimized to reduce off-resonance saturation. Future investigations will incorporate off-resonance energy constraints in the UP excitation optimization.
Finally, the susceptibility maps of Fig. 4 and the supplementary output of Fig. 5 demonstrate that the rich whole-brain data with different T2*-weighting (cf. Fig. 3) – which itself is an important diagnostic contrast14,15 – can replace further acquisitions, like QSM and SWI. Even a conventional MPRAGE scan may be skipped, however further validation and optimization is required.
Since the complete 17 minute protocol actually consists of three self-contained MT1/PDw/T1w imaging blocks (about 6 and two times 4.5 minutes) and a B1+ map, the protocol is relatively motion-robust, while inter-scan co-registration is done routinely within the MPM framework. Adding further gradient-echo-based contrasts, e.g. potentially for high-resolution phase-based T2 imaging,16 is straight-forward and may be promising.
Conclusion
Within 17 minutes of scan time using skipped-CAIPI multi-echo 3D-EPI at 7T, whole-brain multi-parameter mapping at 0.6mm isotropic resolution is feasible. The novel interleaved fly-back readout minimizes segmentation artifacts. Importantly also, the tailored universal pTX pulses successfully solved major previous B1+ problems for quantitative imaging. Aside from the native contrasts and quantitative parameter maps, further contrasts can that are relevant for clinical and research applications potentially be generated, and thus acquisition time may be saved.Acknowledgements
The first author wants to thank Simon Robinson and Jin Jin for helpful discussions and advice on appropiate on-line coil combination.
This work received financial support from the European Union Horizon 2020 Research and Innovation program under grant agreement 885876 (AROMA). Furthermore, the work is part of the SCAIFIELD project under the aegis of JPND, supported through the following funding organizations: Belgium, The Fund for Scientific Research (F.R.S.-FNRS); Germany, Federal Ministry of Education and Research (BMBF; funding codes 01ED2109A/B); Norway, The Research Council of Norway (RCN); Turkey, Scientific and Technological Research Council of Turkey, TÜBİTAK.
References
1. Weiskopf, N., Suckling, J., Williams, G., Correia, M. M., Inkster, B., Tait, R., Ooi, C., Bullmore, E. T., & Lutti, A. (2013). Quantitative multi-parameter mapping of R1, PD*, MT, and R2* at 3T: A multi-center validation. Frontiers in Neuroscience, 7(June), 95–95. https://doi.org/10.3389/fnins.2013.00095
2. Wang, D., Ehses, P., Stöcker, T., & Stirnberg, R. (2022). Reproducibility of rapid multi‐parameter mapping at 3T and 7T with highly segmented and accelerated 3D‐EPI. Magnetic Resonance in Medicine, June, 1–16. https://doi.org/10.1002/mrm.29383
3. Gras, V., Vignaud, A., Amadon, A., Le Bihan, D., & Boulant, N. (2017). Universal pulses: A new concept for calibration-free parallel transmission. Magnetic Resonance in Medicine, 77(2), 635–643. https://doi.org/https://doi.org/10.1002/mrm.26148
4. Stirnberg, R., & Stöcker, T. (2021). Segmented K‐space blipped‐controlled aliasing in parallel imaging for high spatiotemporal resolution EPI. Magnetic Resonance in Medicine, 85(3), 1540–1551. https://doi.org/10.1002/mrm.28486
5. Stirnberg, R., Brenner, D., Stöcker, T., & Shah, N. J. (2016). Rapid fat suppression for three-dimensional echo planar imaging with minimized specific absorption rate. Magnetic Resonance in Medicine, 76(5), 1517–1523. https://doi.org/10.1002/mrm.26063
6. Löwen, D., Pracht, E. D., Stirnberg, R., Liebig, P., & Stöcker, T. (2022). Interleaved binomial kT‐Points for water‐selective imaging at 7T. Magnetic Resonance in Medicine, 1–10. https://doi.org/10.1002/mrm.29376
7. Leitão, D., Tomi-Tricot, R., Bridgen, P., Wilkinson, T., Liebig, P., Gumbrecht, R., Ritter, D., Giles, S. L., Baburamani, A., Sedlacik, J., Hajnal, J. V., & Malik, S. J. (2022). Parallel transmit pulse design for saturation homogeneity (PUSH) for magnetization transfer imaging at 7T. Magnetic Resonance in Medicine, 88(1), 180–194. https://doi.org/10.1002/mrm.29199
8. Jellúš, V., & Kannengiesser, S. A. R. (2014). Adaptive Coil Combination Using a Body Coil Scan as Phase Reference. Proceedings of the International Society of Magnetic Resonance in Medicine, 1.
9. Yarnykh, V. L. (2007). Actual flip-angle imaging in the pulsed steady state: A method for rapid three-dimensional mapping of the transmitted radiofrequency field. Magnetic Resonance in Medicine, 57(1), 192–200. https://doi.org/10.1002/mrm.21120
10. Ehses, P., Brenner, D., Stirnberg, R., Pracht, E. D., & Stöcker, T. (2019). Whole‐brain B1‐mapping using three‐dimensional DREAM. Magnetic Resonance in Medicine, 82(3), 924–934. https://doi.org/10.1002/mrm.27773
11. Tabelow, K., Balteau, E., Ashburner, J., Callaghan, M. F., Draganski, B., Helms, G., Kherif, F., Leutritz, T., Lutti, A., Phillips, C., Reimer, E., Ruthotto, L., Seif, M., Weiskopf, N., Ziegler, G., & Mohammadi, S. (2019). hMRI – A toolbox for quantitative MRI in neuroscience and clinical research. Neuroimage, 194(December 2018), 191–210. https://doi.org/10.1016/j.neuroimage.2019.01.029
12. Dymerska, B., Eckstein, K., Bachrata, B., Siow, B., Trattnig, S., Shmueli, K., & Robinson, S. D. (2021). Phase unwrapping with a rapid opensource minimum spanning tree algorithm (ROMEO). Magnetic Resonance in Medicine, 85(4), 2294–2308. https://doi.org/10.1002/mrm.28563
13. Stewart, A. W., Robinson, S. D., O’Brien, K., Jin, J., Widhalm, G., Hangel, G., Walls, A., Goodwin, J., Eckstein, K., Tourell, M., Morgan, C., Narayanan, A., Barth, M., & Bollmann, S. (2022). QSMxT: Robust masking and artifact reduction for quantitative susceptibility mapping. Magnetic Resonance in Medicine, 87(3), 1289–1300. https://doi.org/10.1002/mrm.29048
14. Zwanenburg, J. J. M., Versluis, M. J., Luijten, P. R., & Petridou, N. (2011). Fast high resolution whole brain T2* weighted imaging using echo planar imaging at 7T. NeuroImage, 56(4), 1902–1907. https://doi.org/10.1016/j.neuroimage.2011.03.046
15. Sati, P., Thomasson, D. M., Li, N., Pham, D. L., Biassou, N. M., Reich, D. S., & Butman, J. A. (2014). Rapid, high-resolution, whole-brain, susceptibility-based MRI of multiple sclerosis. Multiple Sclerosis Journal, 20(11), 1464–1470. https://doi.org/10.1177/1352458514525868
16. Wang, X., Hernando, D., & Reeder, S. B. (2020). Phase-based T2 mapping with gradient echo imaging. Magnetic Resonance in Medicine, 84(2), 609–619. https://doi.org/10.1002/mrm.28138
Figures
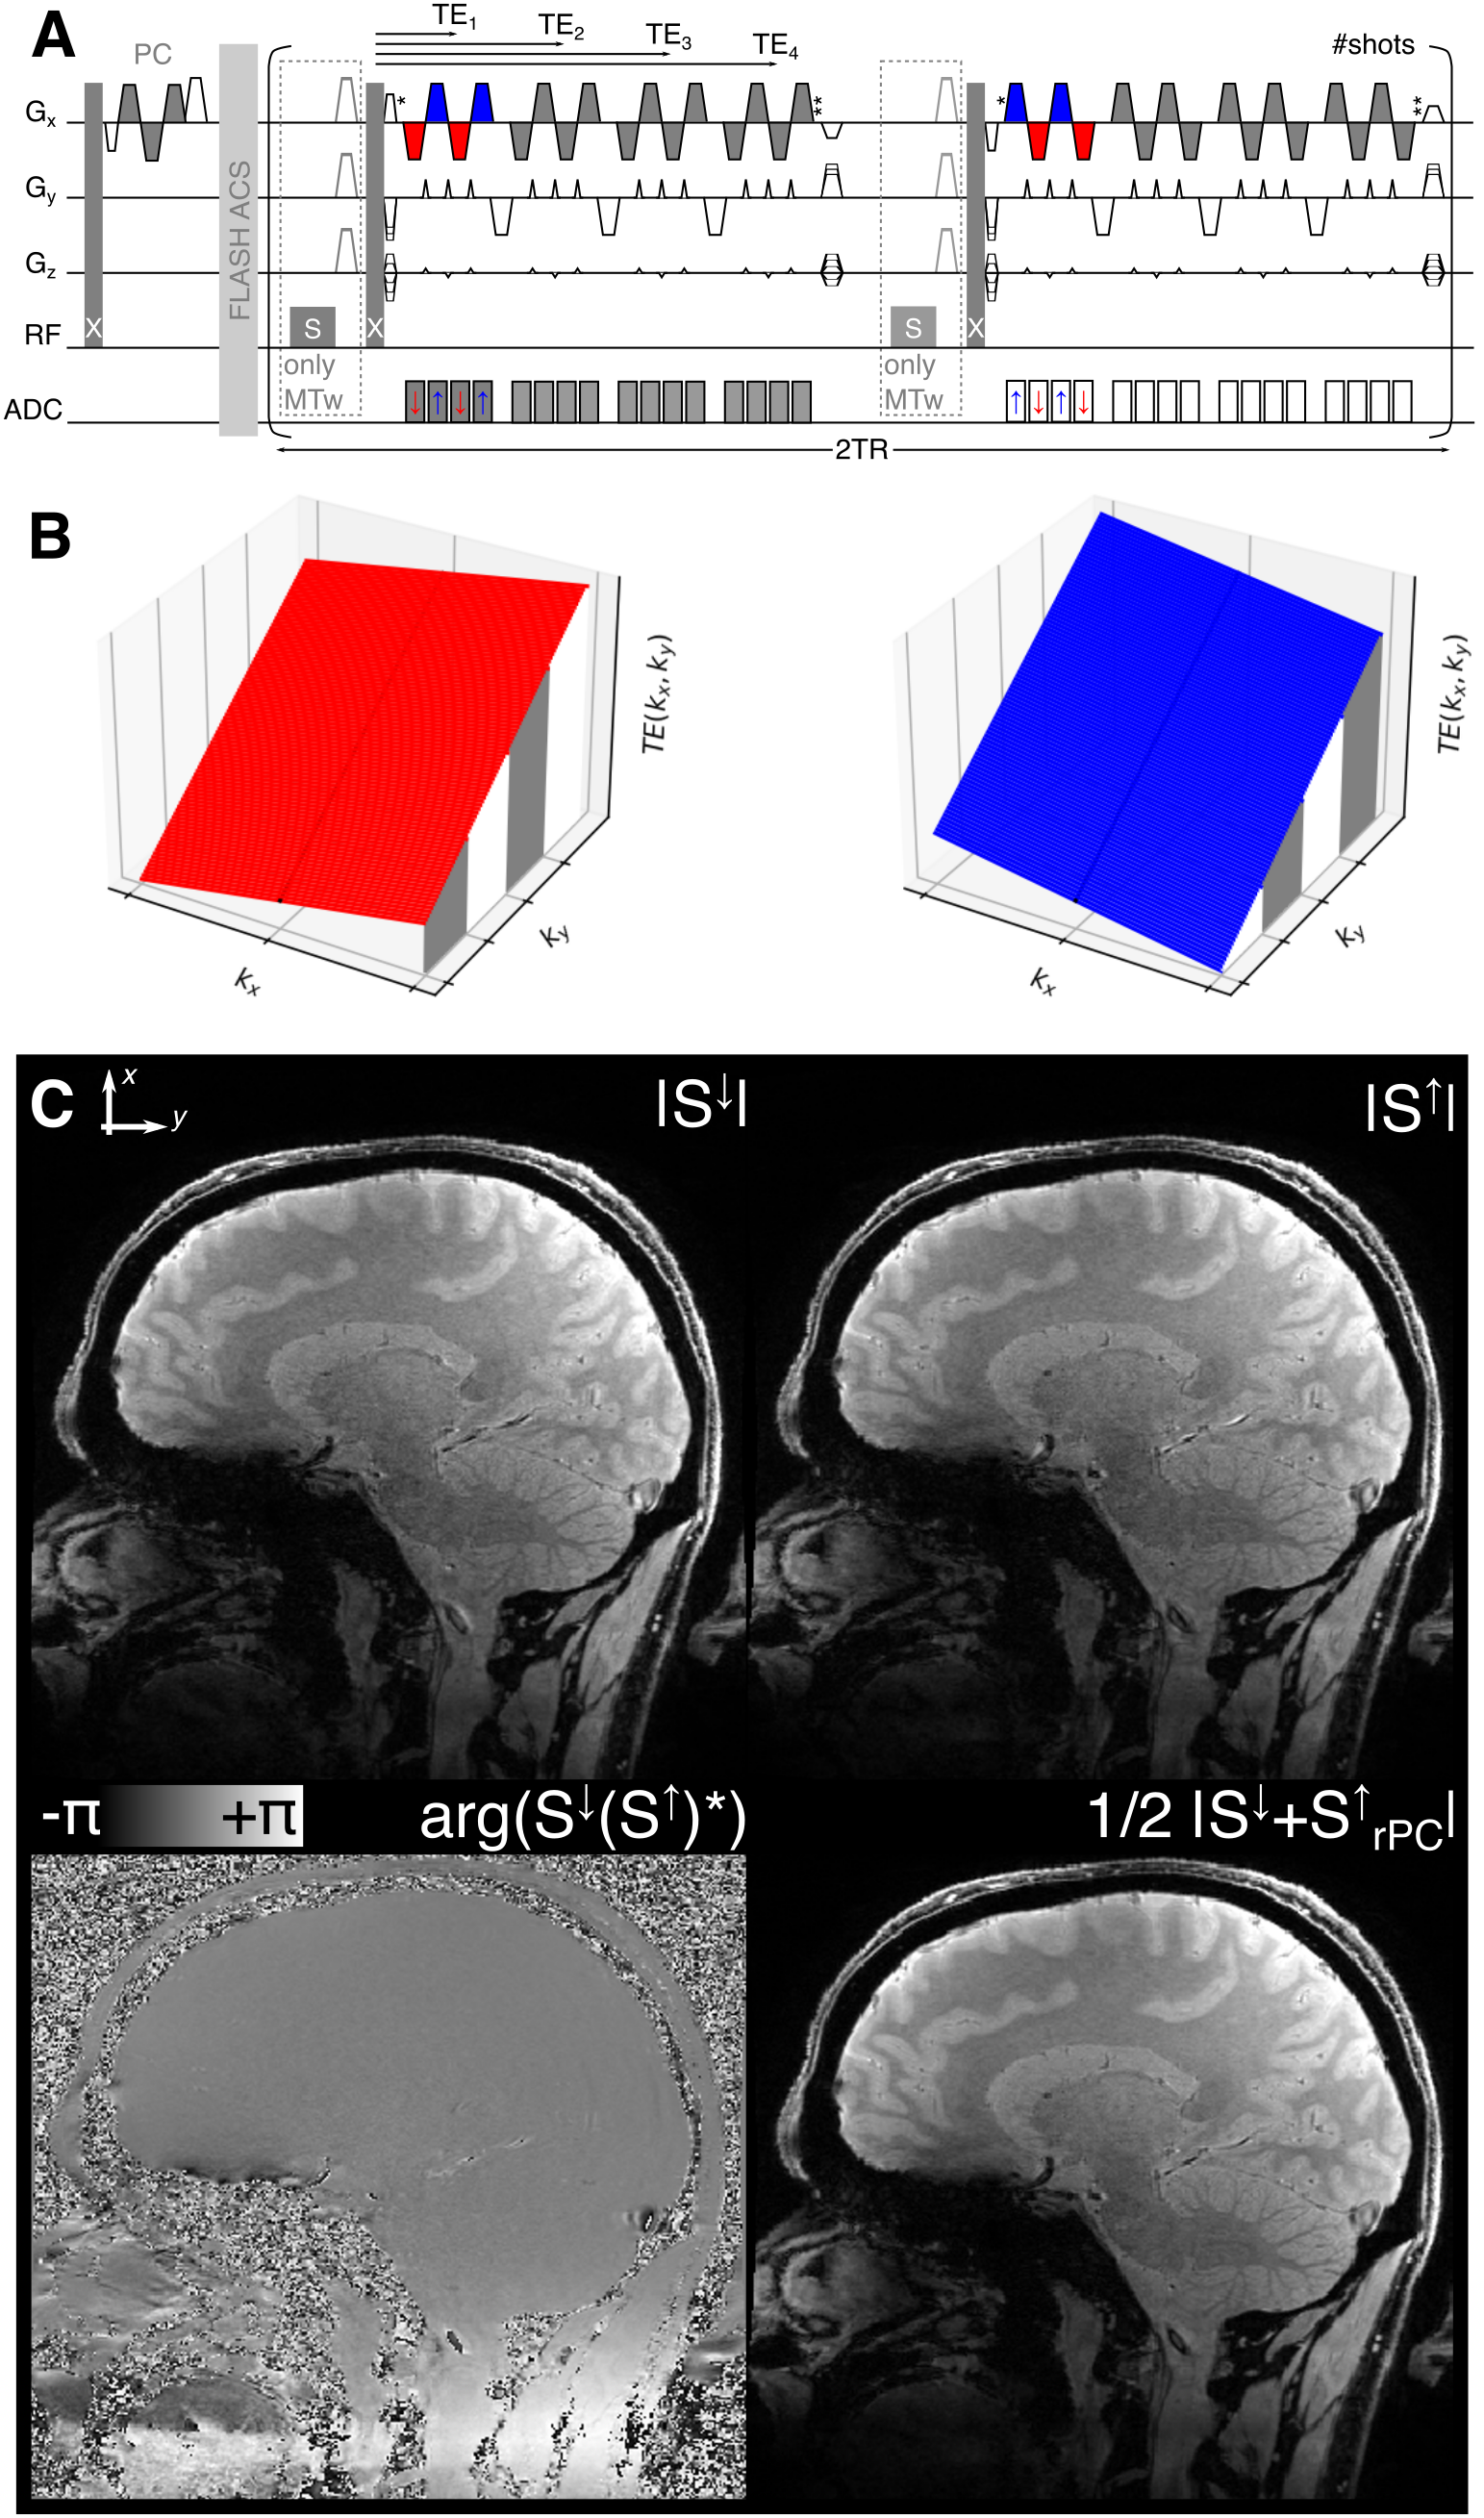
S: CP/UP MT-saturation; X: CP/UP excitation; #shots ~ undersampled ky and kz samples divided by EPI factor.