0269
Acceleration of Multi-Echo MP2RAGE using Interleaved Undersampling and Joint-Contrast Reconstruction1Department of Radiology and Biomedical Imaging, University of California, San Francisco, San Francisco, CA, United States, 2Applied Sciences Lab, GE Healthcare, Menlo Park, CA, United States, 3Department of Neurology, University of California, San Francisco, San Francisco, CA, United States, 4UCSF/UCB Graduate Program in Bioengineering, University of California, San Francisco, San Francisco, CA, United States
Synopsis
Keywords: Quantitative Imaging, Quantitative Imaging, MP2RAGE, multi-echo
In this study, we evaluated the use of interleaved undersampling and joint-contrast reconstruction to accelerate multi-echo MP2RAGE. We compared three sampling patterns (GRAPPA, interleaved GRAPPA, and CIRCUS) and five reconstruction algorithms (GRAPPA, ESPIRIT, LORAKS, Joint-GRAPPA, and Joint-LORAKS) using retrospective undersampling experiments. The results demonstrated better performance achieved using joint-contrast compared to single-contrast reconstruction, and CIRCUS sampling compared to GRAPPA. With the combination of CIRCUS undersampling and Joint-LORAKS reconstruction, we obtained quantitative measurements of T1, R2*, QSM, and volumes at R=6.8 highly consistent with the fully sampled data, demonstrating the potential of using the proposed strategy to accelerate ME-MP2RAGE acquisition.
Background
Quantitative parametric MRI provides objective tissue evaluation for disease assessment, albeit requires additional acquisition time. Multiparametric MRI sequences that produce multiple contrast images and quantitative maps can improve time efficiency and mitigate image registration. Recently, the extension of Magnetization-Prepared 2 Rapid Gradient-Echoes (MP2RAGE) to include multi-echo readout has been proposed1-3, which expands its capability to generate R2* mapping, susceptibility-weighted image, and quantitative susceptibility mapping (QSM), in additional to T1-weighted image and T1 mapping. However, multi-echo MP2RAGE (ME-MP2RAGE) requires a much longer scan time (16-20min2,3) due to the longer TEs. Joint-contrast reconstruction can potentially accelerate ME-MP2RAGE by leveraging the shared spatial features across contrasts and reducing the k-space samples needed in each image. It has been widely studied in dynamic imaging (k-t SENSE/BLAST4, XD-GRASP5, MR multitasking6), but less explored in multiparametric imaging7. In this study, we propose to use interleaved undersampling and joint-contrast reconstruction to accelerate ME-MP2RAGE.Methods
Pulse sequence and data acquisitionWe extended an MP2RAGE sequence to ME-MP2RAGE on a 3T scanner (Signa Premier, GE Healthcare)1. We acquired fully-sampled data with a 48-channel head coil on a healthy volunteer using the parameters FOV=240x240x160mm3, 1mm isotropic resolution, 4 bipolar readouts with TEs=1.98/4.27/6.56/8.85ms, TR=12.69ms, MP2RAGE TR=4.92s, TIs=1100/3200ms, FAs=8/10°, scan time=19min40s.
Retrospective undersampling and reconstruction
An axial slice of the acquired data was used to evaluate different undersampling and reconstruction methods (Fig.1(A)). We investigated three undersampling strategies: GRAPPA, interleaved GRAPPA with shifted patterns across contrasts, and CIRcular Cartesian Under-Sampling (CIRCUS), a pseudo-random variable density sampling strategy8. We evaluated three single-contrast reconstruction algorithms (GRAPPA9, ESPIRIT10, and LORAKS11) and joint-contrast reconstruction methods Joint-GRAPPA and Joint-LORAKS7. The normalized root-mean-square error (RMSE) was computed and used to optimize the parameters of CIRCUS and Joint-LORAKS. Additionally, we compared the methods across different acceleration factors.
Quantitative mappings
We derived the T1-weighted images using the complex signals at two TIs12 and averaged across echoes. T1 maps were calculated using a dictionary-based method12. The coil images from the second TI were combined using MCPC-3D-S13. We then used the magnitude images to compute R2* maps by mono-exponential fitting, and the phase images to reconstruct QSM14,15.
Data analysis
We compared the quantitative measurements from the undersampled images to the fully-sampled images. We first performed tissue segmentation using FreeSurfer on the T1-weighted images16, which provides the volumes and masks of white and gray matter structures. We used the masks obtained from the fully-sampled image to calculate the mean and standard deviation of tissue T1, R2*, and susceptibility. Pearson correlation and Bland-Altman analysis were performed to investigate the consistency of the quantitative measurements.
Results
Comparison of undersampling strategies and reconstruction algorithmsFig. 1 showed the magnitude images of the fully-sampled data and the comparison across different methods. Within each sampling strategy, joint-contrast reconstruction with interleaved sampling achieved lower RMSE. Between the Joint-LORAKS reconstructions, we observed better performance using CIRCUS compared to GRAPPA sampling. The optimized parameters of CIRCUS undersampling and Joint-LORAKS reconstruction were shown in Fig.2(A-B). Consistently, joint-contrast reconstructions achieved lower RMSE, and CIRCUS undersampling further improved the performance when compared across different acceleration factors (Fig.2(C-E)).
Qualitative validations
The magnitude and phase images across different contrasts, and the derived maps using the fully-sampled and undersampled data were illustrated in Fig.3. The undersampled images recovered the main structural and characteristic high values of R2* and QSM in basal ganglia and dentate nuclei, although increased noise level was observed compared to the fully-sampled images.
Quantitative validations
Fig.4 showed the results of correlation and Bland-Altman analyses of T1, R2*, QSM, and volumetric measurements in different brain regions between fully-sampled and undersampled images (effective R=6.8). All four measurements showed strong correlations with r>0.9 and p<0.0001, with high consistency observed in T1 (r=0.998, mean percentage difference=-2.00%), ROI volume (r=0.991, mean percentage difference=5.73%), and QSM (r=0.982, mean difference=0ppm). R2* measurements demonstrated slightly higher deviations (r=0.913). The regions of overestimated R2* were mainly localized in the inferior temporal and frontal regions close to the air-tissue interfaces. Excluding those regions resulted in comparable performance with the other metrics (r=0.985, mean percentage difference=3.17%).
Discussion & Conclusion
In this study, we investigated using interleaved undersampling strategy and joint-contrast reconstruction to accelerate ME-MP2RAGE. With retrospective undersampling experiments, we demonstrated the superiority of joint-contrast compared to single-contrast reconstruction, and the reduced error using CIRCUS design compared to GRAPPA. It is worth noting that the advanced sampling and reconstruction provided additional benefit only when a high acceleration factor was applied (effective R>3.8, equivalent to 2x2 GRAPPA undersampling) (Fig.2(E)). The quantitative measurements of T1, R2*, QSM, and volumes obtained from undersampled data were highly consistent with the fully-sampled data, demonstrating the potential of using the joint-contrast reconstruction strategy to accelerate ME-MP2RAGE acquisition. Currently, we are working on implementing the prospective undersampling. In addition, spatial regularization using wavelet sparsity could be introduced to further reduce the noise. We plan to evaluate the technique in two settings, fast acquisition and prolonged TEs for better R2* and QSM quantification.To conclude, we demonstrated the potential of using interleaved undersampling and joint-contrast reconstruction to accelerate ME-MP2RAGE. The proposed technique would greatly benefit the translation of ME-MP2RAGE in clinical use through the reduction of scan time (from ~20min to ~3min) and improvement of R2* and QSM quantification.
Acknowledgements
No acknowledgement found.References
- Sun H, Cleary JO, Glarin R, Kolbe SC, Ordidge RJ, Moffat BA, Pike GB. Extracting more for less: multi-echo MP2RAGE for simultaneous T1 -weighted imaging, T1 mapping, R2∗ mapping, SWI, and QSM from a single acquisition. Magn Reson Med. 2020 Apr;83(4):1178-1191. doi: 10.1002/mrm.27975. Epub 2019 Sep 10. PMID: 31502729.
- Metere R, Kober T, Möller HE, Schäfer A. Simultaneous Quantitative MRI Mapping of T1, T2* and Magnetic Susceptibility with Multi-Echo MP2RAGE. PLoS One. 2017 Jan 12;12(1):e0169265. doi: 10.1371/journal.pone.0169265. PMID: 28081157; PMCID: PMC5230783.
- Caan MWA, Bazin PL, Marques JP, de Hollander G, Dumoulin SO, van der Zwaag W. MP2RAGEME: T1, T2*, and QSM mapping in one sequence at 7 tesla. Hum Brain Mapp. 2019 Apr 15;40(6):1786-1798. doi: 10.1002/hbm.24490. Epub 2018 Dec 13. PMID: 30549128; PMCID: PMC6590660.
- Tsao J, Boesiger P, Pruessmann KP. k-t BLAST and k-t SENSE: dynamic MRI with high frame rate exploiting spatiotemporal correlations. Magn Reson Med. 2003 Nov;50(5):1031-42. doi: 10.1002/mrm.10611. PMID: 14587014.
- Feng L, Axel L, Chandarana H, Block KT, Sodickson DK, Otazo R. XD-GRASP: Golden-angle radial MRI with reconstruction of extra motion-state dimensions using compressed sensing. Magn Reson Med. 2016 Feb;75(2):775-88. doi: 10.1002/mrm.25665. Epub 2015 Mar 25. PMID: 25809847; PMCID: PMC4583338.
- Christodoulou AG, Shaw JL, Nguyen C, Yang Q, Xie Y, Wang N, Li D. Magnetic resonance multitasking for motion-resolved quantitative cardiovascular imaging. Nat Biomed Eng. 2018 Apr;2(4):215-226. doi: 10.1038/s41551-018-0217-y. Epub 2018 Apr 9. PMID: 30237910; PMCID: PMC6141200.
- Bilgic B, Kim TH, Liao C, Manhard MK, Wald LL, Haldar JP, Setsompop K. Improving parallel imaging by jointly reconstructing multi-contrast data. Magn Reson Med. 2018 Aug;80(2):619-632. doi: 10.1002/mrm.27076. Epub 2018 Jan 10. PMID: 29322551; PMCID: PMC5910232.
- Liu J, Saloner D. Accelerated MRI with CIRcular Cartesian UnderSampling (CIRCUS): a variable density Cartesian sampling strategy for compressed sensing and parallel imaging. Quant Imaging Med Surg. 2014 Feb;4(1):57-67. doi: 10.3978/j.issn.2223-4292.2014.02.01. PMID: 24649436; PMCID: PMC3947985.
- Griswold MA, Jakob PM, Heidemann RM, Nittka M, Jellus V, Wang J, Kiefer B, Haase A. Generalized autocalibrating partially parallel acquisitions (GRAPPA). Magn Reson Med. 2002 Jun;47(6):1202-10. doi: 10.1002/mrm.10171. PMID: 12111967.
- Uecker M, Lai P, Murphy MJ, Virtue P, Elad M, Pauly JM, Vasanawala SS, Lustig M. ESPIRiT--an eigenvalue approach to autocalibrating parallel MRI: where SENSE meets GRAPPA. Magn Reson Med. 2014 Mar;71(3):990-1001. doi: 10.1002/mrm.24751. PMID: 23649942; PMCID: PMC4142121.
- Haldar JP, Zhuo J. P-LORAKS: Low-rank modeling of local k-space neighborhoods with parallel imaging data. Magn Reson Med. 2016 Apr;75(4):1499-514. doi: 10.1002/mrm.25717. Epub 2015 May 7. PMID: 25952136; PMCID: PMC4637005.
- Marques JP, Kober T, Krueger G, van der Zwaag W, Van de Moortele PF, Gruetter R. MP2RAGE, a self bias-field corrected sequence for improved segmentation and T1-mapping at high field. Neuroimage. 2010 Jan 15;49(2):1271-81. doi: 10.1016/j.neuroimage.2009.10.002. Epub 2009 Oct 9. PMID: 19819338.
- Eckstein K, Dymerska B, Bachrata B, Bogner W, Poljanc K, Trattnig S, Robinson SD. Computationally Efficient Combination of Multi-channel Phase Data From Multi-echo Acquisitions (ASPIRE). Magn Reson Med. 2018 Jun;79(6):2996-3006. doi: 10.1002/mrm.26963. Epub 2017 Oct 16. PMID: 29034511.
- Li W, Wu B, Liu C. Quantitative susceptibility mapping of human brain reflects spatial variation in tissue composition. Neuroimage. 2011 Apr 15;55(4):1645-56. doi: 10.1016/j.neuroimage.2010.11.088. Epub 2011 Jan 9. PMID: 21224002; PMCID: PMC3062654.
- Li W, Wang N, Yu F, Han H, Cao W, Romero R, Tantiwongkosi B, Duong TQ, Liu C. A method for estimating and removing streaking artifacts in quantitative susceptibility mapping. Neuroimage. 2015 Mar;108:111-22. doi: 10.1016/j.neuroimage.2014.12.043. Epub 2014 Dec 20. PMID: 25536496; PMCID: PMC4406048.
- Fischl B, Salat DH, Busa E, Albert M, Dieterich M, Haselgrove C, van der Kouwe A, Killiany R, Kennedy D, Klaveness S, Montillo A, Makris N, Rosen B, Dale AM. Whole brain segmentation: automated labeling of neuroanatomical structures in the human brain. Neuron. 2002 Jan 31;33(3):341-55. doi: 10.1016/s0896-6273(02)00569-x. PMID: 11832223.
Figures
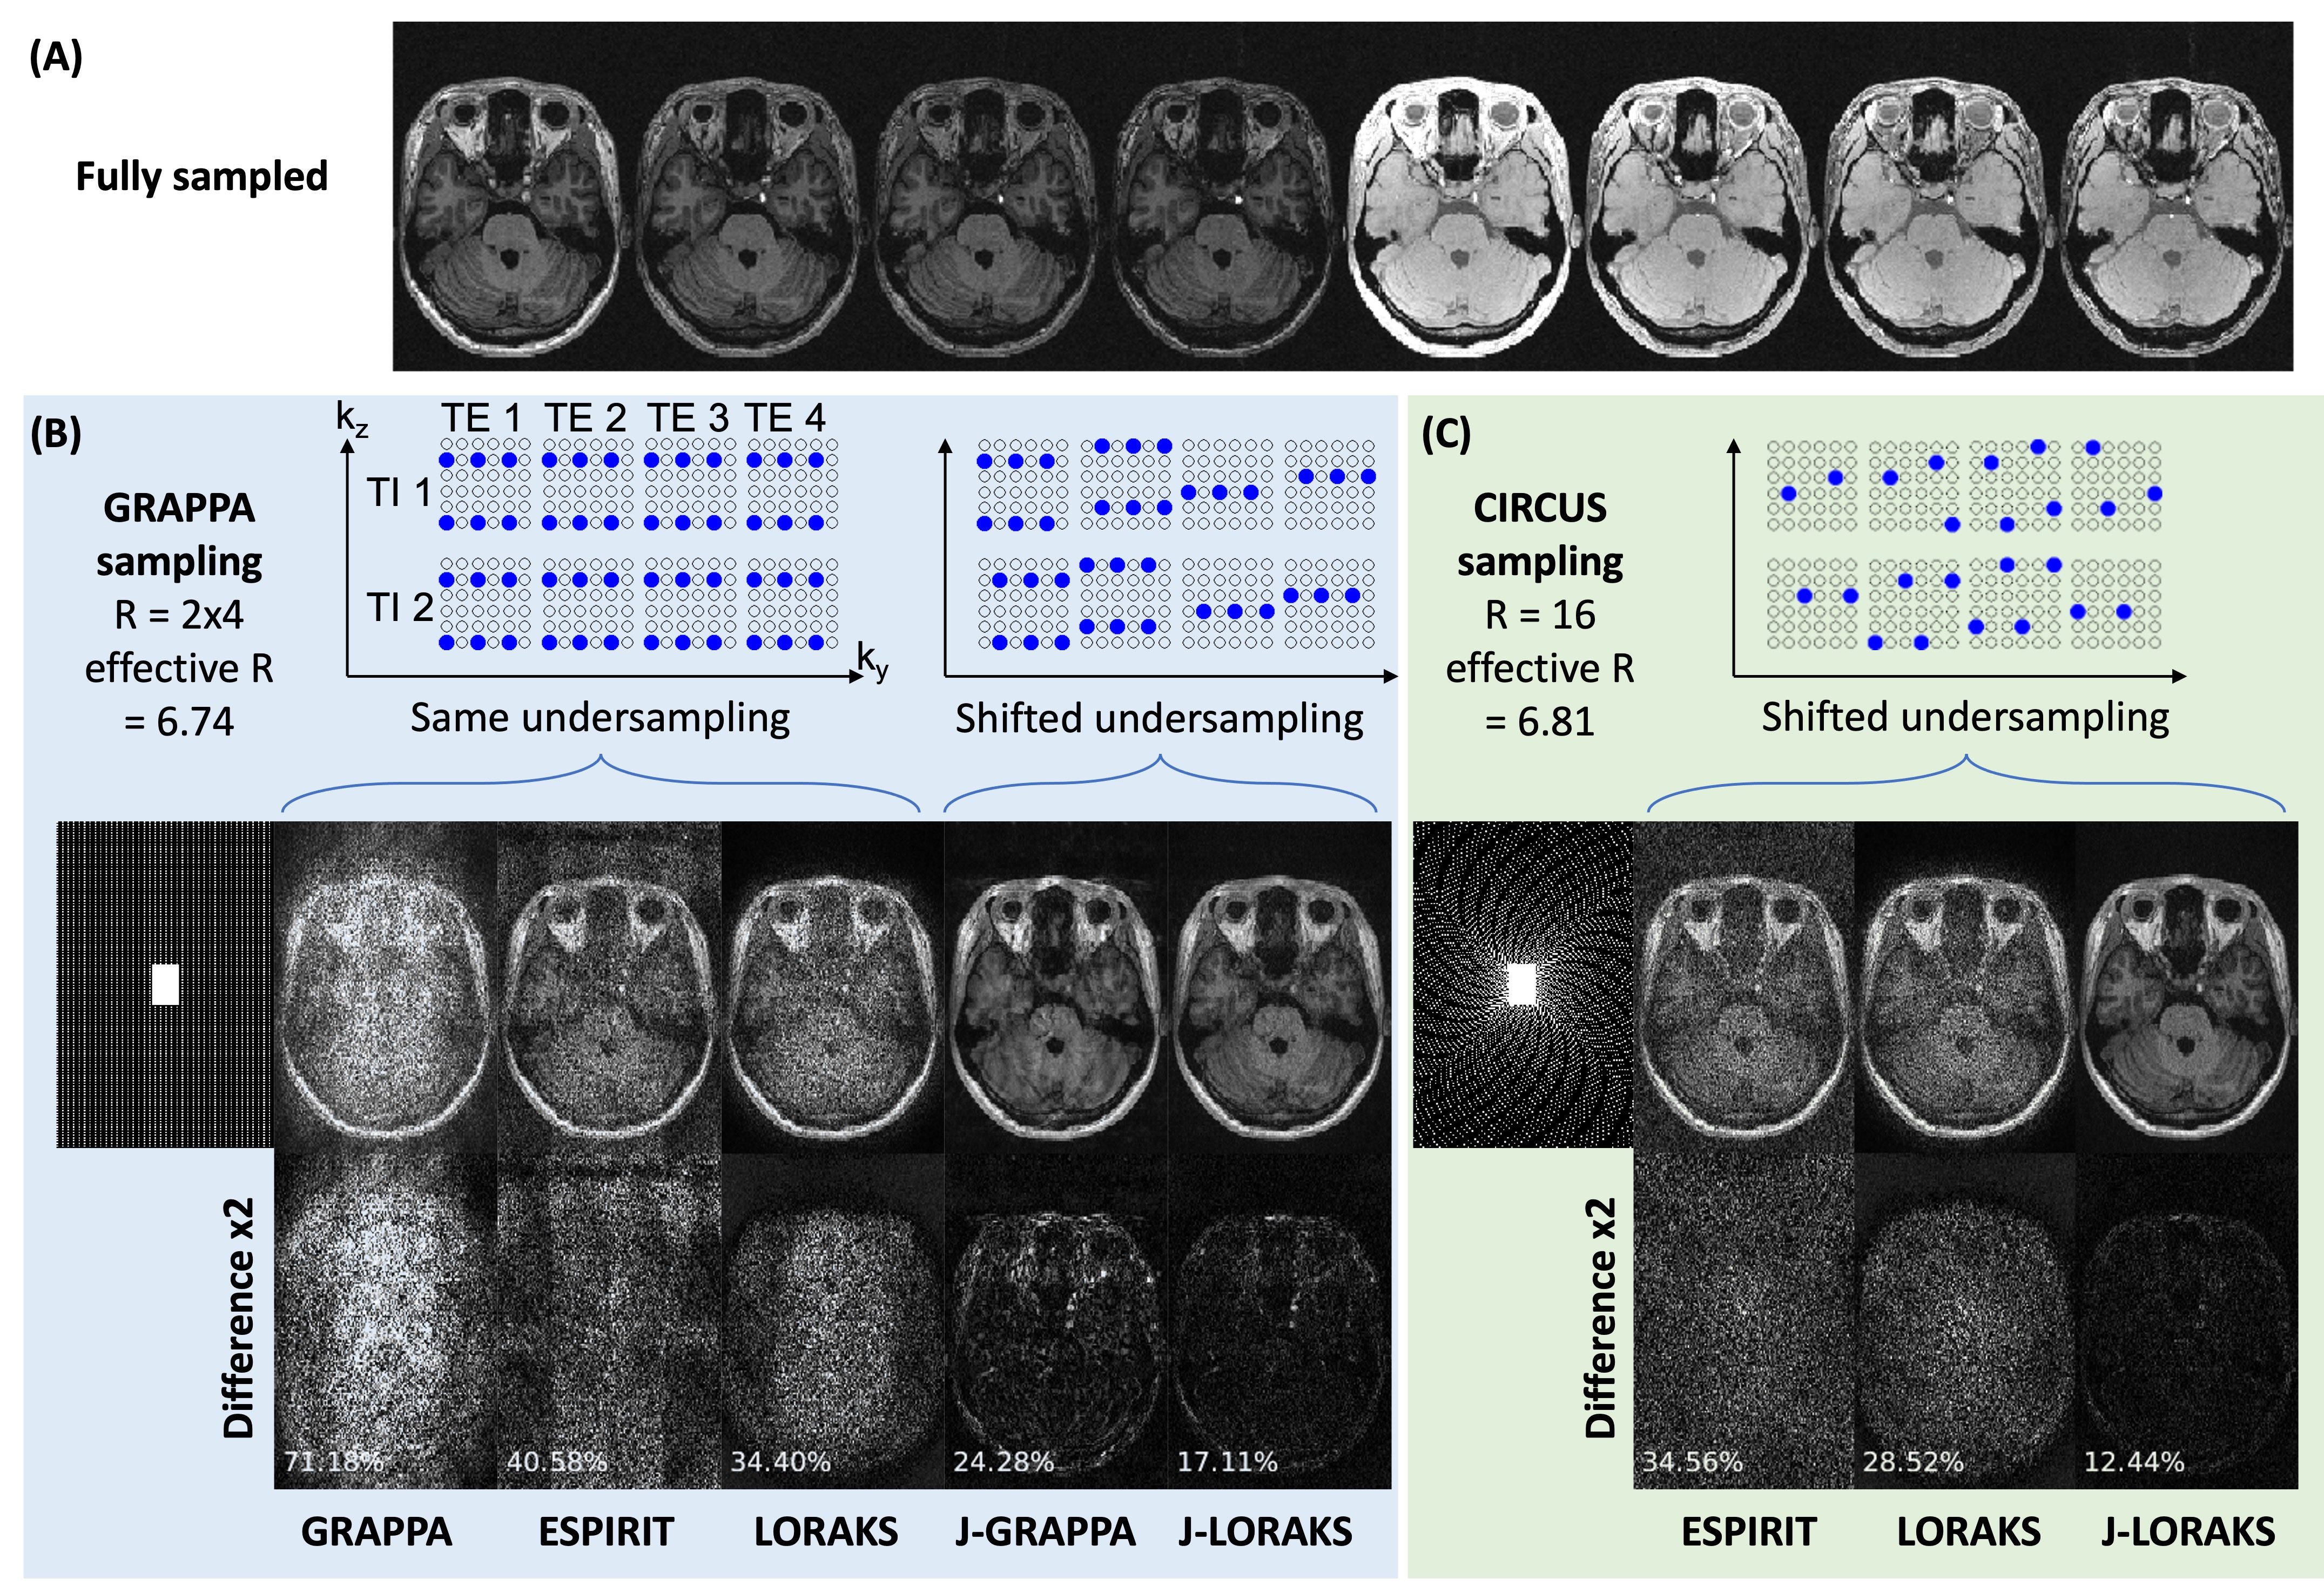
Figure 1. Comparisons of undersampling and reconstruction strategies. (A) showed the magnitude images from two TIs and four TEs of the fully-sampled data. (B) and (C) illustrated the GRAPPA and CIRCUS sampling designs and the comparison of reconstructed images using different algorithms. Each interleaved sample was shifted by one in ky/kz in GRAPPA and one on the concentric k-space circles in CIRCUS. The differences and RMSE were depicted in the bottom row. J-GRAPPA: Joint-GRAPPA; J-LORAKS: Joint-LORAKS.
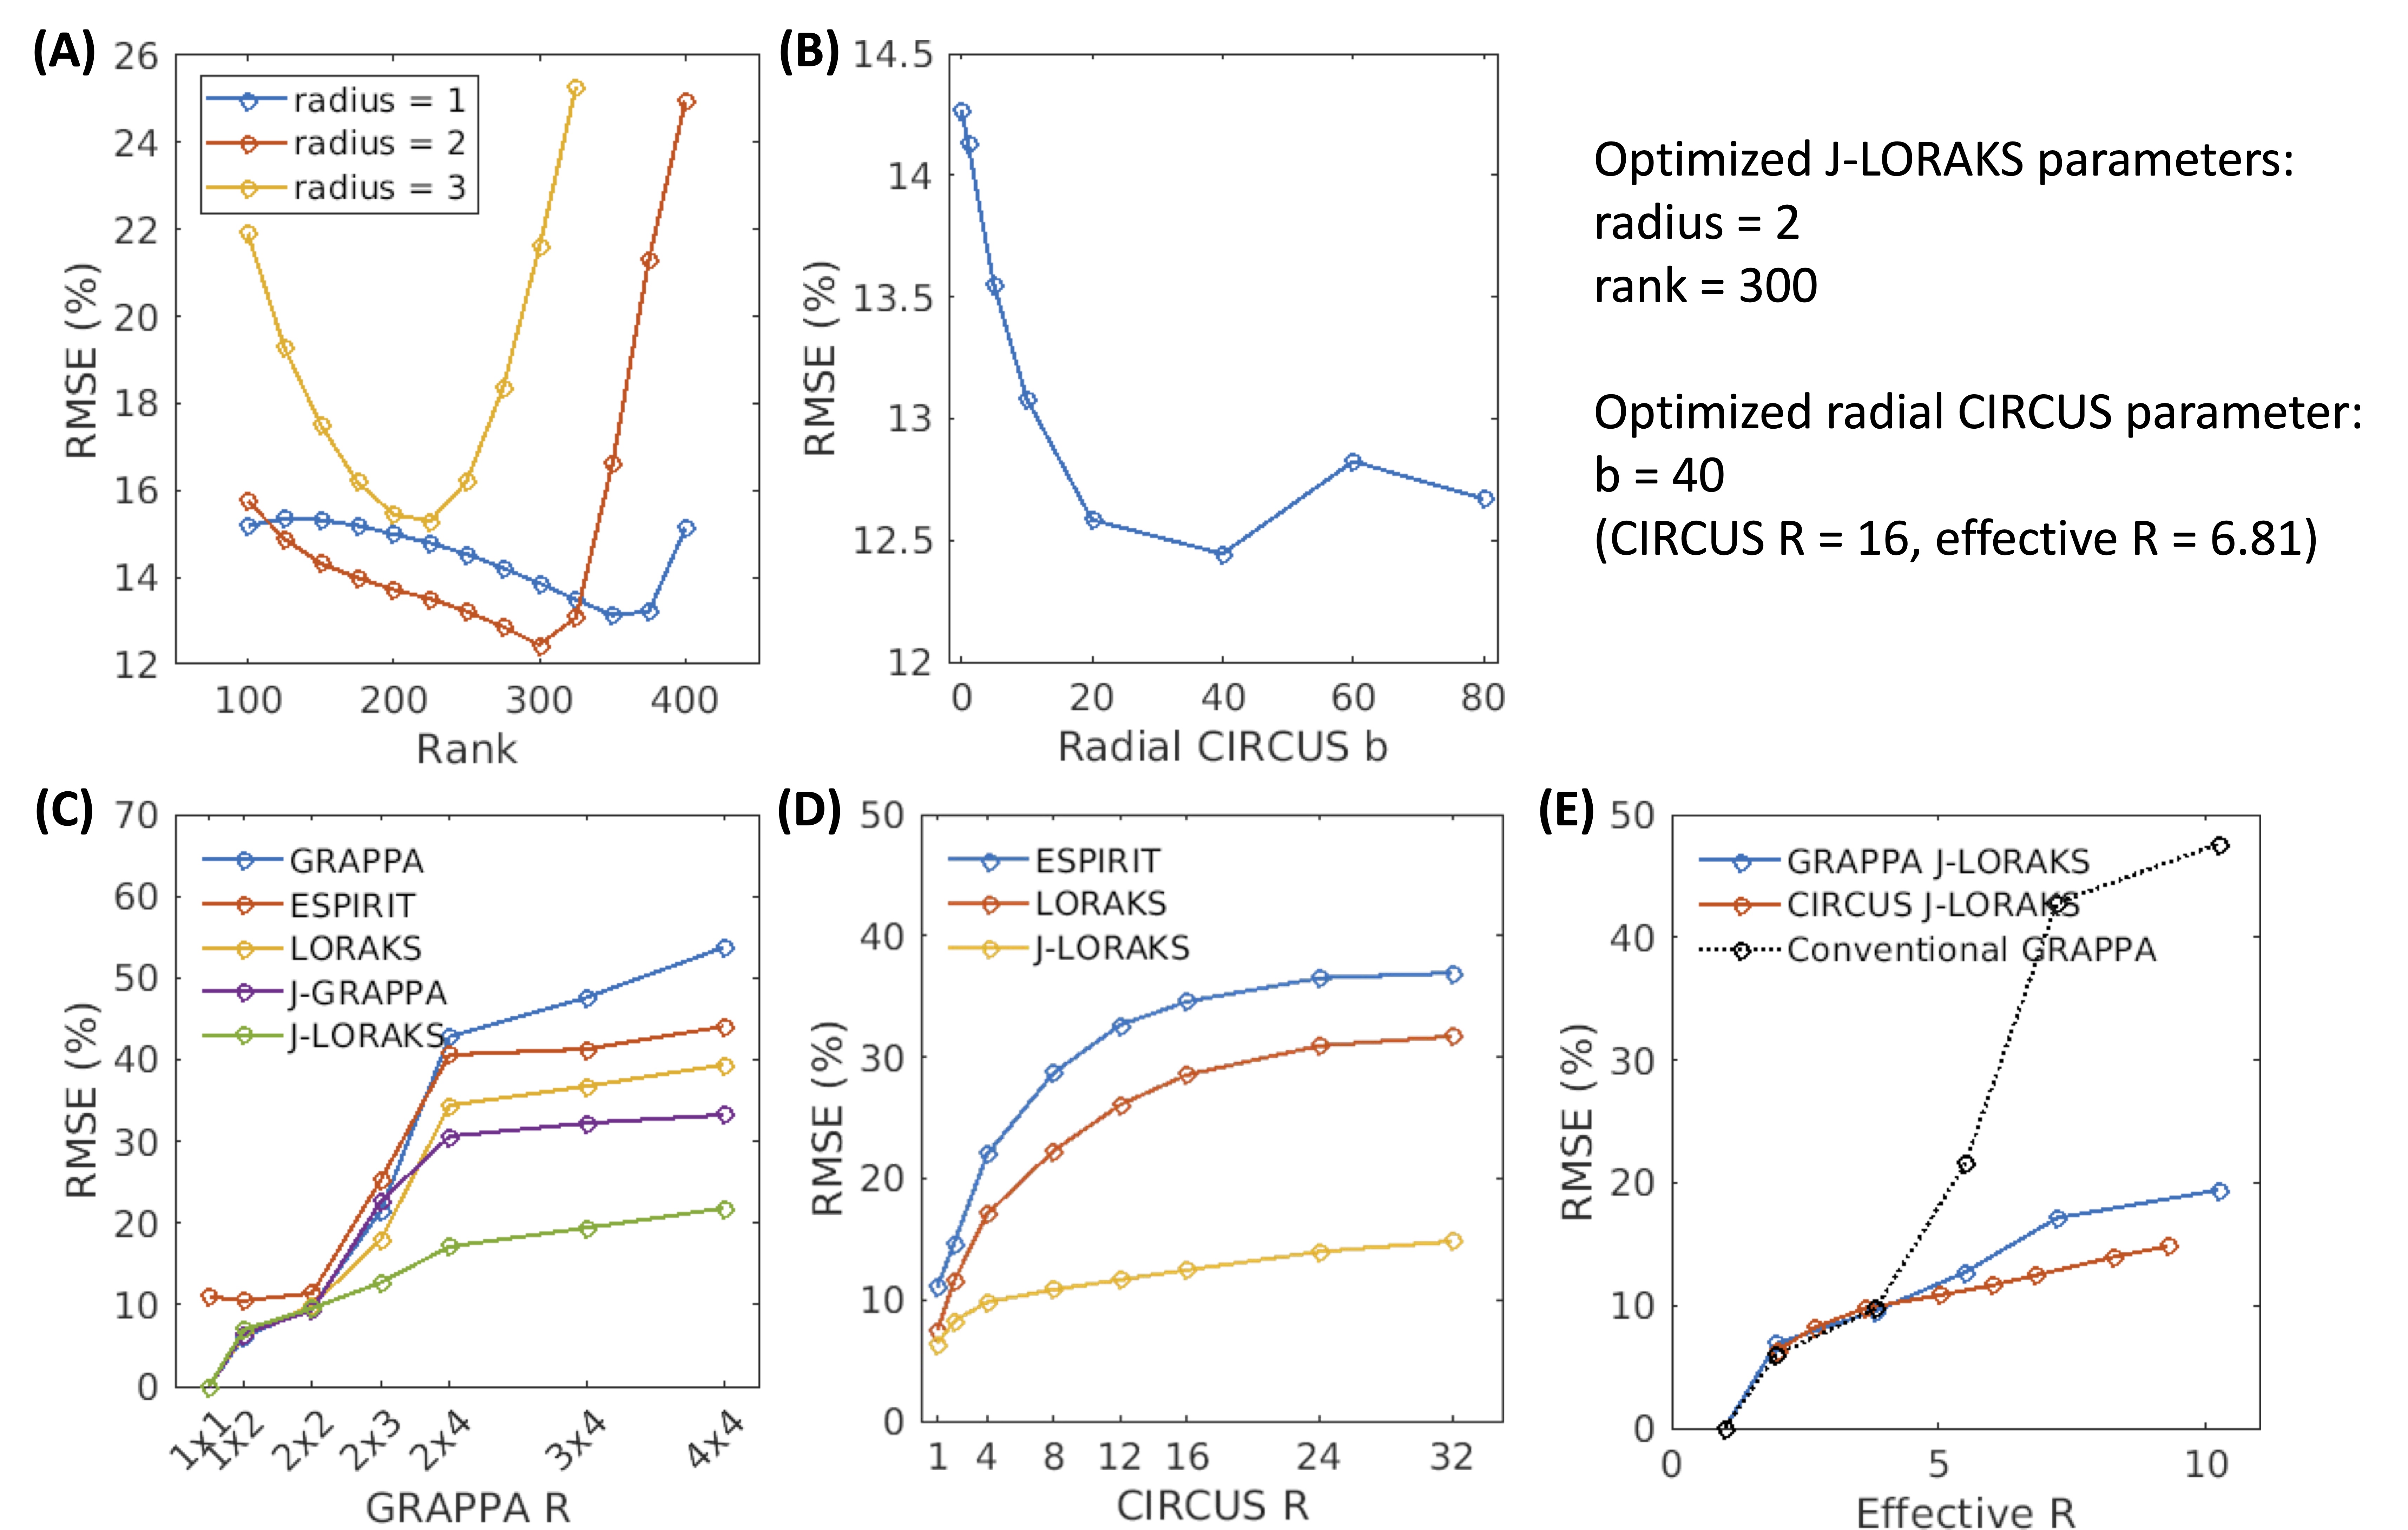
Figure 2. Parameter optimization and comparison of methods with different acceleration factors. (A) and (B) plotted the reconstruction errors using different parameters of Joint-LORAKS and CIRCUS sampling. (C) and (D) showed the reconstruction errors at different acceleration rates in GRAPPA and CIRCUS sampling. (E) plotted the comparison of Joint-LORAKS reconstruction errors using both sampling methods and compared with the conventional GRAPPA.
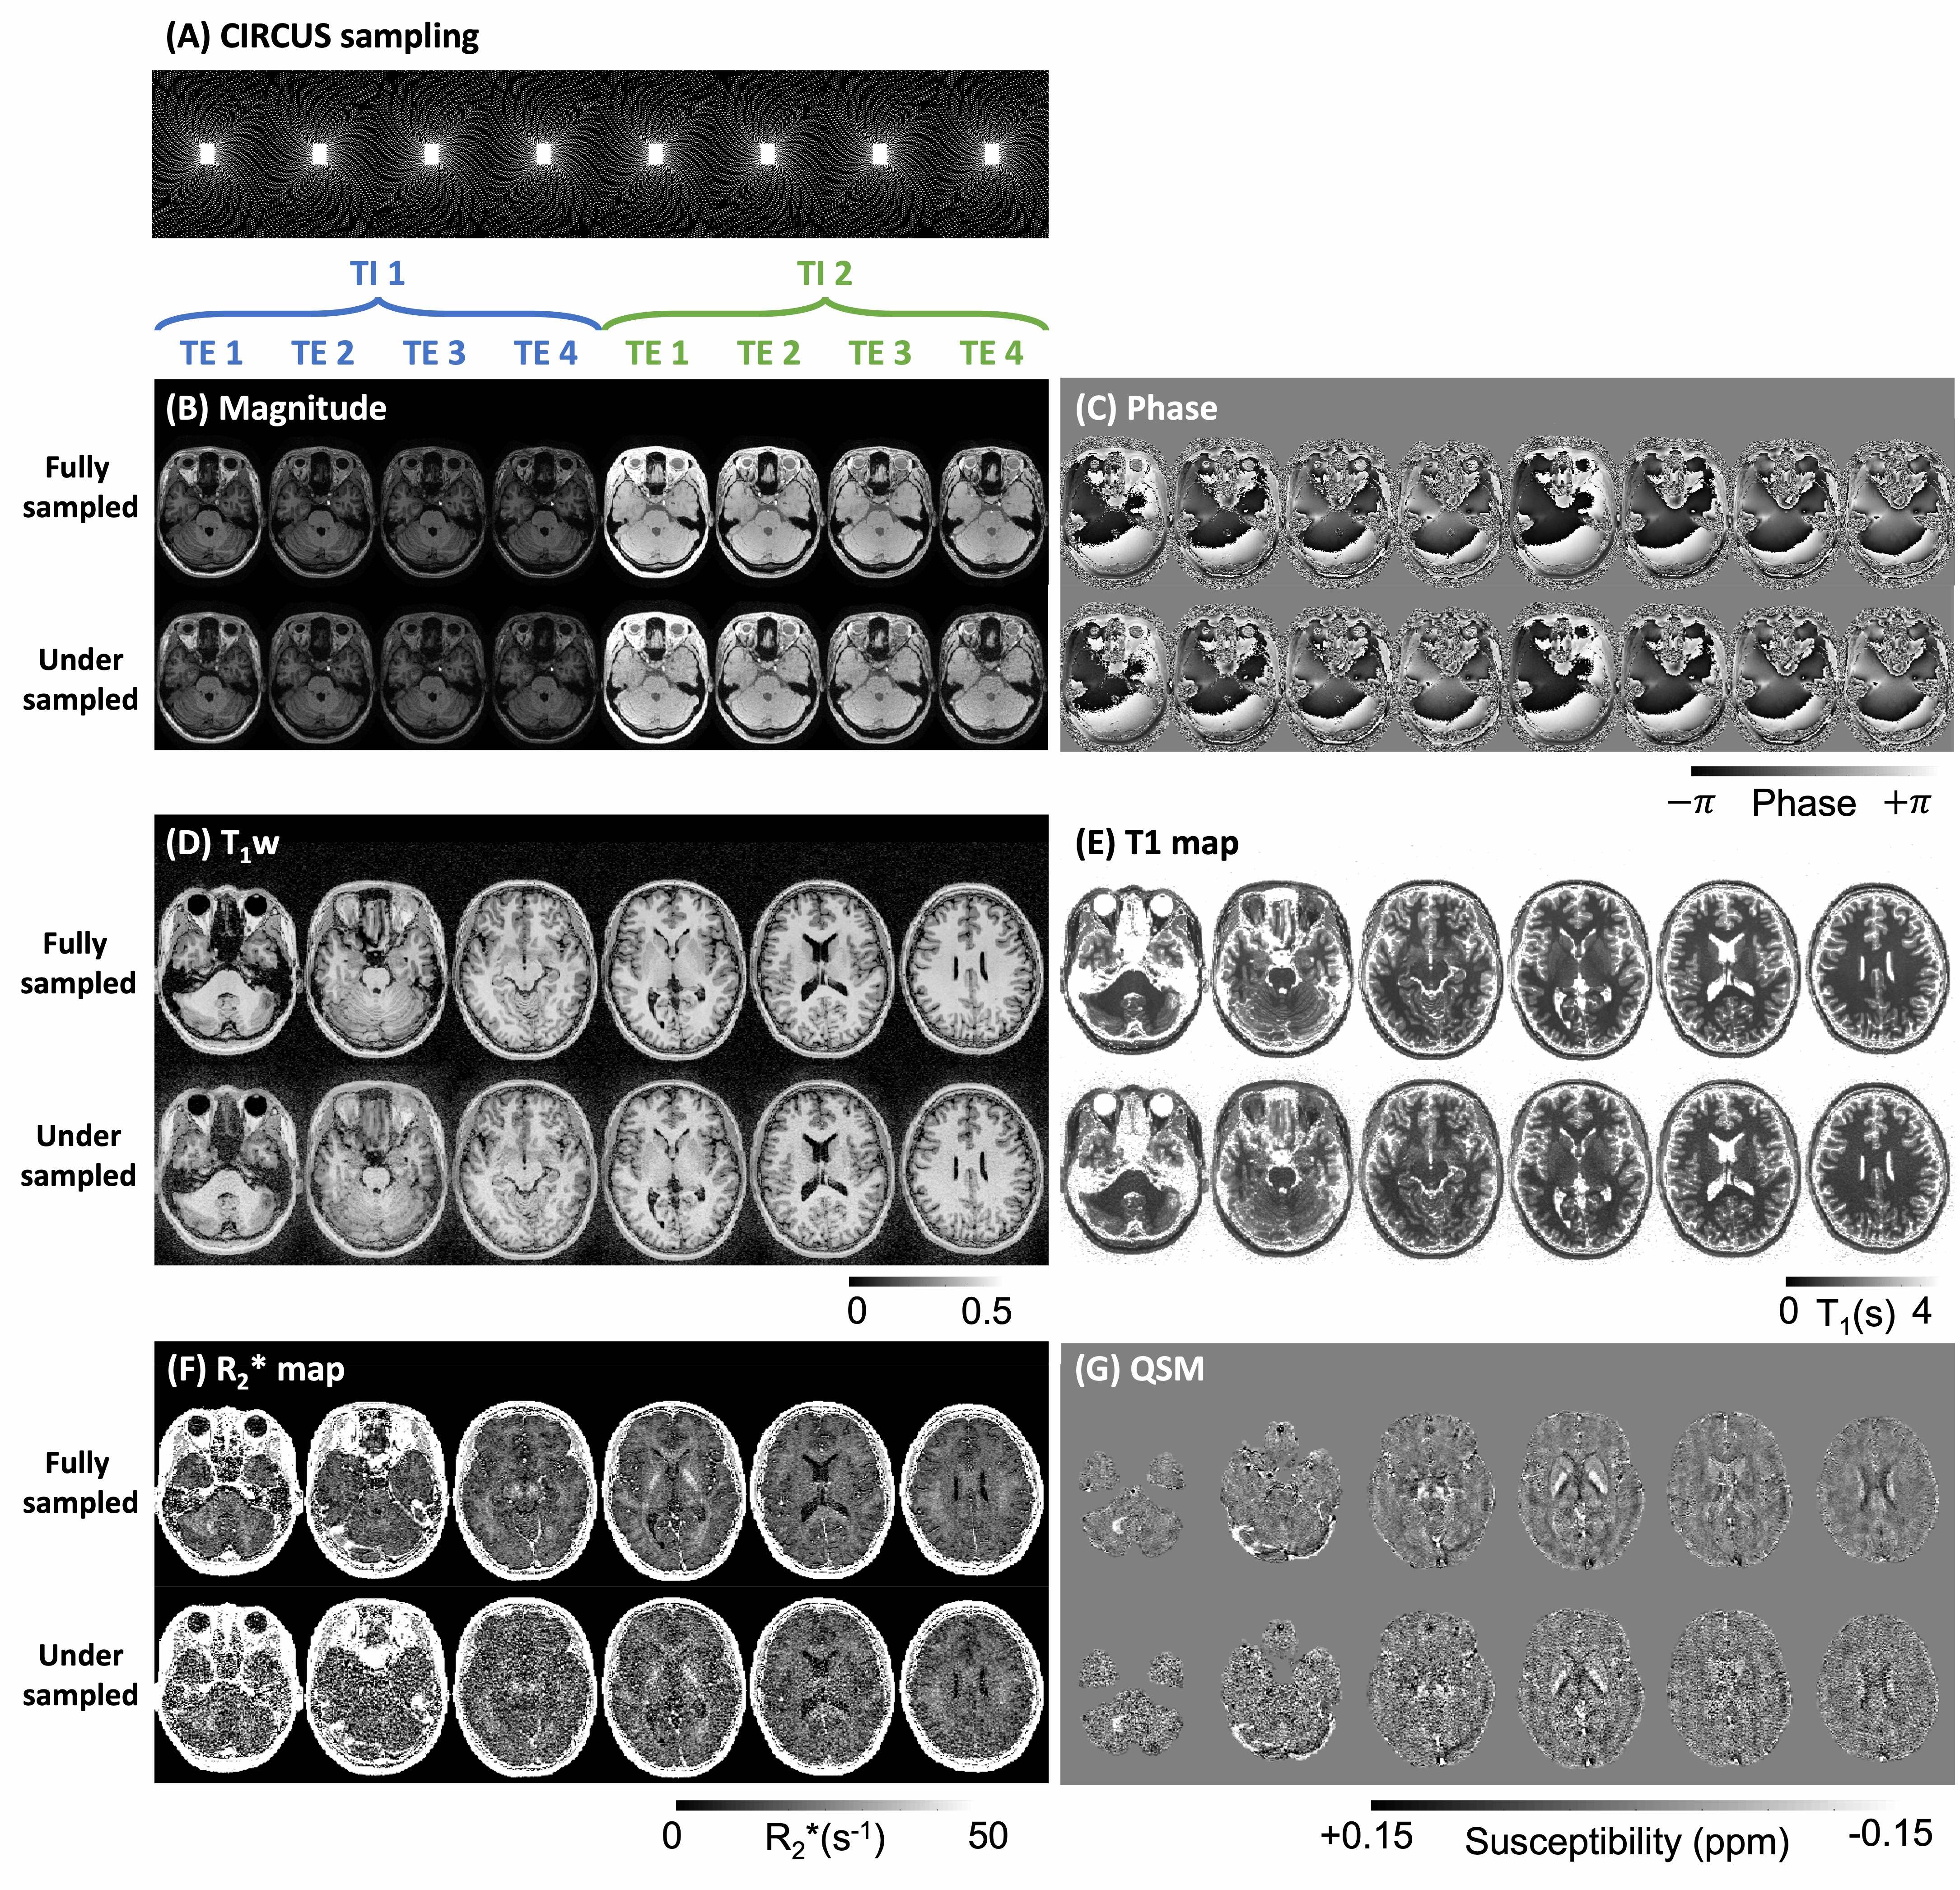
Figure 3. Comparisons of the reconstructed images and derived parametric maps from fully-sampled and undersampled data. (A) showed the CIRCUS sampling patterns interleaving at each contrast (2 TI x 4 TE). (B) and (C) illustrated the magnitude and phase images from an example slice of fully-sampled and undersampled data. The T1-weighted images (D), T1 maps (E), R2* maps (F), and QSM (G) were demonstrated and compared between fully-sampled and undersampled data.
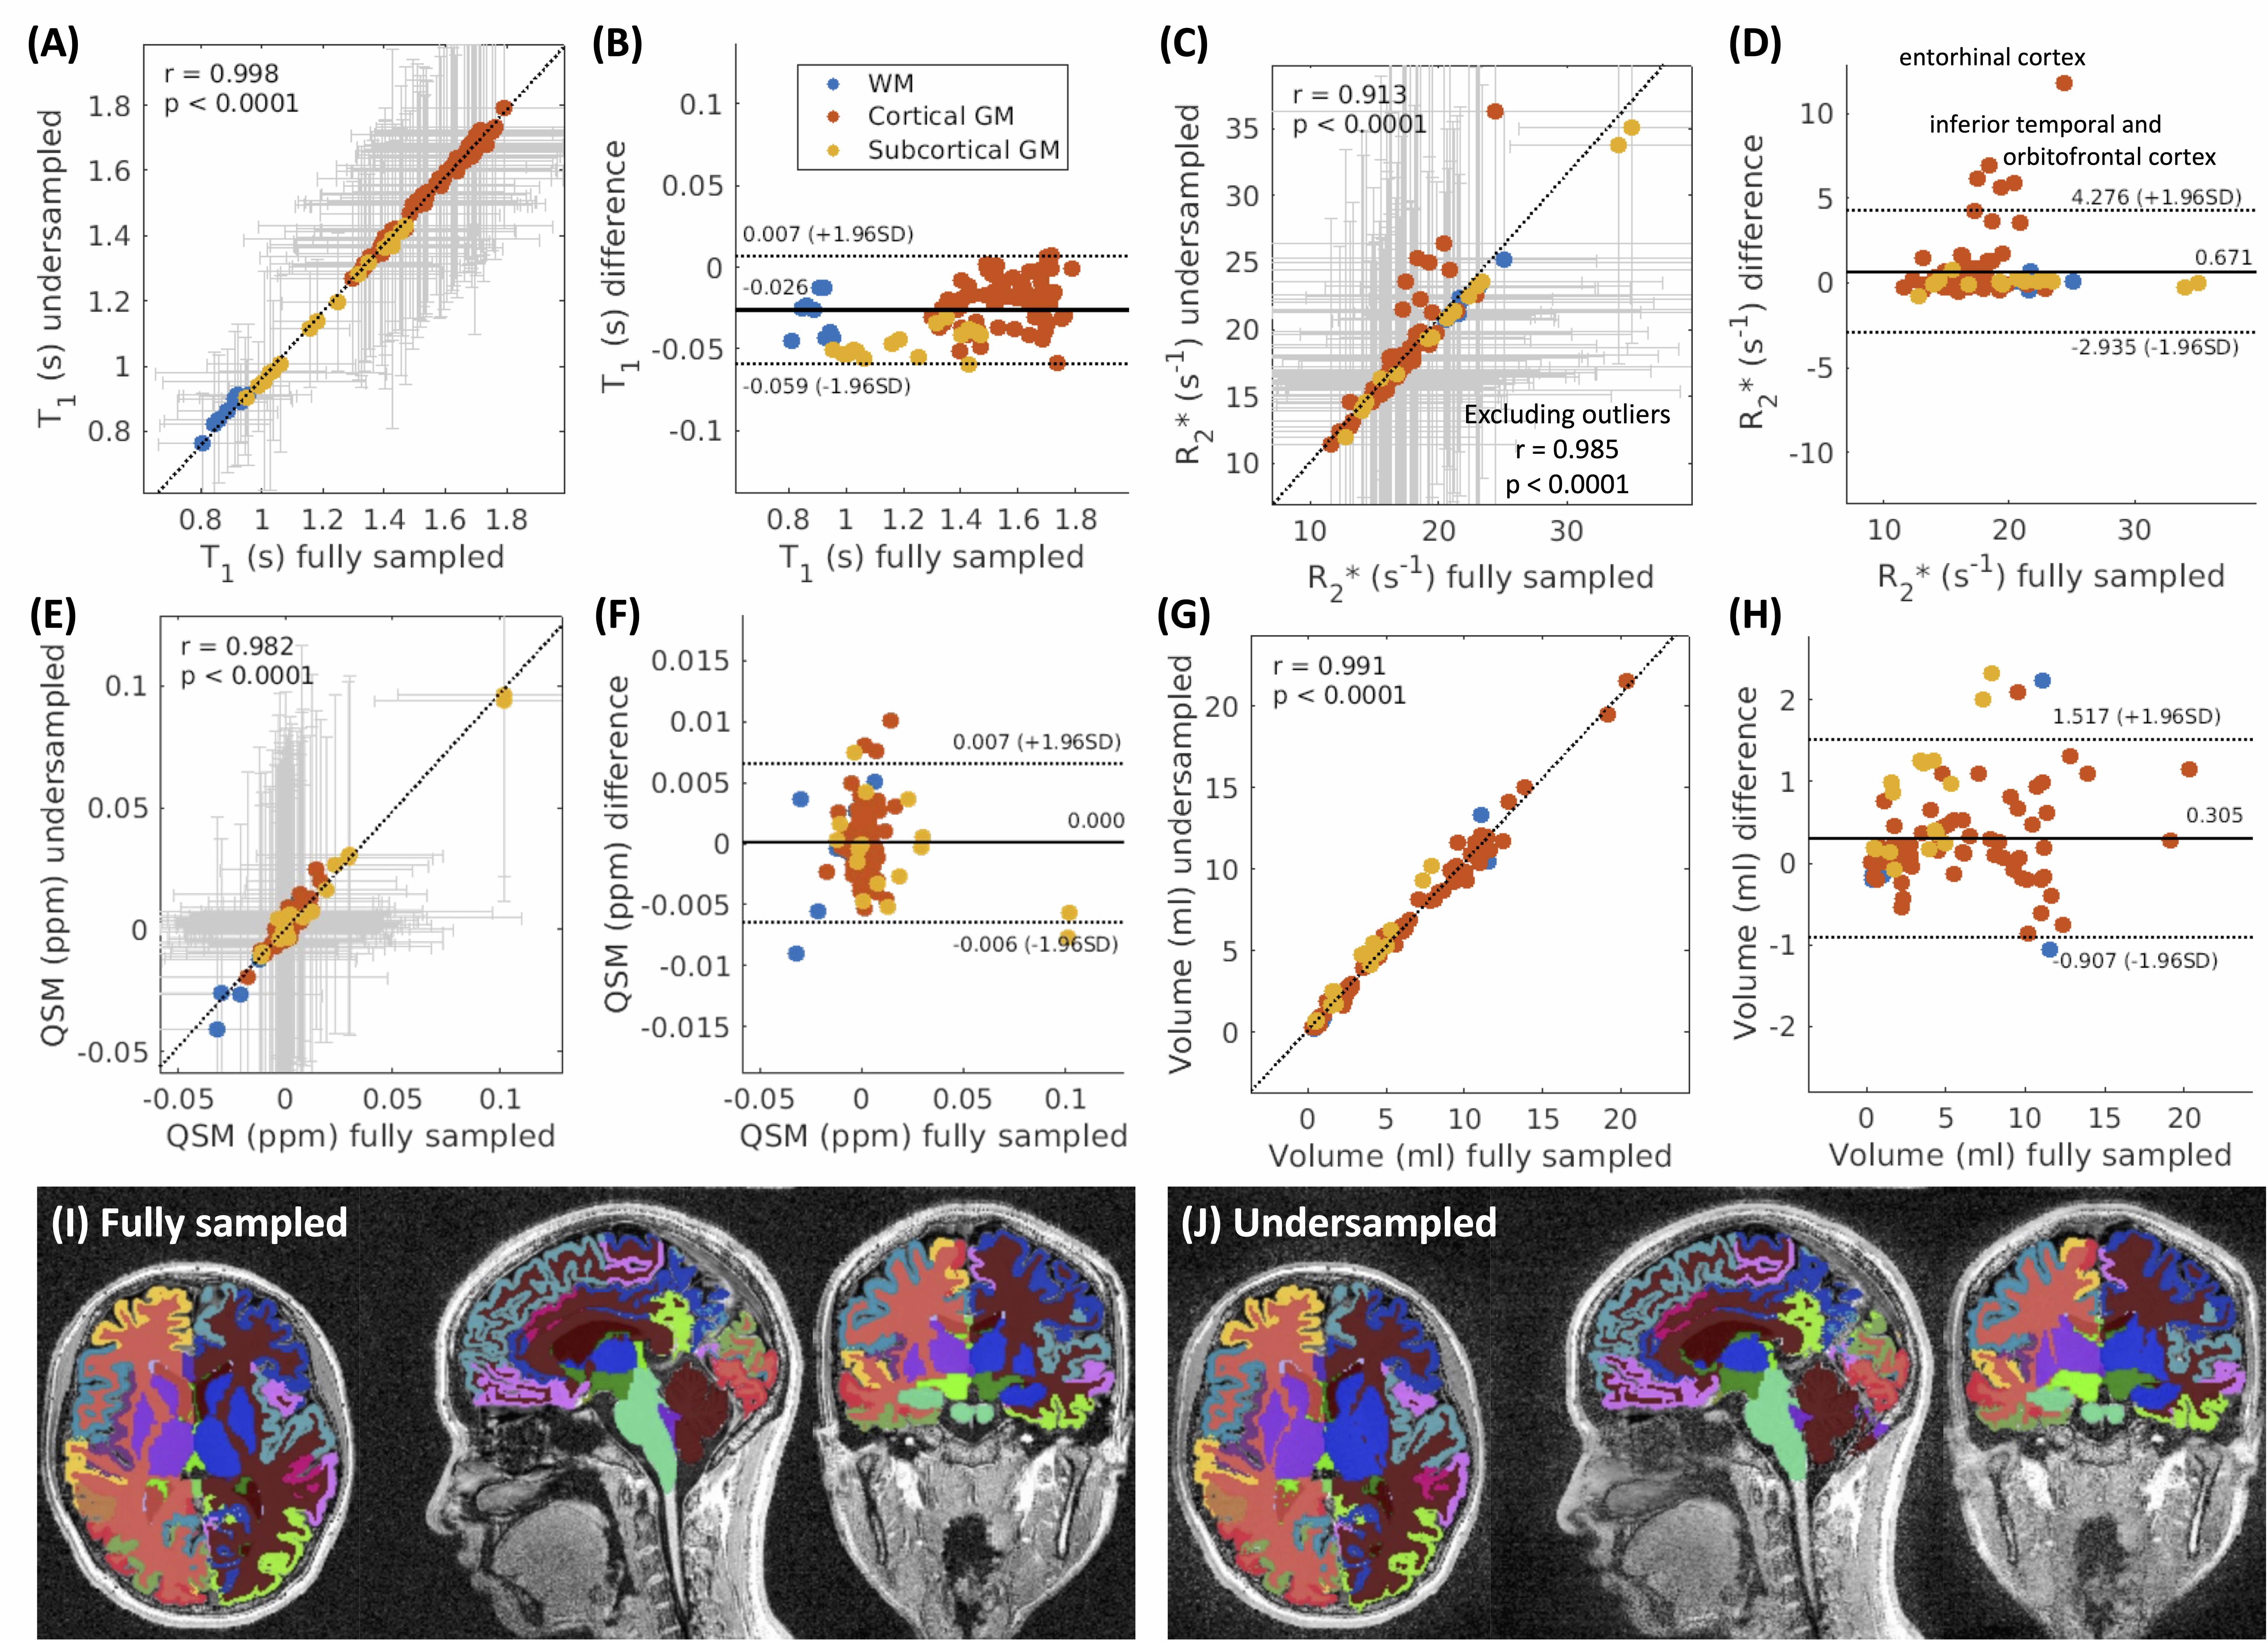
Figure 4. Comparisons of quantitative measurements using fully-sampled and undersampled data. The correlation and Bland-Altman plots of T1 (A), R2* (B), QSM (C), and volume (D) in different brain regions were demonstrated. Each data point represented the mean measurement of one region, and the gray error bars represented the standard deviation. The Bland-Altman plots illustrated the mean and 95% intervals of the difference between undersampled and fully-sampled quantifications. The tissue segmentation results were illustrated in (E) and (F).