0268
Soma and Neurite Density Imaging (SANDI) characterizes microscopic differences between two glioma mouse model subtypes1Champalimaud Research, Champalimaud Foundation, Lisbon, Portugal, 2Cardiff University Brain Research Imaging Centre, School of Psychology, Cardiff University, Cardiff, United Kingdom, 3School of Computer Science and Informatics, Cardiff University, Cardiff, United Kingdom, 4Institute for Research & Innovation in Health (i3S), University of Porto, Porto, Portugal
Synopsis
Keywords: Tumors, Diffusion/other diffusion imaging techniques
Diffusion MRI (dMRI) provides an indirect characterisation of tissue features at the microscopic-scale. The Soma and Neurite Density Imaging (SANDI) methodology was initially proposed to quantity parameters of cell soma and neurite in brain white and gray matter. Here, we investigate the potential of employing SANDI as a general representation of isotropic, restricted, highly anisotropic and isotropic Gaussian components in two mouse models of glioma, derived from two cell lines with distinct microstructure (CT2A and GL261). The results reveal differences across the two tumour subtypes which are consistent with qualitative histological assessment.Introduction
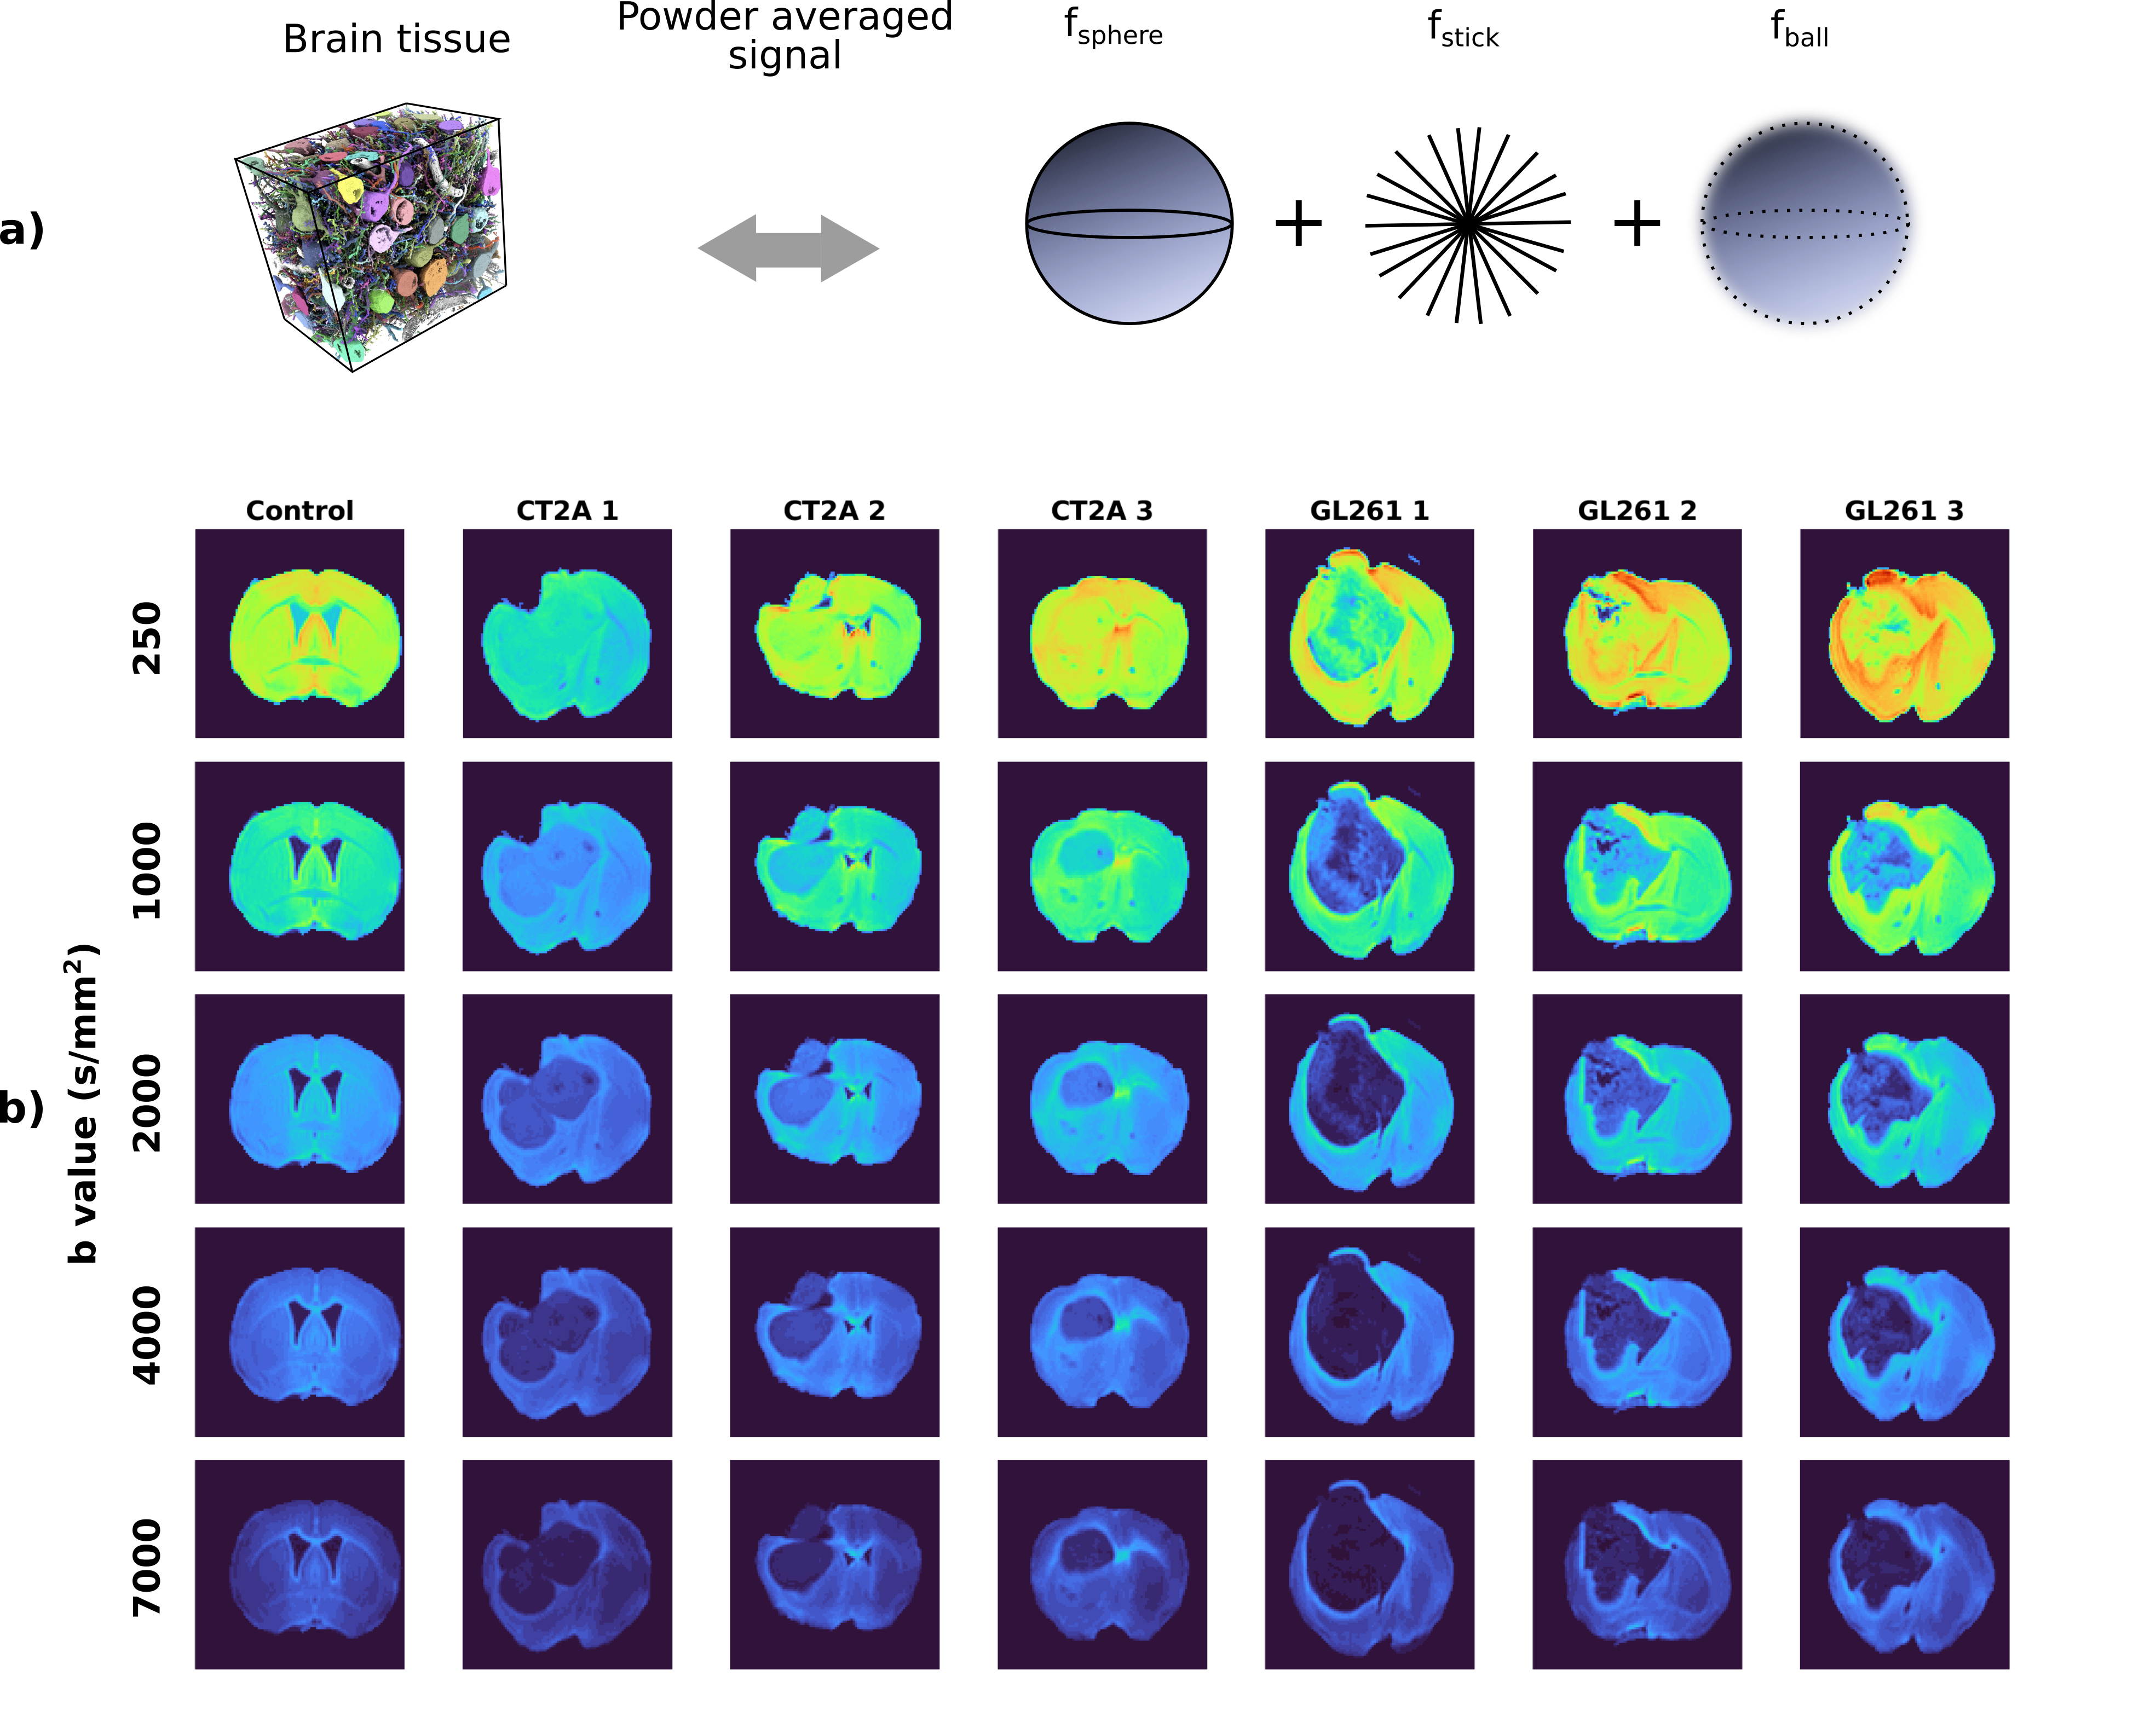
Diffusion MRI (dMRI) provides an indirect characterisation of tissue features at the microscopic-scale. Many dMRI approaches have been proposed to characterize different tissue properties, for example neurite density, axon diameter, cellular sizes, etc1,2,3,4. Among them, the SANDI methodology5,6 has been recently proposed to map apparent soma size and density, as well as neurite density, from diffusion MRI data. SANDI employs diffusion measurements over a wide range of b-values and models the powder averaged signal with three compartments: diffusion restricted in spheres, representing isotropically restricting structures (e.g. cell bodies), in sticks, representing anisotropically restricting structures (e.g. cell processes and very elongated cells) and isotropic Gaussian diffusion representing the extracellular space. So far, SANDI has been employed to characterize healthy brain tissue in humans and rodents5,6, and tissue changes due to neurological conditions, such as Alzheimer’s disease7 and Multiple Sclerosis8. In addition to the quantification of soma and neurite parameters in brain tissue, SANDI can be used more generally to represent the signal contribution of three compartments with these specific diffusion signatures. In this case, the interpretation of the model parameters can vary depending on the tissue type.Here, we investigate the feasibility of employing the SANDI methodology to characterize brain tumour microstructure in two mouse models of glioma, derived from two cell lines (CT2A and GL261), that result in tumours with different histopathological features.
Methods
All experiments were preapproved by the competent institutional and national authorities and were carried out in accordance with European Directive 2010/63.Mouse model: Gliomas were induced in C57BL/6J mice by intracranial stereotactic injection of GL261 or CT2A cells9,10.
Ex-vivo experiments: Three brains for each glioma subtype were extracted 2-3 weeks post inoculation following transcardial perfusion with 4% paraformaldehyde and mounted in 10 mm NMR tubes. MRI data was acquired at 37 oC on a 16.4T Aeon Ascend Bruker scanner equipped with a cryocoil. dMRI data was acquired with a standard PGSE-EPI sequence: TR/TE=3000/20 ms, 4 shots, in-plane resolution = 0.1x0.1 mm2, slice thickness=0.4 mm, matrix=104x94, δ/Δ=3/10 ms, b-values={250, 500, 1000, 1500, 2000, 3000, 4000, 5000, 7000, 9000} s/mm2 with 24 directions per shell.
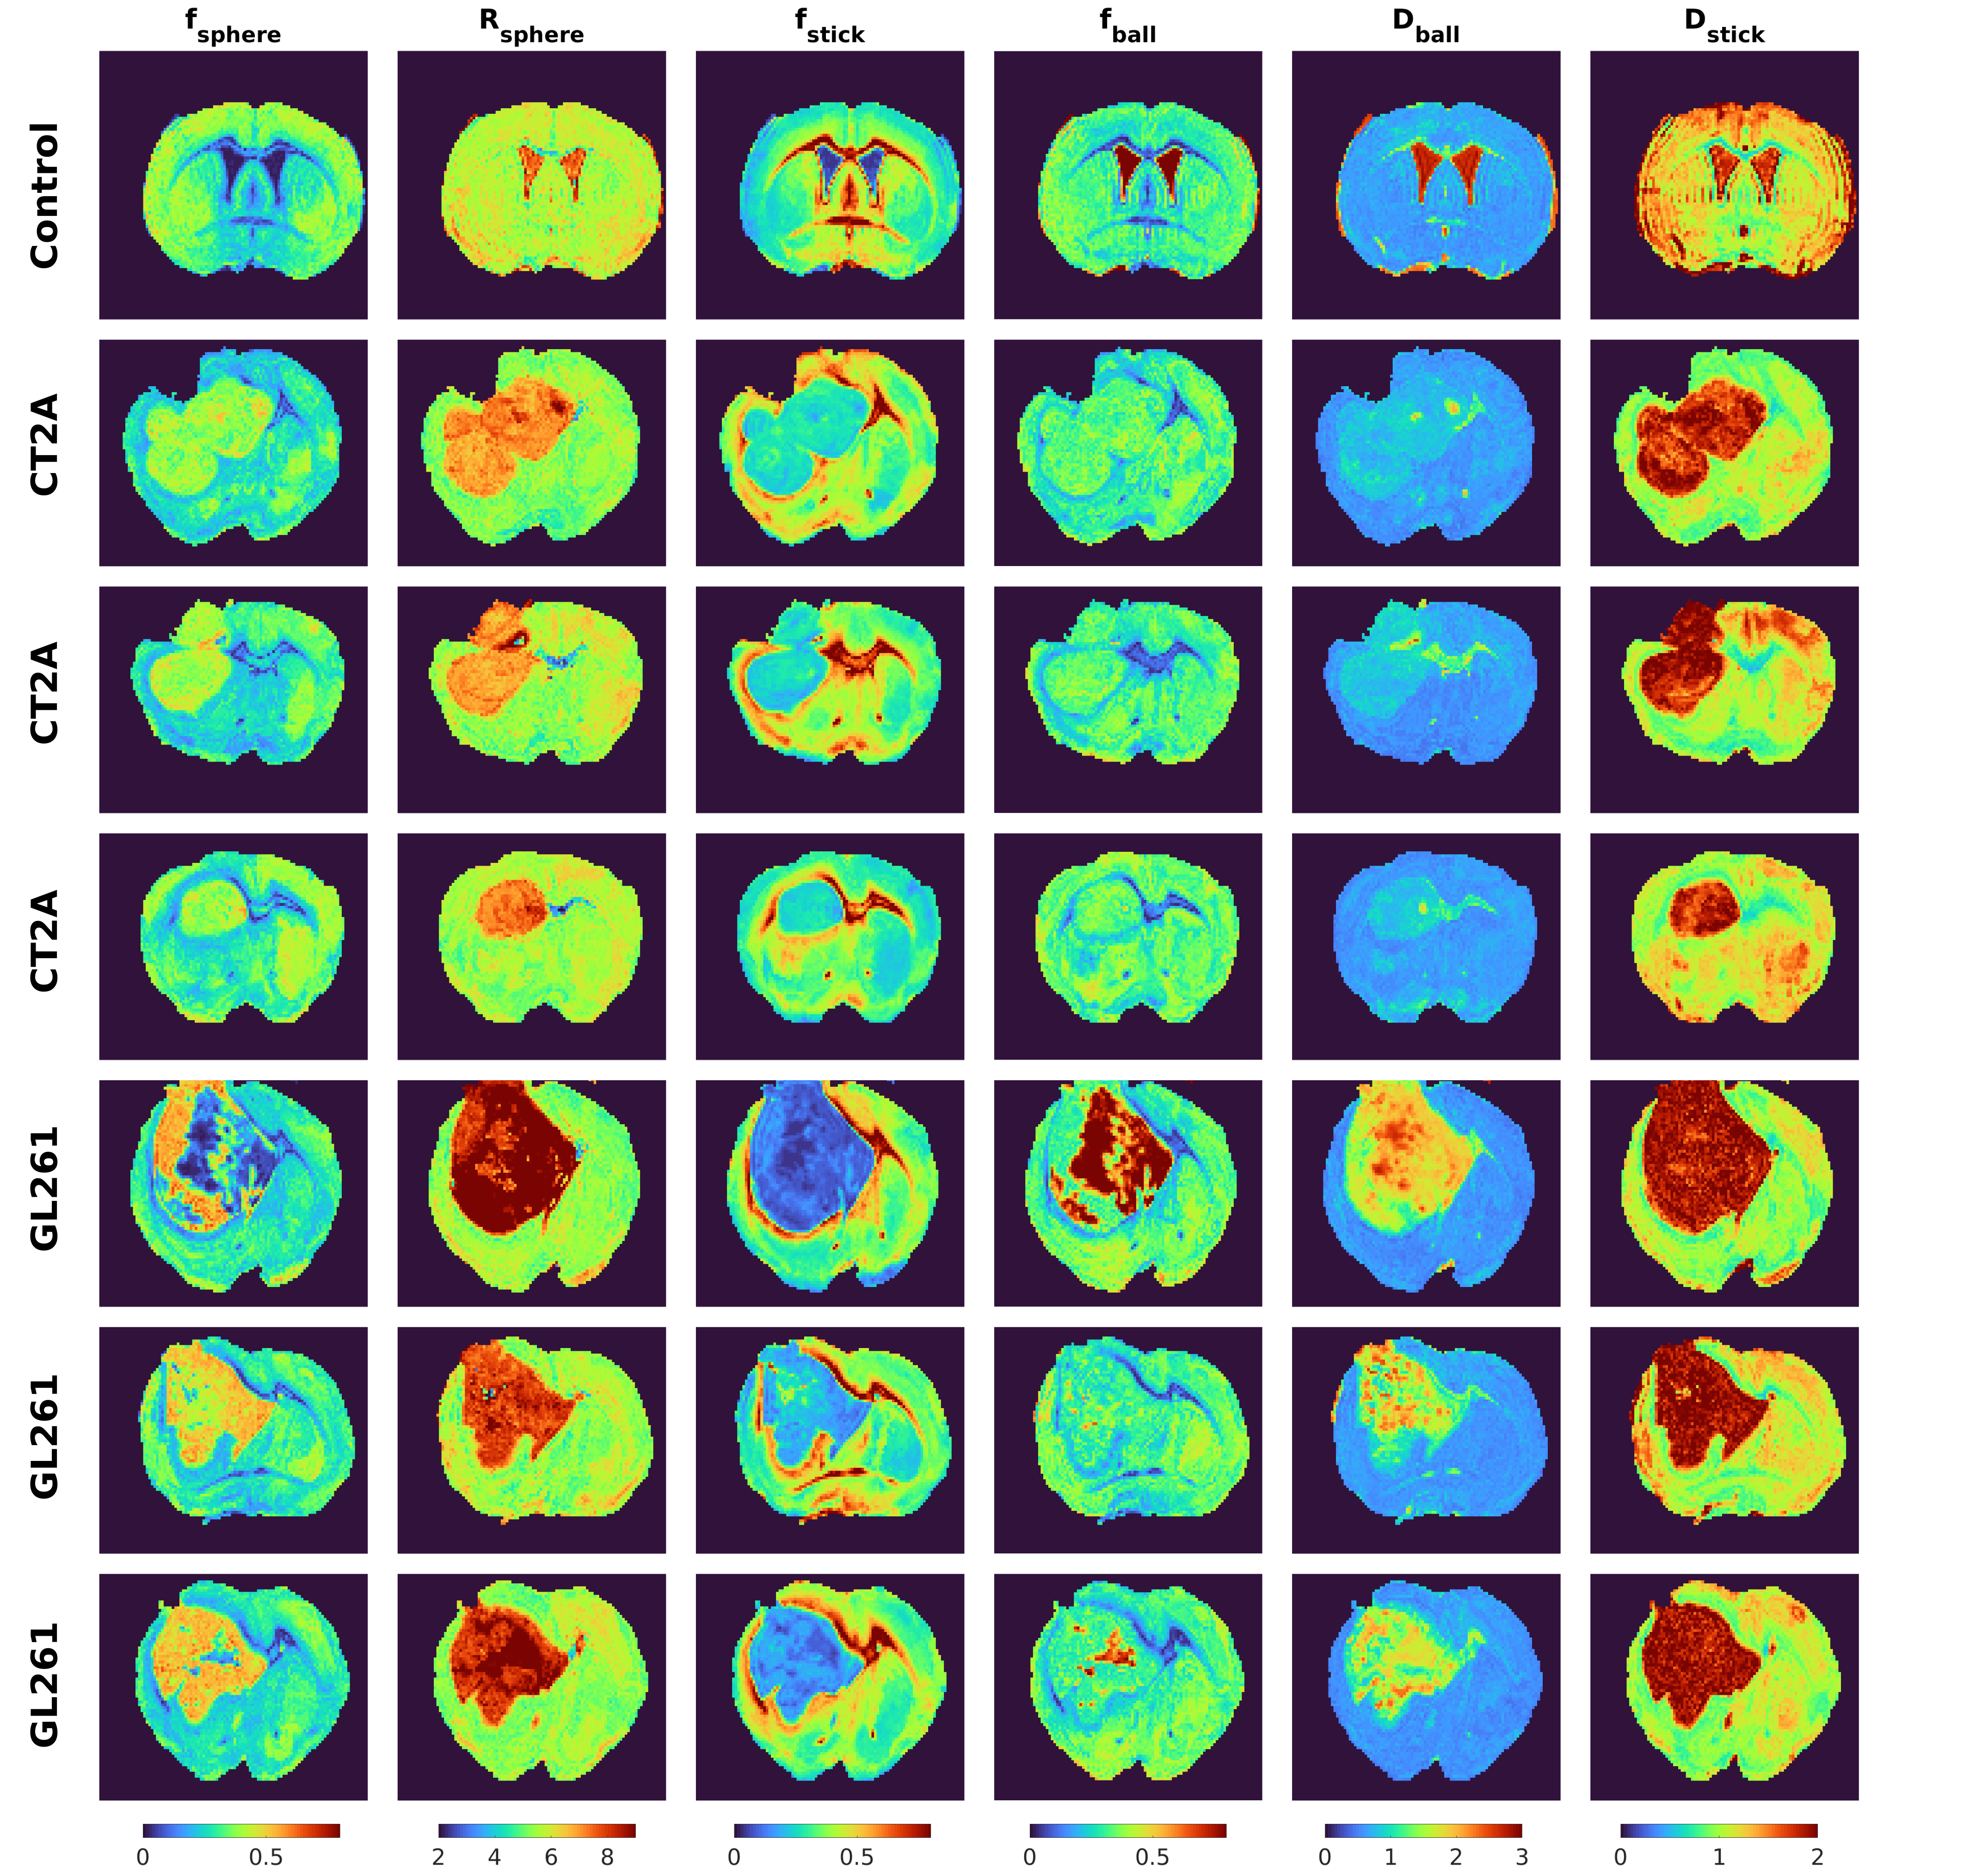
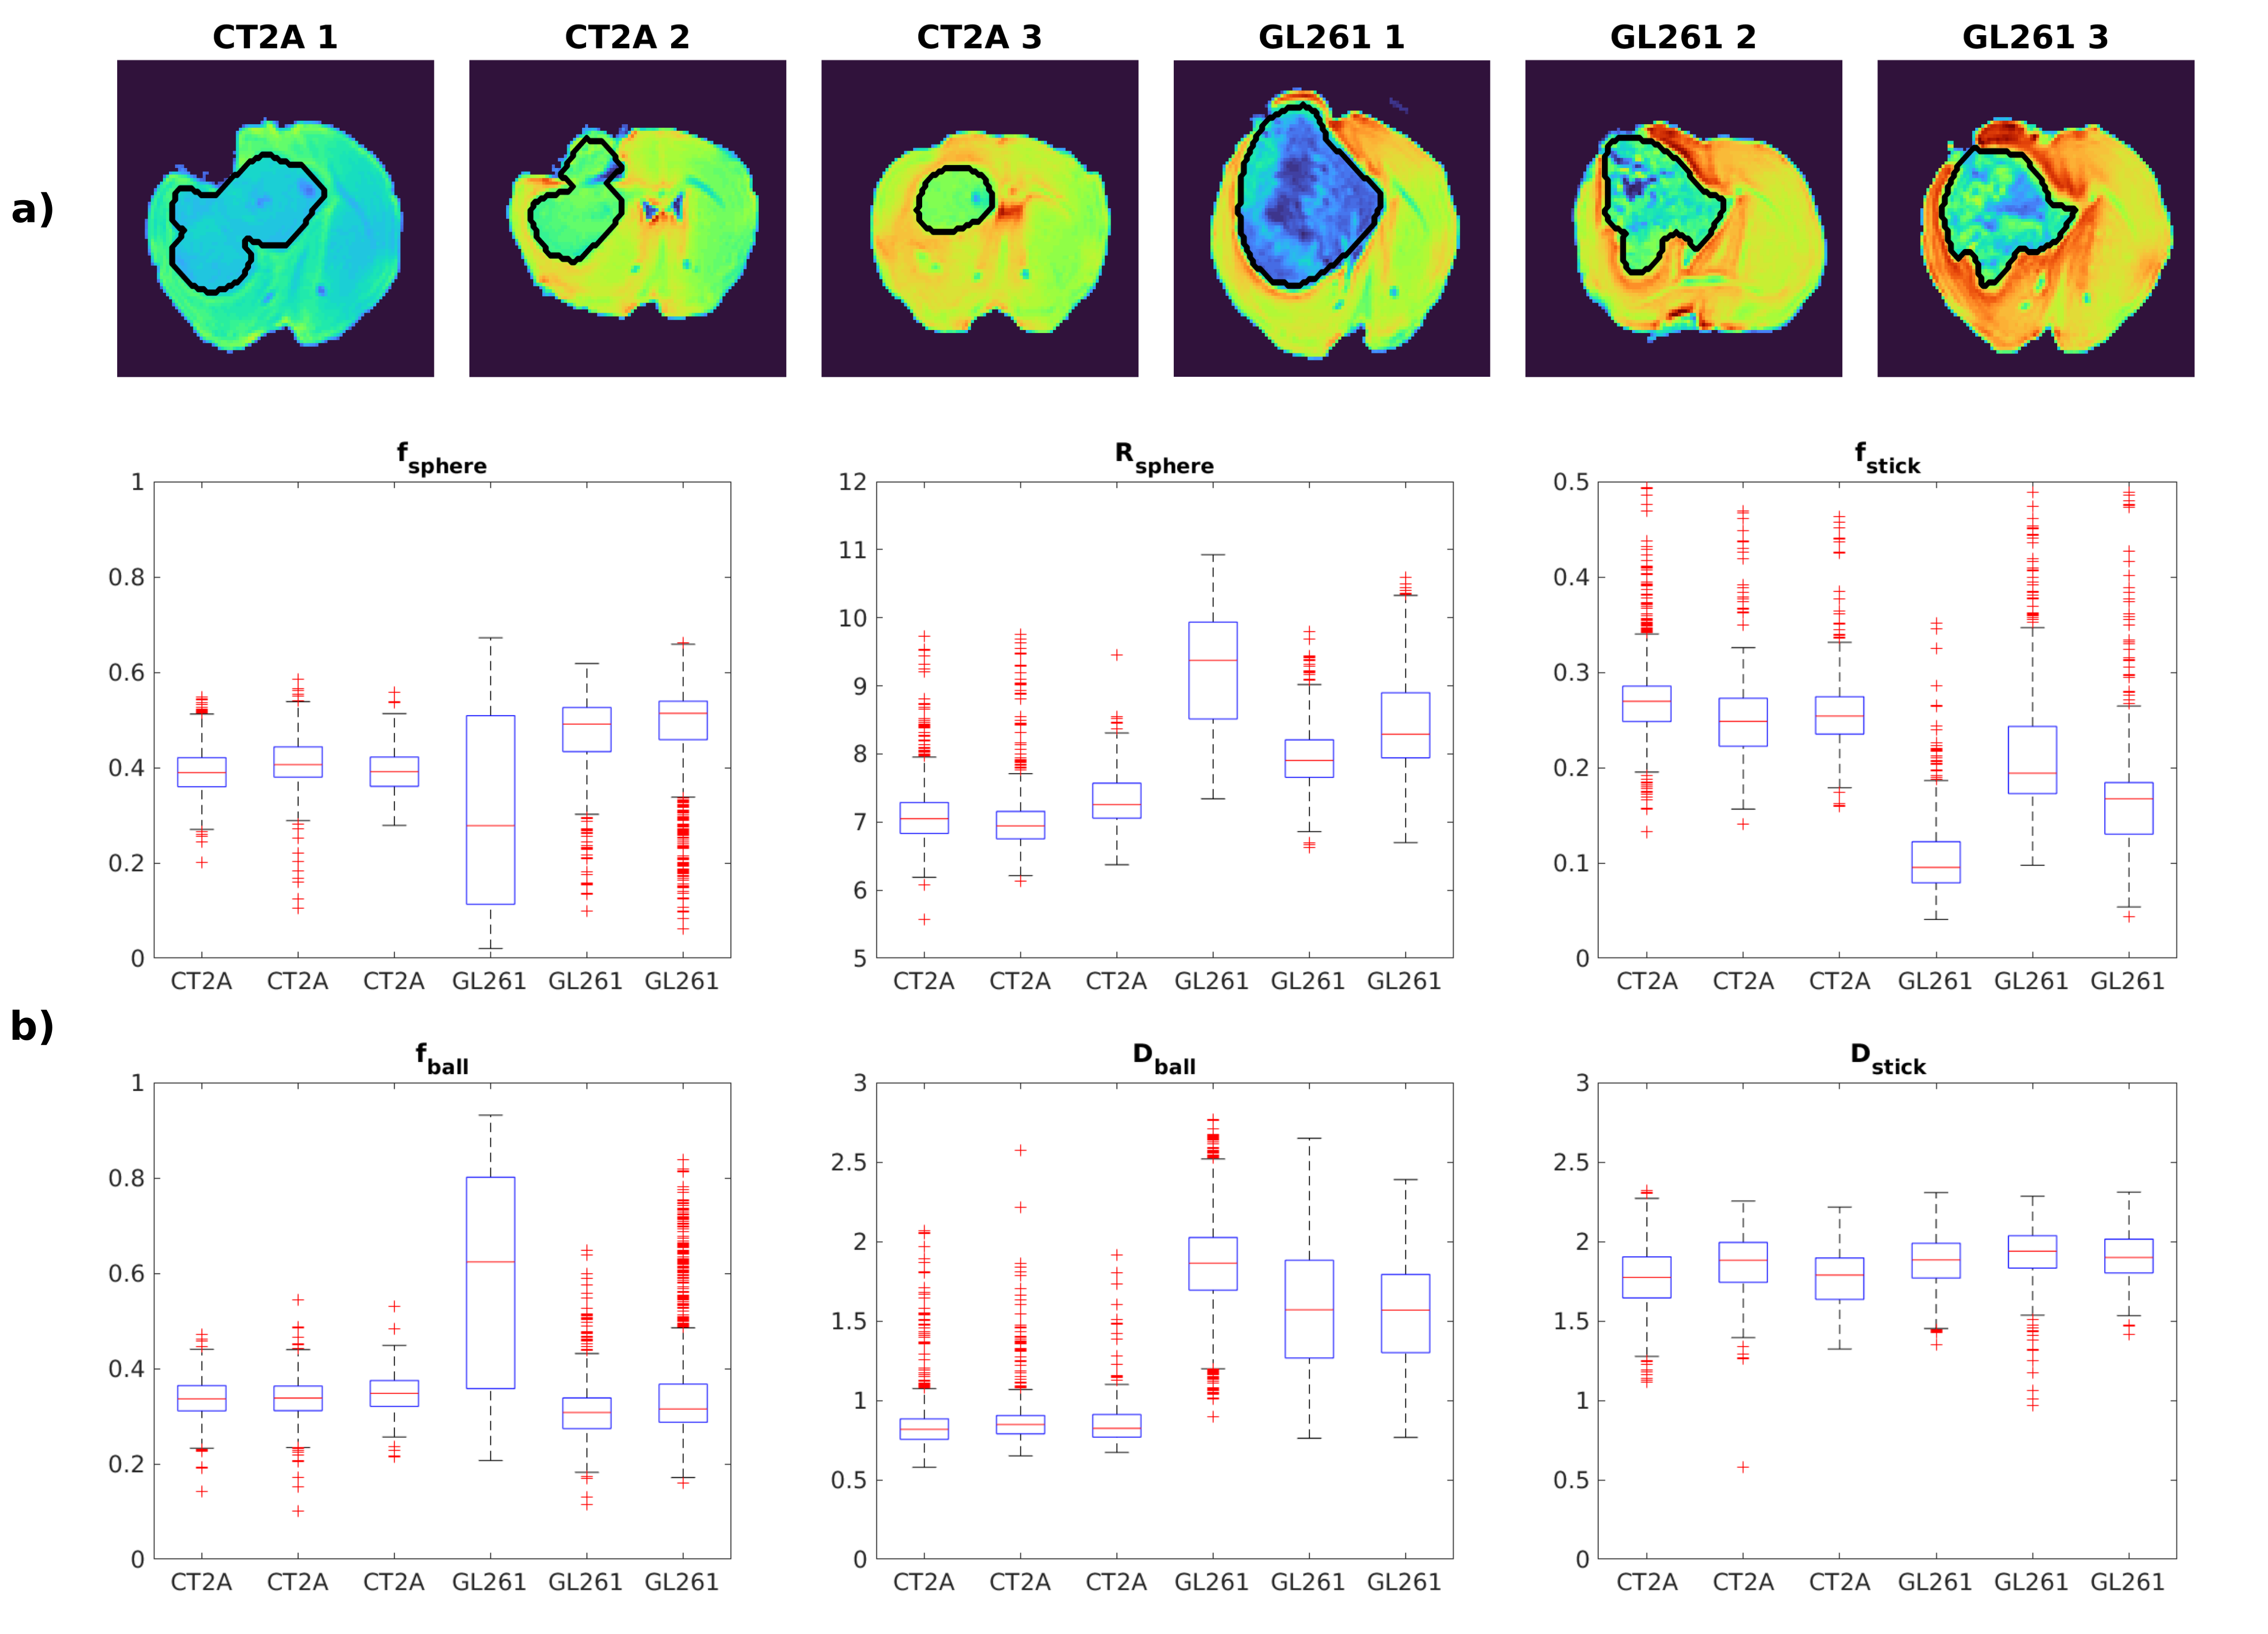
Data analysis: Data was first denoised using MP-PCA11, then shell-wise powder-averaged and normalized to data with b = 100 s/mm2 to avoid effects of radiation damping present in the non-diffusion weighted data. The SANDI model (Fig.1a) was fitted using a multi-layer-perceptron with three layers and 20 units per layer in Matlab, using the constraints detailed in6 and the implementation publicly available at https://github.com/palombom/SANDI-Matlab-Toolbox. The estimated parameters are: fsphere, fstick, Rsphere, fball, Dball, Dstick. Tumour ROIs were manually delineated for each sample.
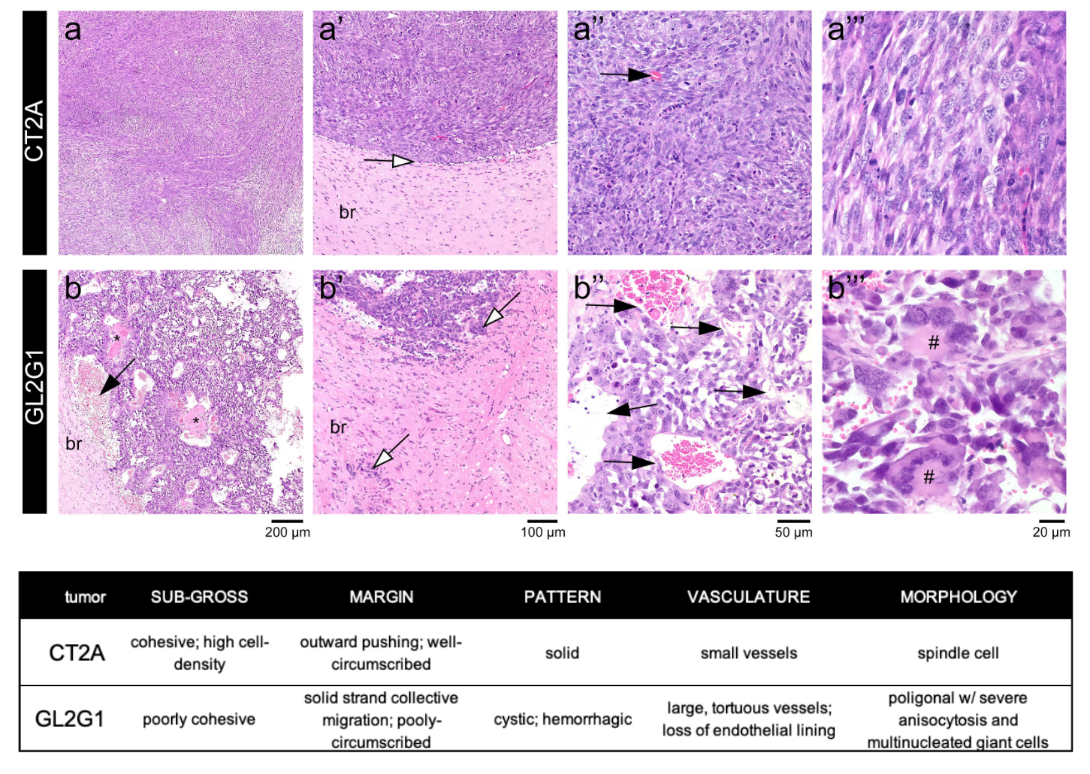
Histopathological analysis: After ex vivo MRI acquisitions, each brain was formalin-fixed, paraffin-embedded, sectioned at 4 µm from striatum to caudal hippocampus, and stained with hematoxylin and eosin. Slides were examined by an experienced pathologist using an Axioscope 5 microscope coupled to an Axiocam 208. Morphological features of the tumours are described in Fig.4.
Results
Fig.1b illustrates the powder-averaged data for several b-values. The tumour signal for both subtypes decays faster compared to normal brain tissue, highlighting higher diffusivity values. Fig.2 illustrates the SANDI parameter maps for all the samples and Fig.3 presents boxplots of the parameter values for the two tumour types in manually delineated ROIs. GL261 tumours have higher estimated values of Rsphere and Dball and lower values of fstick compared to CT2A tumours. These findings are consistent with histological information presented in Fig.4, showing that cells in the CT2A tumours are smaller and more anisotropic, while GL261 tumours are more heterogeneous with cysts and edema areas. Importantly, some parameter maps (fsphere, and particularly fstick) seem relevant for characterizing the peri-tumor effects of glioma and how they span throughout the brain, compared to the control sample.Discussion
This work investigates how the SANDI methodology - which was originally designed for mapping brain tissue composition - generalizes towards characterization of non-brain tissue, specifically looking at a mouse model of glioma. The model parameters show marked differences between the two glioma subtypes, consistent with the morphological characteristics of each tissue and a more general interpretation of the SANDI spherical and stick compartments representing isotropic and anisotropic cellular restrictions. The methodology also demonstrates potential for assessing peri-tumoral effects, with higher fstick values near the tumour boundary compared to the normal brain parenchima. Limitations: the diffusion time of this acquisition (Δ=10 ms), chosen to minimize the effects of diffusion exchange, might not be long enough to probe restriction in the giant cells from the GL261 subtype, thus Rsphere values in the GL261 tumours might be underestimated. Besides the modeling limitations of SANDI, the current study does not provide a quantitative comparison between histology and MRI parameters, which will be the focus of future work.Conclusion
SANDI methodology shows promising results for characterizing brain tumour microstructure in a mouse model of glioma.Acknowledgements
AI and RC are supported by ”la Caixa” Foundation (ID 100010434) and European Union’s Horizon 2020 research and innovation programme under the Marie Skłodowska-Curie grant agreement No 847648, fellowship code CF/BQ/PI20/11760029. MP is supported by UKRI Future Leaders Fellowship (MR/T020296/2). RNH was supported by the Scientific Employment Stimulus 4th Edition from Fundação para a Ciência e Tecnologia, Portugal, ref 2021.02777.CEECIND.References
[1] Alexander et al, Imaging brain microstructure with diffusion MRI: practicality and applications, NMRBiomed (2018) 32(4): e3841
[2] Novikov et al, Quantifying brain microstructure with diffusion MRI: Theory and parameter estimation, NMRBiomed (2018) 32(4): e3998
[3] Jespersen et al, Neurite density from magnetic resonance diffusion measurements at ultrahigh field: comparison with light microscopy and electron microscopy, Neuroimage (2010) 49(1):205-16
[4] Veraart et al, Noninvasive quantification of axon radii using diffusion MRI, eLife (2020) 9:e49855
[5] Palombo et al, SANDI: A compartment-based model for non-invasive apparent soma and neurite imaging by diffusion MRI, NeuroImage (2020) 215: 116835
[6] Ianus et al, Soma and Neurite Density MRI (SANDI) of the in-vivo mouse brain NeuroImage (2022) 241:118424
[7 ]Ianus et al, Early microstructural aberrations in a mouse model of Alzheimer’s disease detected by Soma and Neurite Density Imaging, ISMRM 2022
[8] Margoni et al, In vivo quantification of brain soma and neurite density abnormalities in multiple sclerosis, Journal of Neurology (2022).
[9] Simões et al., Perturbation of mouse glioma MRS pattern by induced acute hyperglycemia Neoplasia 2008; 17(8): 617-684.
[10] Simões et al, Glucose fluxes in glycolytic and oxidative pathways detected in vivo by deuterium magnetic resonance spectroscopy reflect proliferation in mouse glioblastoma. Neuroimage: Clinical 2022; 33: 102932.
[11] Veraart, J., et al., Denoising of diffusion MRI using random matrix theory. Neuroimage, 2016. 142: p. 394-406.
[12] Motta, A., et al., Dense connectomic reconstruction in layer 4 of the somatosensory cortex. Science, 2019. 366(6469): p.eaay3134.
Figures