0266
Predicting IDH1 Expression using Computational Modeling of Interstitial Fluid Pressure in Glioblastoma1Department of Radiology,Nanjing Drum Tower Hospital Clinical College of Nanjing Medical University, Nanjing,Jiangsu Province,China, China, 2Institute of Medical Imaging and Artificial Intelligence, Nanjing University, Nanjing, China, 3Medical Imaging Center, Affiliated Drum Tower Hospital, Medical School of Nanjing University, Nanjing, China, 4MR Collaboration, Central Research Institute, United Imaging Healthcare, Shanghai, China, Shanghai, China, 5Department of Radiology, The Affiliated Drum Tower Hospital of Nanjing University Medical School, Nanjing,Jiangsu Province,China, China, 6Jiangsu Key Laboratory of Molecular Medicine, Nanjing, China, 7Institute of brain Science, Nanjing University, Nanjing, China
Synopsis
Keywords: Tumors, Contrast Agent
The immunohistochemistry features of glioblastoma have important influence on its occurrence and prognosis. Understanding the noninvasive detection of interstitial fluid pressure (IFP) and velocity (IFV) based on dynamic contrast enhanced (DCE)-MRI to explore the correlation between IFP and IFV with immunohistochemical markers of glioblastoma. The investigation demonstrates that IFP indicators have significant correlation with isocitrate dehydrogenase 1 (IDH1) expression and Ki-67 level of glioblastoma, and could help diagnose IDH1-mutation patients.
Keywords
Glioblastoma,Interstitial Fluid Pressure and Velocity,IDH1,Ki-67
Introduction
Glioblastoma is the most common primary malignant tumor of central nervous system1, which is characterized by extensive invasion, strong invasion and angiogenesis. Conventional MRI sequences could only reflect the anatomical information, morphological characteristics and enhancement mode of the tumor. Recently, computational models were established to simulate interstitial fluid pressure (IFP) and velocity (IFV) based on dynamic contrast enhanced (DCE)-MRI2. Previous clinical studies have shown that the increase of IFP is closely related to the occurrence and prognosis of tumors3. At present, the gold standard for measuring IFP is wick-in-needle (WIN) method, but it is invasive4-6. The purpose of this study is to explore correlation of computational modeling of IFP and IFV based on DCE-MRI with immunohistochemistry markers (IDH1 expression and Ki-67 level) in glioblastoma, and explore the diagnosis performance for distinguishing IDH1-mutation patients.Materials and Methods
Patients data between 2020 and 2021 meeting the following criteria were reviewed: (1) Pathologically confirmed glioblastoma; (2) Underwent DCE-MRI examination before surgery in a 3.0T MR scanner (uMR770, United Imaging Healthcare); (3) IDH1 expression and Ki-67 level were evaluated by immunohistochemistry of tumor samples after surgery. IDH1 expression (0: wild; 1/2/3: mutation +/++/+++) and Ki-67 level (0 ~ 100%) were evaluated by immunohistochemistry of tumor samples after surgery.DCE-MRI based on transverse T1-weighted spoiled gradient-echo sequence were performed before, during and after the injection of contrast agent (CA) (gadodiamide injection, 0.2mL/kg, 3.5mL/s). 100 time-points were acquired during 4min 10s (temporal resolution 2.5s).
The permeability parameters were calculated from extended Tofts model (ETM)7.
$$C_{t}(t) = K^{trans}\int_{0}^{t}{e}^{-k_{ep}(t-\tau)}C_{p}(τ)\text{d}\tau +v_{p}C_{p}(t)$$
where Ktrans is the volume transfer constant, vp is the volume of extravascular extracellular space, kep is the transport rate constant of CA from the extravascular extracellular space, and Cp(t) is the plasma CA concentration with time. Volume-of-interests were delineated manually including the whole tumor on late DCE images. The partial differential equation of IFP and IFV was formulated from the continuity equation and solved in MATLAB.
$$−K_{H}\nabla^{2}p_{i} = K^{trans}/<K^{trans}>[L_{p}S/V(p_{eff}−p_{i})] –L_{pL}S_{L}/V(p_{i}−p{L})$$
Where pi is the pressure in interstitial space, peff is the effective pressure in vascular after considering tumor osmotic pressure, Lp is the hydraulic conductivity of the vessel wall; S/V is the surface to volume ratio of the capillary wall. The lymphatic clearance term LpLSL/V is assumed to be zero in the brain. All modeling parameters were decided according to foreknowledge from previous studies2,8.
Spearman’s correlation was used to assess the relationship between IFP and IFV indicators (mean, standard deviation (SD), kurtosis, skewness) and immunohistochemistry markers. Mann-Whitney U test was used to compare the IFP indicators between IDH1-wild group and IDH1-mutation group. The receiver operating curve (ROC) curve analysis was performed to assess the diagnostic performance of IFP indicators in distinguishing IDH1-mutation patients from IDH1-wild. Significance criteria was P<0.05 for all statistic results.
Results
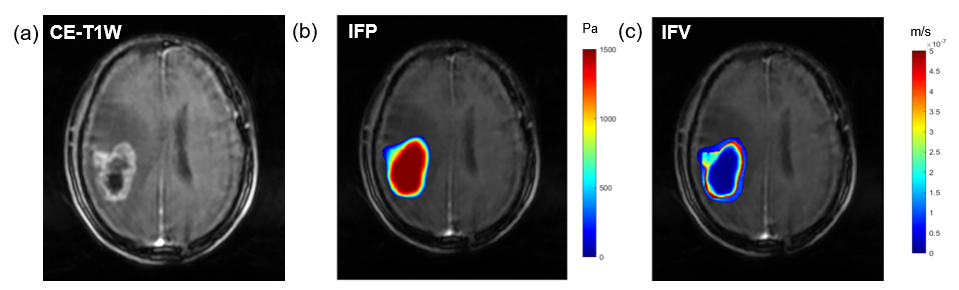
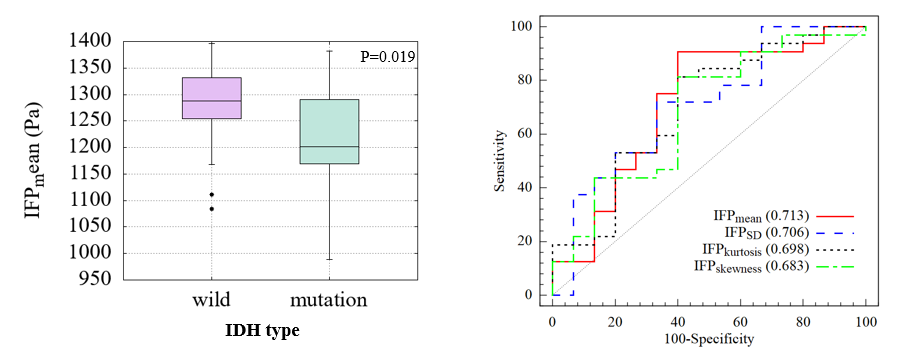
Fifty-two patients were included (mean age 56.9±9.8, 28 females). IFP and IFV mappings were obtained for each patient (an example in Figure 1). The IDH1 expression was significantly correlated with IFPmean (P=0.019, r=−0.342), IFPSD (P=0.026, r=0.324), IFPkurtosis (P=0.04, r=−0.300), and IFPskewness (P=0.05, r=0.288). Ki-67 level was correlated with IFPSD (P=0.047, r=0.280). No significance was found in other statistic results.Compared to IDH1-wild group, IDH1-mutation group showed significantly lower IFPmean (1282 Pa vs 1215 Pa, P=0.020) and IFPkurtosis (3.944 vs 3.292, P=0.030), and significantly higher IFPSD (241 Pa vs 275 Pa, P=0.024) and IFPskewness (-1.199 vs -0.986, P=0.045). IFPmean had best diagnosis performance (AUC=0.713) among IFP indicators (Figure 2).
Discussion
This study found that computational modeled IFP were associated with the expression of IDH1 in glioblastoma. Previous studies have shown that DCE perfusion parameters such as Ktrans and Ve reflect vascular permeability and can be used to predict IDH mutation status of glioma9. IFP is closely associated with tumor permeability, and could be affected by the microvascular properties within the tumor. Compared with IDH mutant, IDH wild-type glioma has faster tumor cell proliferation, richer neovascularization and higher permeability. Ki-67 reflects the proliferation of tumor cells and can be used to distinguish low-grade glioma from high-grade glioma. Previous study reported that Ki-67 in high-grade glioma is higher than that in low-grade glioma10-11. Therefore, IFP indicators have potential significance in predicting the molecular classification, tumor recurrence and prognosis of glioma.Conclusion
IFP indicators calculated from DCE-MRI have significant correlation with the IDH mutation status and Ki-67 level, and hold potential to predict IDH1 mutant and IDH1 wild type of glioma.Acknowledgements
The authors would like to thank National Natural Science Foundation of China for research foundation.References
1. Ostrom QT, Gittleman H, Truitt G, Boscia A, Kruchko C, Barnholtz-Sloan JS. CBTRUS Statistical Report: Primary Brain and Other Central Nervous System Tumors Diagnosed in the United States in 2011-2015. Neuro Oncol. 2018 Oct 1;20(suppl_4): iv1-iv86.
2. LoCastro, E., et al., Computational modeling of interstitial fluid pressure and velocity in head and neck cancer based on dynamic contrast-enhanced magnetic resonance imaging: feasibility analysis. Tomography, 2020. 6(2): p. 129-138.
3. Yeo, S.G.; Kim, J.S.; Cho, M.J.; Kim, K.H.; Kim, J.S. Interstitial Fluid Pressure as a Prognostic Factor in Cervical Cancer Following Radiation Therapy. Clin. Cancer Res. 2009, 15, 6201–6207.
4. Chauhan, V.P.; Boucher, Y.; Ferrone, C.R.; Roberge, S.; Martin, J.D.; Stylianopoulos, T.;Bardeesy, N.; DePinho, R.A.; Padera, T.P.;Munn, L.L.; et al. Compression of Pancreatic Tumor Blood Vessels by Hyaluronan Is Caused by Solid Stress and Not Interstitial Fluid Pressure. Cancer Cell 2014, 26, 14–15.
5. Provenzano PP, Hingorani SR. Hyaluronan, fluid pressure, and stromal resistance in pancreas cancer. Br J Cancer. 2013 Jan 15;108(1):1-8.
6. DuFort CC, DelGiorno KE, Carlson MA, Osgood RJ, Zhao C, Huang Z, Thompson CB, Connor RJ, Thanos CD, Scott Brockenbrough J, Provenzano PP, Frost GI, Michael Shepard H, Hingorani SR. Interstitial Pressure in Pancreatic Ductal Adenocarcinoma Is Dominated by a Gel-Fluid Phase. Biophys J. 2016 May 10;110(9):2106-2119.
7. Tofts, P.S. et al. Estimating kinetic parameters from dynamic contrast-enhanced T(1)-weighted MRI of a diffusable tracer: Standardized quantities and symbols. J. Magn. Reson. Imaging 1999, 10, 223–232
8. Swinburne, N., et al., Computational modeling of interstitial fluid pressure and velocity in non-small cell lung cancer brain metastases treated with stereotactic radiosurgery. Frontiers in neurology, 2020. 11: p. 402.
9. Hu Y, Chen Y, Wang J, Kang JJ, Shen DD, Jia ZZ. Non-Invasive Estimation of Glioma IDH1 Mutation and VEGF Expression by Histogram Analysis of Dynamic Contrast-Enhanced MRI. Front Oncol. 2020 Dec 8; 10:593102.
10. Skjulsvik AJ, Mørk JN, Torp MO, Torp SH. Ki-67/MIB-1 immunostaining in a cohort of human gliomas. Int J Clin Exp Pathol. 2014 Dec 1;7(12):8905-8910.
11. Theresia E, Malueka RG, Pranacipta S, Kameswari B, Dananjoyo K, Asmedi A, Wicaksono AS, Hartanto RA, Dwianingsih EK. Association between Ki-67 Labeling index and Histopathological Grading of Glioma in Indonesian Population. Asian Pac J Cancer Prev. 2020 Apr 1;21(4):1063-1068.Figures