0265
Exploring neuroimaging biomarkers and their correlations to neurocognitive function in adult childhood cancer survivors1Department of Medical Radiation Sciences, Institute of Clinical Sciences, Sahlgrenska Academy, University of Gothenburg, Gothenburg, Sweden, 2Department of Medical Physics and Biomedical Engineering, Sahlgrenska University Hospital, Gothenburg, Sweden, 3Department of Clinical Neuroscience, Institute of Neuroscience and Physiology, Sahlgrenska Academy, University of Gothenburg, Gothenburg, Sweden, 4Department of Oncology, Institute of Clinical Sciences, Sahlgrenska Academy, University of Gothenburg, Gothenburg, Sweden, 5Department of Pharmacology, Institute of Neuroscience and Physiology , Sahlgrenska Academy, University of Gothenburg, Gothenburg, Sweden, 6Department of Radiology, Institute of Clinical Sciences, Sahlgrenska Academy, University of Gothenburg, Gothenburg, Sweden
Synopsis
Keywords: Tumors, Radiotherapy, DTI, MR spectroscopy
Cranial radiotherapy (CRT) is effective; however, survivors of childhood cancer often suffer from cognitive deficits. Two adult patient groups that received different CRT exposures as children were included, as well as healthy volunteers. The MR-examination comprised of anatomical imaging, DTI and MR spectroscopy of the hippocampus. Differences were found between the group that received highest CRT dose and the control group in hippocampal volume, tNAA/tCr-ratio of hippocampus and several DTI-measures in e.g., corpus callosum. Correlations was found between DTI-measures (MD/RD/AD) in some of the studied white matter tracts and several of the used neuropsychological tests, e.g., BVMT-R Sum and Coding.INTRODUCTION
Modern cranial radiotherapy (CRT), together with improvements in other treatment modalities has resulted in an increased population of long-term survivors of childhood cancer. However, for tumours in the brain or head-and-neck (H&N) region, the CRT causes radiation exposure also to the healthy brain tissue, which can result in cognitive deficits1. Late effects have been studied histologically, showing e.g. vascular abnormality, demyelination and white matter necrosis2, however, the pathogenesis of these damages is still poorly understood.Neuroimaging using magnetic resonance (MR) methods can provide information on tissue morphology, physiology and metabolism and have thereby a great potential to provide imaging biomarkers for in vivo brain applications regarding late effects due to CRT.
This study aimed to evaluate very late effects of CRT on neuroimaging biomarkers in adult survivors of malignant childhood posterior fossa tumours, mainly medulloblastoma (MB), and nasopharyngeal tumours (NP), representing two groups with different RT exposures to different parts of the brain, and to compare the neuroimaging results of these survivors to healthy controls (C). A second aim was to study if alterations in neuroimaging biomarkers correlated with reduced cognitive function.
METHODS
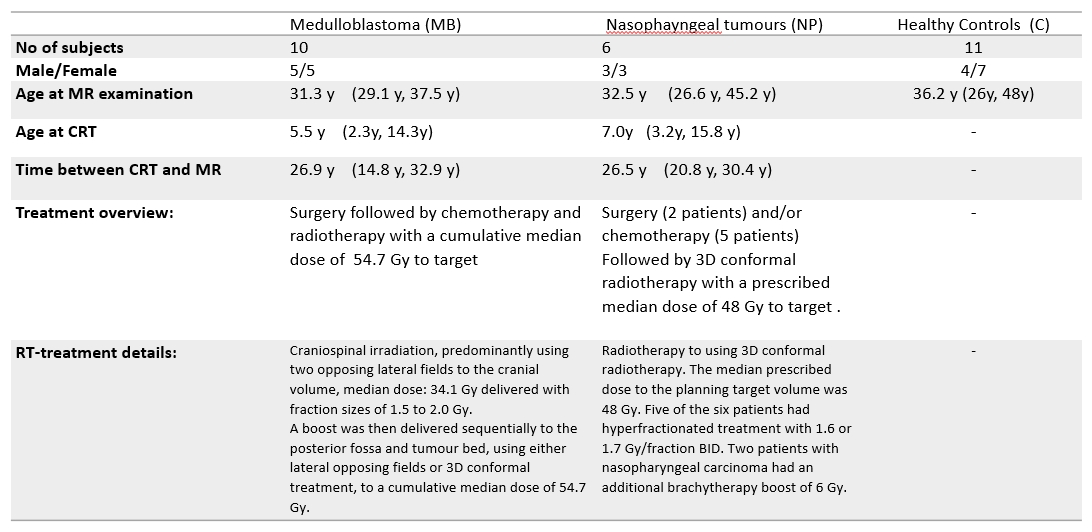
Adult childhood cancer survivors treated for two different types of tumours were studied: childhood posterior fossa tumours, mostly medulloblastoma (n=10), nasophayngeal tumours (n=6), as well as a group of age and sex-matched healthy volunteers (n=11). Characteristic data regarding the subjects and their treatment are summarized in table 1. The study was approved by the local ethical committee (ref numbers: 721-2015 with amendment 2021-03732 and 1067-16 with amendment T1068-17).All MR measurements were performed on a Philips Gyroscan Achieva 3T release 5.1.7 to 5.7.1 (Philips Medical systems, Eindhoven, the Netherlands) using the 32 channel headcoil. The MR protocol comprised of a 3D T1-weighted turbo field echo sequence, DTI (32 directions TE/TR 86/4075 ms, voxel size 23mm3) and MRS separately in the left and right anterior hippocampus (PRESS, TE/TR 40/2000 ms, VOI size= 10*15*30 mm3).
Hippocampus volumes and intracranial volumes were obtained from FreeSurfer segmentations3. DTI parameters (fractional anisotropy (FA), mean diffusivity (MD), radial diffusivity (RD) and axial diffusivity (AD)) were estimated with FSL4 and evaluated in the following tracts generated by TractSeg5: cingulum, fornix , superior longitudinal fascicle part I, II and III, uncinate fascicle and corpus callosum (CC; both full tract and all seven subdivisions). MRS data was evaluated with LCModel6 using in house simulated basis sets7. A preliminary evaluation of the MRS data has been presented at ISMRM 20208.
The evaluation of the neurocognitive function of the cohort has been published9. The tests included in the evaluation were: Rey Auditory Verbal Learning Test (RAVLT, measuring verbal learning (RAVLT-Sum) and memory (RAVLT-Ret)), Brief Visuospatial Memory Test-Revised (BVMT-R, measuring visuo-spatial learning (BVMT-R sum) and memory (BVMT-R ret)), Trail Making Test (TMT A and B, measuring visual attention, process speed and mental flexibility(B)), D-KEFS Color-Word Interference Test ((CWIT) 1 to 4, measuring verbal speed and interference, 4 also adds a measure of cognitive flexibility) and WAIS-IV Coding (Coding, measuring mental speed, sustained attention, and visuo-motor co-ordination).
Mann-Whitney U-test was used to test for group differences. Given the exploratory focus of this study, no correction for multiple correlations was performed. Statistical significance was set to p≤0.05 for evaluation of hippocampal volume and MRS, and p≤0.005 for the DTI-measures (FA/MD/RA/AD). The correlation analysis was performed using linear regression and R2 is given by the square of the Pearson correlation coefficient.
RESULTS & DISCUSSION
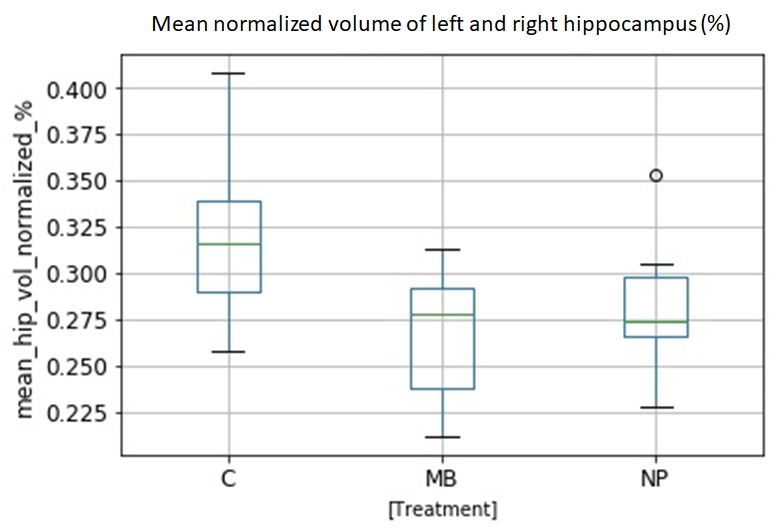
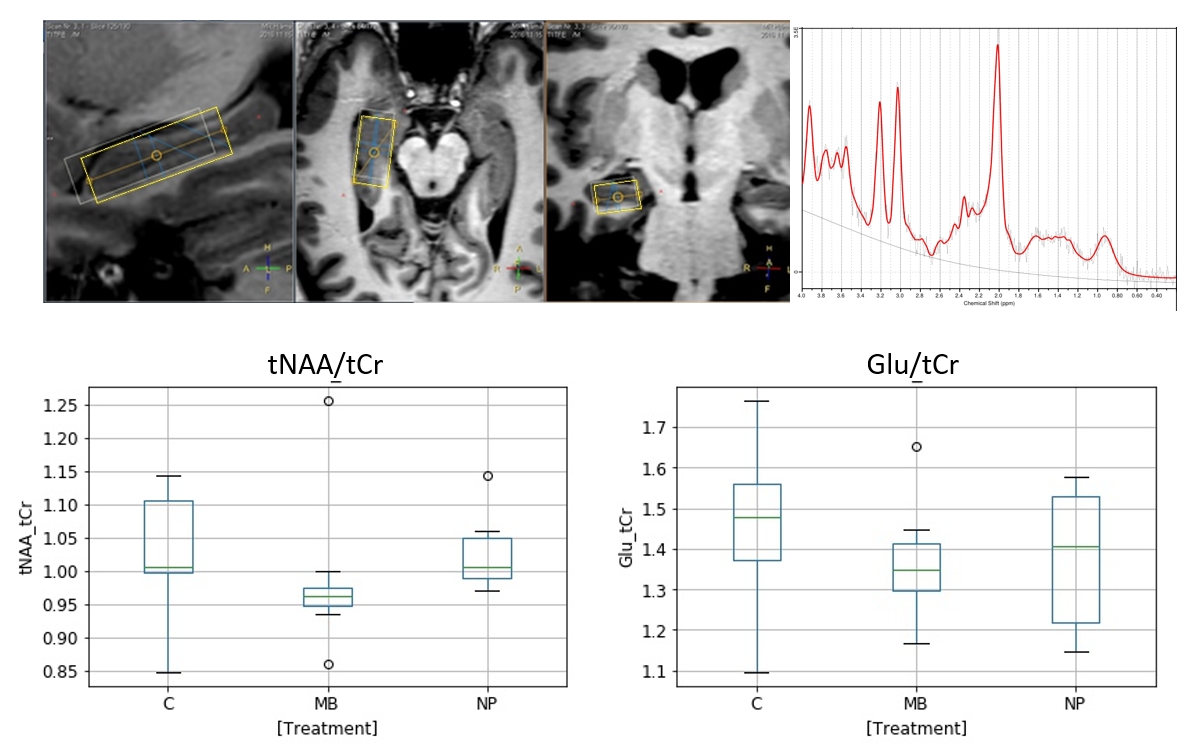
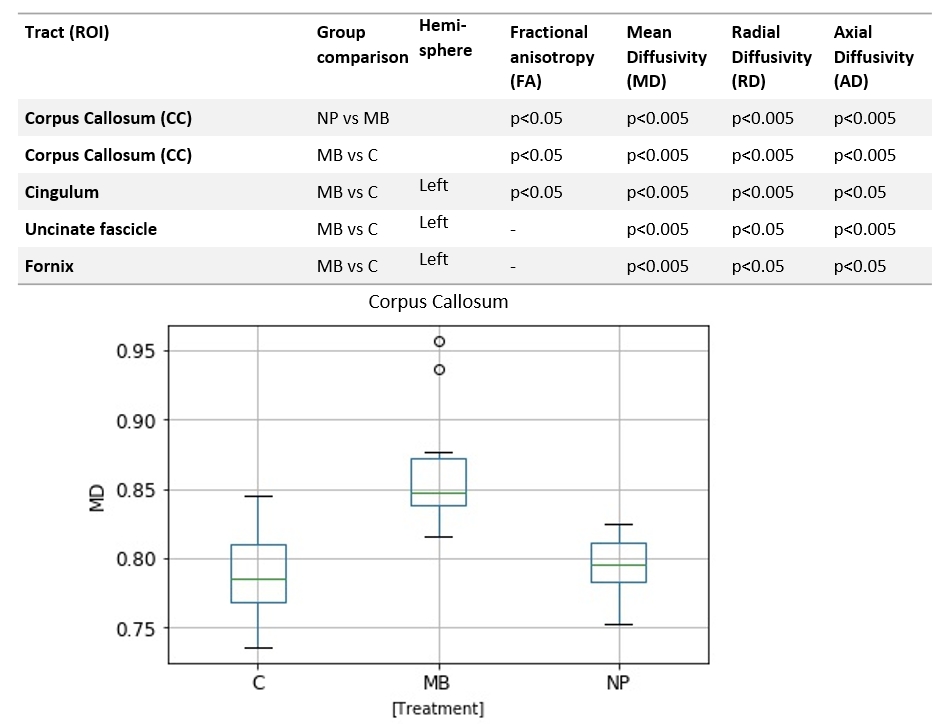
Hippocampal volume was lower in MB compared to NP and controls, figure 1, as expected10. MRS showed lower mean tNAA/tCr ratio in both hippocampi compared to controls and NP. There was also a not statistically significant tendency for a lower Glu/tCr ratio for MB as compared to NP and controls (fig 2). Lowered tNAA indicates long-term neuronal damage and dysfunction11 while lowered Glu could be caused by neuronal and glial damage and dysfunction12.Eight out of 60 possible combinations of evaluated white matter tracts and DTI-measures (FA, MD, AD & RD) differed between MB and controls (fig 3). The only significant difference between MB and NP was found in the CC tract for MD, AD, and RD.
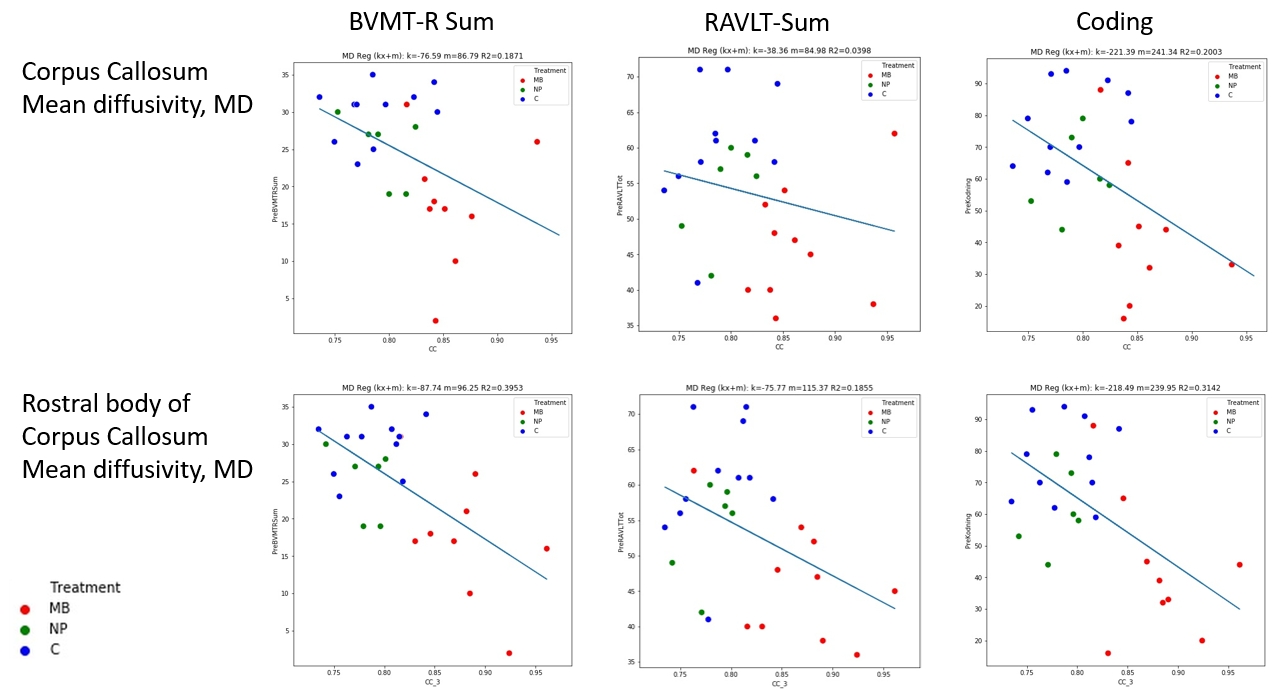
Correlations between neurocognitive measures and DTI measures were primarily found between each of the tests: BVMT-R Sum (visual learning), RAVLT Sum (verbal learning) and Coding (processing speed), and the CC and its subdivisions (fig 4). The R2-coefficient was moderate (R2<0.4), but a general pattern could be seen where MB separated from the other two groups in both neurocognitive performance and DTI measures.
CONCLUSION
This study found differences more than 20 years after CRT between the group that received highest CRT dose and the control group regarding hippocampal volume, tNAA/tCr-ratio in the hippocampus and in several DTI-measures, e.g in corpus callosum. A correlation between e.g. lower mean diffusivity in the studied white matter tracts and several of the neuropsychological tests, e.g. BVMT-R Sum and Coding, was also found.These results indicate associations between the MR-derived neuroimaging biomarkers and impairments in psychomotor speed, learning and memory following radiation to the brain during childhood. Thus, MRI and MRS could add valuable information to increase the understanding of the pathogenesis of radiation-induced brain damage.
Acknowledgements
The study was financed by grants from the Swedish Cancer Society, the King Gustav V Jubilee Clinic Cancer Research Foundation, The Swedish Childhood Cancer Foundation, Lion's Cancer Research Fund of Western Sweden and the Swedish state under the agreement between the Swedish government and the county councils, the ALF-agreement.
The authors thank Philips Healthcare Clinical Science Group for support.
References
1. Makale MT, McDonald CR, Hattangadi-Gluth JA et al. Mechanisms of radiotherapy-associated cognitive disability in patients with brain tumours. Nat Rev Neurol. 2017; 13(1):52-64.
2. Lumniczky K, Szatmári T, Sáfrány G. Ionizing Radiation-Induced Immune and Inflammatory Reactions in the Brain. Front Immunol. 2017; 8(517):1-13
3. Reuter, M., Schmansky, N.J., Rosas, H.D., Fischl, B. Within-Subject Template Estimation for Unbiased Longitudinal Image Analysis. Neuroimage. 2012; 61(4): 1402-1418
4. Jenkinson M, Beckmann C F, Behrens T.E. et al. FSL. NeuroImage, 2012; 62:782-790
5. Wasserthalab J, Nehera P, Maier-Heinac K H. TractSeg - Fast and accurate white matter tract. NeuroImage. 2018; 183: 239-253
6. Provencher S W. Estimation of metabolite concentrations from localized in vivo proton NMR spectra. Magn Reson Med. 1993; 30(6):672-629
7. Jalnefjord O, Pettersson P, Lundholm L et al. Simulated basis sets for semi‑LASER: the impact of including shaped RF pulses and magnetic field gradients. Magnetic Resonance Materials in Physics, Biology and Medicine. 2021; 34:545–554
8. 6.Ljungberg M, Fernström E, Jalnefjord O, et al. Hippocampal MR Spectroscopy show chronic metabolic effects following cranial radiotherapy in childhood cancer survivors. Annual Meeting for International Society of Magnetic Resonance in Medicine (ISMRM), 2020, #284.
9. Rydén I, Fernström E, Lannering B, et al. Neuropsychological functioning in childhood cancer survivors following cranial radiotherapy – results from a long-term follow-up clinic, Neurocase, 2022; 28(2): 163-172
10. Seibert T M, Karunamuni R, Bartsch H. Radiation dose-dependent hippocampal atrophy detected with longitudinal volumetric MRI, Int J Radiat Oncol Biol Phys. 2017; 97(2): 263–269
11. Sundgren P, Cao Y. Brain irradiation: Effects on normal brain parenchyma and radiation injury Neuroimaging Clin N Am. 2009; 19(4): 657–668
12. Chang L, Munsaka S M, Kraft-Terry S. Magnetic Resonance Spectroscopy to Assess NeuroInflammation and Neuropathic Pain J Neuroimmune Pharmacol. 2013; 8(3): 576–593
Figures